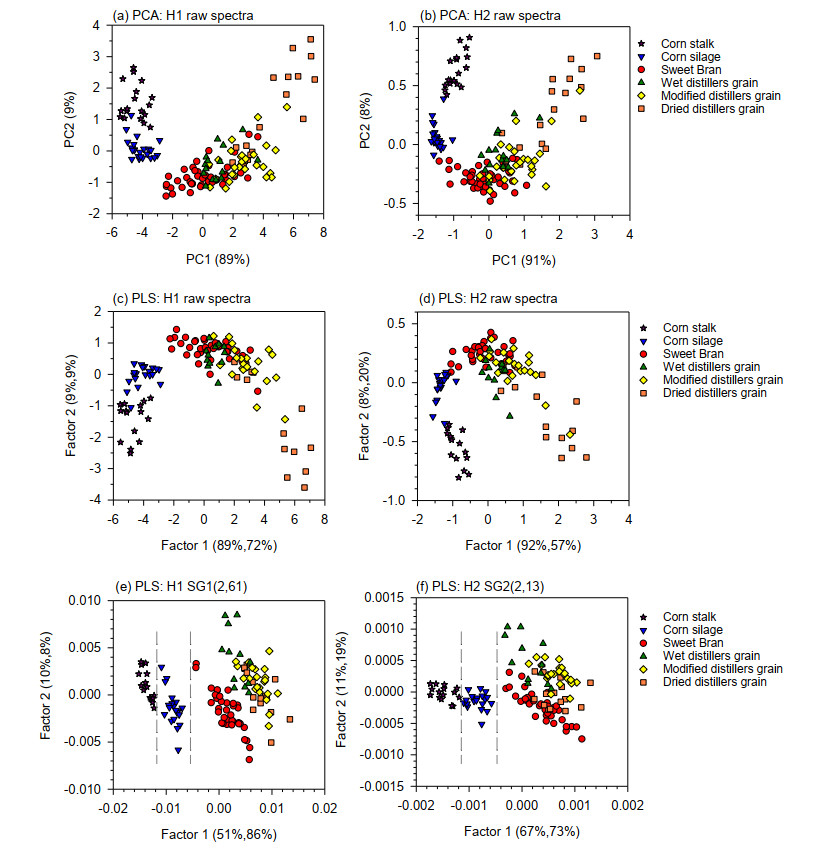
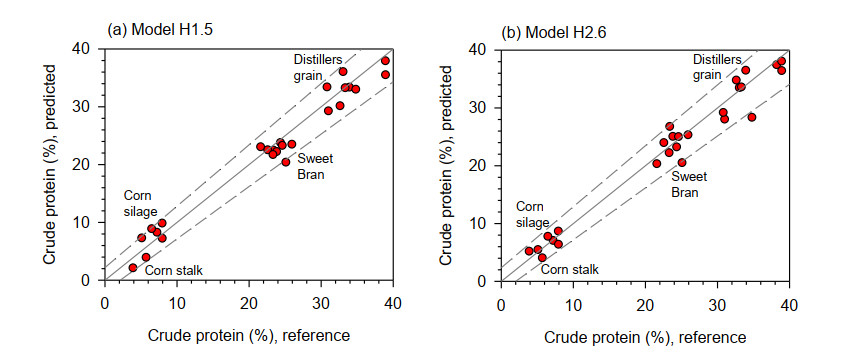
Two handheld near infrared (NIR) spectrometers were used to quantify crude protein ($CP$) content of mixed forage and feedstuff composed of Sweet Bran, distiller's grains, corn silage, and corn stalk. First was a transportable spectrometer, which measured in the visible and NIR ranges (320–2500 nm) with a spectral interval of 1 nm (H1). Second was a smartphone spectrometer, which measured from 900–1700 nm with a spectral interval of 4 nm (H2). Spectral data of 147 forage and feed samples were collected by both handheld instruments and split into calibration ($n$ = 120) and validation ($n$ = 27) sets. For H1, only absorbances in the NIR region (780–2500 nm) were used in the multivariate analyses, while for H2, absorbances in the second and third overtone regions (940–1660 nm) were used. Principal component analysis (PCA) and partial least squares (PLS) regression models were developed using mean-centered data that had been preprocessed using standard normal variate (SNV) or Savitzky-Golay first derivative (SG1) or second derivative (SG2) algorithm. PCA models showed two major groups—one with Sweet Bran and distillers grains, and the other with corn silage and corn stalk. Using H1 spectra, the PLS regression model that best predicted $CP$ followed SG1 preprocessing. This model had low root mean square error of prediction ($RMSEP$ = 2.22%) and high ratio of prediction to deviation ($RPD$ = 5.24). With H2 spectra, the model best predicting $CP$ was based on SG2 preprocessing, returning $RMSEP$ = 2.05% and $RPD$ = 5.74. These values were not practically different than those of H1, indicating similar performance of the two devices despite having absorbance measurements only in the second and third overtone regions with H2. The result of this study showed that both handheld NIR instruments can accurately measure forage and feed $CP$ during screening, quality, and process control applications.
Citation: Isaac R. Rukundo, Mary-Grace C. Danao, James C. MacDonald, Randy L. Wehling, Curtis L. Weller. Performance of two handheld NIR spectrometers to quantify crude protein of composite animal forage and feedstuff[J]. AIMS Agriculture and Food, 2021, 6(2): 462-477. doi: 10.3934/agrfood.2021027
Two handheld near infrared (NIR) spectrometers were used to quantify crude protein ($CP$) content of mixed forage and feedstuff composed of Sweet Bran, distiller's grains, corn silage, and corn stalk. First was a transportable spectrometer, which measured in the visible and NIR ranges (320–2500 nm) with a spectral interval of 1 nm (H1). Second was a smartphone spectrometer, which measured from 900–1700 nm with a spectral interval of 4 nm (H2). Spectral data of 147 forage and feed samples were collected by both handheld instruments and split into calibration ($n$ = 120) and validation ($n$ = 27) sets. For H1, only absorbances in the NIR region (780–2500 nm) were used in the multivariate analyses, while for H2, absorbances in the second and third overtone regions (940–1660 nm) were used. Principal component analysis (PCA) and partial least squares (PLS) regression models were developed using mean-centered data that had been preprocessed using standard normal variate (SNV) or Savitzky-Golay first derivative (SG1) or second derivative (SG2) algorithm. PCA models showed two major groups—one with Sweet Bran and distillers grains, and the other with corn silage and corn stalk. Using H1 spectra, the PLS regression model that best predicted $CP$ followed SG1 preprocessing. This model had low root mean square error of prediction ($RMSEP$ = 2.22%) and high ratio of prediction to deviation ($RPD$ = 5.24). With H2 spectra, the model best predicting $CP$ was based on SG2 preprocessing, returning $RMSEP$ = 2.05% and $RPD$ = 5.74. These values were not practically different than those of H1, indicating similar performance of the two devices despite having absorbance measurements only in the second and third overtone regions with H2. The result of this study showed that both handheld NIR instruments can accurately measure forage and feed $CP$ during screening, quality, and process control applications.

| [1] | Roberts CA, Stuth J, Flinn P (2004) Analysis of forages and feedstuffs, In: Roberts CA, Jr. JW, Ⅲ JBR (Eds.), Near‐Infrared Spectroscopy in Agriculture, American Society of Agronomy, Inc., Crop Science Society of America, Inc., Soil Science Society of America, Inc., 229-267. |
| [2] |
Shenk JS, Westerhaus MO (1985) Accuracy of NIRS instruments to analyze forage and grain. Crop Sci 25: 1120-1122. doi: 10.2135/cropsci1985.0011183X002500060054x

|
| [3] | Barton FE, Windham WR (1988) Determination of acid-detergent fiber and crude protein in forages by near-infrared reflectance spectroscopy: collaborative study. J Assoc Off Anal Chem 71: 1162-1167. |
| [4] |
Smith KF, Flinn PC (1991) Monitoring the performance of a broad-based calibration for measuring the nutritive value of two independent populations of pasture using near infrared reflectance (Nir) spectroscopy. Aust J Exp Agric 31: 205-210. doi: 10.1071/EA9910205
|
| [5] | Crocombe RA, Flanders DC, Atia W (2004) Micro-optical instrumentation for process spectroscopy, In: Smith LA, Sobek D (Eds.), Lab-on-a-Chip: Platforms, Devices, and Applications, International Society for Optics and Photonics, 11. |
| [6] |
Capitán-Vallvey LF, Palma AJ (2011) Recent developments in handheld and portable optosensing-A review. Anal Chim Acta 696: 27-46. doi: 10.1016/j.aca.2011.04.005
|
| [7] |
Crocombe RA (2018) Portable spectroscopy. Appl Spectrosc 72: 1701-1751. doi: 10.1177/0003702818809719
|
| [8] |
Stark E, Luchter K (2005) NIR instrumentation technology. NIR news 16: 13-16. doi: 10.1255/nirn.855
|
| [9] |
Beć KB, Grabska J, Siesler HW, et al. (2020) Handheld near-infrared spectrometers: Where are we heading? NIR news 31: 28-35. doi: 10.1177/0960336020916815
|
| [10] |
Blanco M, Villarroya I (2002) NIR spectroscopy: A rapid-response analytical tool. TrAC-Trends Anal Chem 21: 240-250. doi: 10.1016/S0165-9936(02)00404-1
|
| [11] |
Shenk JS, Landa I, Hoover MR, et al. (1981) Description and evaluation of a near infrared reflectance spectro‐computer for forage and grain analysis. Crop Sci 21: 355-358. doi: 10.2135/cropsci1981.0011183X002100030001x
|
| [12] | Williams PC (1975) Application of near infrared reflectance spectroscopy to analysis of cereal grains and oilseeds. Cereal Chem 57: 561-576. |
| [13] |
Valdes EV, Young LG, Leeson S, et al. (1985) Application of near infrared reflectance spectroscopy to analyses of poultry feeds. Poult Sci 64: 2136-2142. doi: 10.3382/ps.0642136
|
| [14] | Paz CC da, Maciel e Silva AG, Rêgo AC do (2019) Use of near infrared spectroscopy for the evaluation of forage for ruminants. Rev Ciências Agrárias 62. |
| [15] |
Landau S, Glasser T, Dvash L (2006) Monitoring nutrition in small ruminants with the aid of near infrared reflectance spectroscopy (NIRS) technology: A review. Small Rumin Res 61: 1-11. doi: 10.1016/j.smallrumres.2004.12.012
|
| [16] |
Reeves JB (1994) Near-versus mid-infrared diffuse reflectance spectroscopy for the quantitative determination of the composition of forages and by-products. J Near Infrared Spectrosc 2: 49-57. doi: 10.1255/jnirs.31
|
| [17] |
Monrroy M, Gutiérrez D, Miranda M, et al. (2017) Determination of Brachiaria spp. forage quality by near-infrared spectroscopy and partial least squares regression. J Chil Chem Soc 62: 3472-3477. doi: 10.4067/S0717-97072017000200010
|
| [18] | Valdes E V., Young LG, Mcmillan I, et al. (1985) Analysis of hay, haylage and corn silage samples by near infrared reflectance spectroscopy. Can J Anim Sci 65: 753-760. |
| [19] |
de Boever JL, Cottyn BG, Vanacker JM, et al. (1995) The use of NIRS to predict the chemical composition and the energy value of compound feeds for cattle. Anim Feed Sci Technol 51: 243-253. doi: 10.1016/0377-8401(94)00695-6
|
| [20] |
De Boever JL, Cottyn BG, De Brabander DL, et al. (1997) Prediction of the feeding value of maize silages by chemical parameters, in vitro digestibility and NIRS. Anim Feed Sci Technol 66: 211-222. doi: 10.1016/S0377-8401(96)01101-7
|
| [21] |
Albanell E, Plaixats J, Ferret A, et al. (1995) Evaluation of near-infrared reflectance spectroscopy for predicting stover quality trait in semi-exotic populations of maize. J Sci Food Agric 69: 269-273. doi: 10.1002/jsfa.2740690302
|
| [22] |
Volkers KC, Wachendorf M, Loges R, et al. (2003) Prediction of the quality of forage maize by near-infrared reflectance spectroscopy. Anim Feed Sci Technol 109: 183-194. doi: 10.1016/S0377-8401(03)00173-1
|
| [23] |
Choi SW, Park CH, Lee CS, et al. (2013) Prediction of chemical composition in distillers dried grain with solubles and corn using real-time near-infrared reflectance spectroscopy. J Korean Soc Grassl Forage Sci 33: 177-184. doi: 10.5333/KGFS.2013.33.3.177
|
| [24] |
Danieli PP, Carlini P, Bernabucci U, et al. (2004) Quality evaluation of regional forage resources by means of near infrared reflectance spectroscopy. Ital J Anim Sci 3: 363-376. doi: 10.4081/ijas.2004.363
|
| [25] |
González-Martín I, Á lvarez-García N, Hernández-Andaluz JL (2006) Instantaneous determination of crude proteins, fat and fibre in animal feeds using near infrared reflectance spectroscopy technology and a remote reflectance fibre-optic probe. Anim Feed Sci Technol 128: 165-171. doi: 10.1016/j.anifeedsci.2005.11.007
|
| [26] | AOAC (1965) Official Methods of Analysis. AOAC Off Methods Anal. |
| [27] | AOAC (1990) Official Method 990.03. AOAC Off Methods Anal. |
| [28] | R. Rukundo I, C. Danao M-G, B. Mitchell R, et al. (2020) Effect of scanning samples through polypropylene film on predicting nitrogen content of forage using handheld NIR. AIMS Agric Food 5: 835-849. |
| [29] |
Martens H, Martens M (2000) Modified Jack-knife estimation of parameter uncertainty in bilinear modelling by partial least squares regression (PLSR). Food Qual Prefer 11: 5-16. doi: 10.1016/S0950-3293(99)00039-7
|
| [30] |
Verboven S, Hubert M, Goos P (2012) Robust preprocessing and model selection for spectral data. J Chemom 26: 282-289. doi: 10.1002/cem.2446
|
| [31] | Williams P (2001) Implementation of near-infrared technology, In: Williams PC, Norris K (Eds.), Near-Infrared Technology in the Agricultural and Food Industries, St. Paul, American Association of Cereal Chemists, 145-169. |
| [32] | Williams P (2014) The RPD Statistic: A Tutorial Note. NIR news 25: 22-26. |
| [33] |
Weinberg ZG, Szakacs G, Ashbell G, et al. (2001) The effect of temperature on the ensiling process of corn and wheat. J Appl Microbiol 90: 561-566. doi: 10.1046/j.1365-2672.2001.01276.x
|
| [34] |
Yitbarek MB, Tamir B (2014) Silage additives: review. Open J Appl Sci 04: 258-274. doi: 10.4236/ojapps.2014.45026
|
| [35] | Chen H (2015) Integrated industrial lignocellulose biorefinery chains, In: Chen H (Ed.), Lignocellulose Biorefinery Engineering, Elsevier, 219-245. |
| [36] | Zentek J, Knorr F, Mader A (2013) Reducing waste in fresh produce processing and households through use of waste as animal feed, Global Safety of Fresh Produce: A Handbook of Best Practice, Innovative Commercial Solutions and Case Studies, Elsevier Ltd., 140-152. |
| [37] | Rausch KD, Hummel D, Johnson LA, et al. (2018) Wet milling: The basis for corn biorefineries, Corn: Chemistry and Technology, 3rd Edition, Elsevier, 501-535. |
| [38] |
Yu P, Nuez-Ortín WG (2010) Relationship of protein molecular structure to metabolisable proteins in different types of dried distillers grains with solubles: A novel approach. Br J Nutr 104: 1429-1437. doi: 10.1017/S0007114510002539
|
| [39] |
Chang C-W, Laird DA, Mausbach MJ, et al. (2001) Near-infrared reflectance spectroscopy-principal components regression analyses of soil properties. Soil Sci Soc Am J 65: 480-490. doi: 10.2136/sssaj2001.652480x
|
| [40] |
Andueza D, Picard F, Jestin M, et al. (2011) NIRS prediction of the feed value of temperate forages: Efficacy of four calibration strategies. Animal 5: 1002-1013. doi: 10.1017/S1751731110002697
|
| [41] |
Jones GM, Wade NS, Baker JP, et al. (1987) Use of near infrared reflectance spectroscopy in forage testing. J Dairy Sci 70: 1086-1091. doi: 10.3168/jds.S0022-0302(87)80115-7
|
| [42] | Yu-meng L, Zhong-ping Y (2009) Prediction of Fermentation Qualities of Baled Corn Stalk Silage with Near Infrared Reflectance Spectroscopy.pdf. Asian Agric Res 1: 32.34. |
| [43] | Marten GC, Shenk JS, Barton FE (1989) Near infrared reflectance spectroscopy (NIRS): analysis of forage quality, U.S. Dept. of Agriculture, Agricultural Research Service. |
| [44] | Stuth J, Jama A, Tolleson D (2003) Direct and indirect means of predicting forage quality through near infrared reflectance spectroscopy, Field Crops Research, Elsevier, 45-56. |
| [45] | Shenk JS, Westerhaus MO (1994) The Application of near Infrared Reflectance Spectroscopy (NIRS) to Forage Analysis, In: Fahey GC (Ed.), Forage Quality, Evaluation, and Utilization, American Society of Agronomy, Inc. Crop Science Society of America, Inc. Soil Science Society of America, Inc, 406-449. |
| [46] | Shenk JS, Westerhaus MO, Fahey GC, et al. (1994) The application of near infrared reflectance spectroscopy (NIRS) to forage analysis, In: Fahey GC (Ed.), Forage Quality, Evaluation, and Utilization, American Society of Agronomy, Crop Science Society of America, Soil Science Society of America, 406-449. |
| [47] | Aenugu HPR, Sathis Kumar D, Srisudharson, et al. (2011) Near infrared spectroscopy- an overview. Int J ChemTech Res 3: 825-836. |
| [48] |
Modroño S, Soldado A, Martínez-Fernández A, et al. (2017) Handheld NIRS sensors for routine compound feed quality control: Real time analysis and field monitoring. Talanta 162: 597-603. doi: 10.1016/j.talanta.2016.10.075
|
Figures(3) / Tables(4)

Isaac R. Rukundo, Mary-Grace C. Danao, James C. MacDonald, Randy L. Wehling, Curtis L. Weller. Performance of two handheld NIR spectrometers to quantify crude protein of composite animal forage and feedstuff[J]. AIMS Agriculture and Food, 2021, 6(2): 462-477. doi: 10.3934/agrfood.2021027


 DownLoad: