In Bogor, the farmers employed several methods for robusta post-harvest processing, including natural, honey, full wash, and wine processing. This research was conducted to examine the influence of the different post-harvest processing methods on volatile compounds and to identify volatile markers that can authenticate coffee roasted under second-crack roasting and characterize its dry aroma. The study identified and semiquantified 140 compounds. Post-harvest processing affected carboxylic acids, esters, alcohols, hydrocarbons, phenolics, thiophenes, and total volatile compounds. Principal component analysis (PCA) modeling showed that natural and honey processes had similar volatile compound compositions, while full wash and wine processes tended to differ. Based on the variable importance in projection (VIP) values from orthogonal partial least square discriminant analysis (OPLS-DA) modeling and percent contribution, two compounds (i.e., ethyl salicylate and 2-Methyl-5-methoxy-4H-pyran-4-one) were identified as potential markers for natural and wine processing. Ethyl acetate and 5-amino-2-methylbenzothiazole were identified as potential markers for wine processing. Honey and full wash processing did not have any distinct volatile marker. Natural processing exhibited a dry aroma of caramelly, roasted peanut, and chocolate, while honey processing had caramelly, nutty, and earthy aromas. Full wash processing had sweet nut, earthy, and herbal aromas with a hint of potato, and wine processing had fermented, winey, molasses, and chocolaty aromas. This research demonstrated that post-harvest processing influenced volatile compounds in second-crack roasted coffee. Identifying potential markers provides valuable information for authenticating second-crack roasted coffee and differentiating it based on post-harvest processing and dry aroma.
Citation: Nur Fajriani Suaib, Didah Nur Faridah, Dede Robiatul Adawiyah, Nuri Andarwulan. Semiquantification of volatile compounds and identification of potential volatile markers and dry aroma from robusta second-crack roasted coffee processed from several post-harvest processing[J]. AIMS Agriculture and Food, 2025, 10(1): 74-96. doi: 10.3934/agrfood.2025005
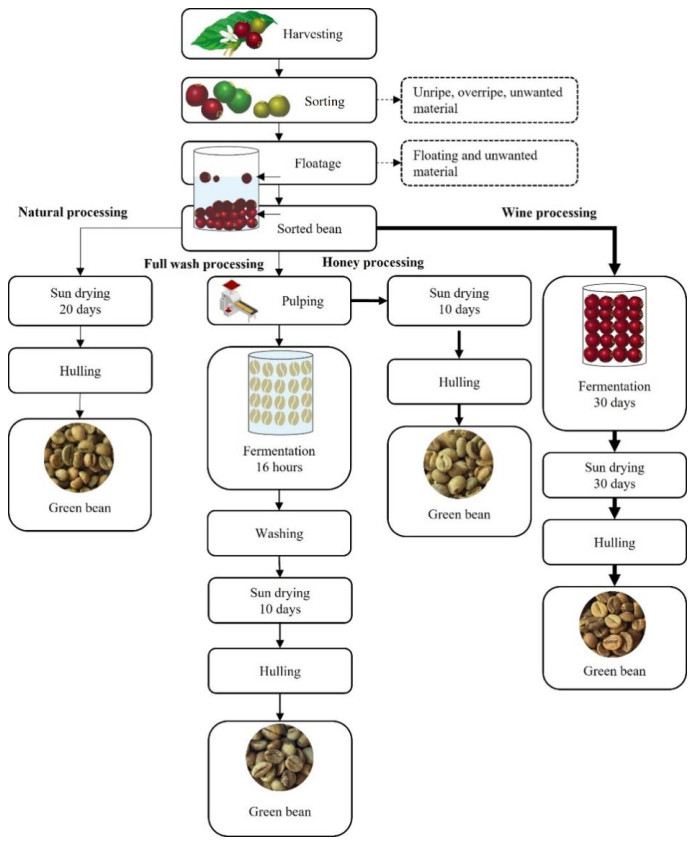
In Bogor, the farmers employed several methods for robusta post-harvest processing, including natural, honey, full wash, and wine processing. This research was conducted to examine the influence of the different post-harvest processing methods on volatile compounds and to identify volatile markers that can authenticate coffee roasted under second-crack roasting and characterize its dry aroma. The study identified and semiquantified 140 compounds. Post-harvest processing affected carboxylic acids, esters, alcohols, hydrocarbons, phenolics, thiophenes, and total volatile compounds. Principal component analysis (PCA) modeling showed that natural and honey processes had similar volatile compound compositions, while full wash and wine processes tended to differ. Based on the variable importance in projection (VIP) values from orthogonal partial least square discriminant analysis (OPLS-DA) modeling and percent contribution, two compounds (i.e., ethyl salicylate and 2-Methyl-5-methoxy-4H-pyran-4-one) were identified as potential markers for natural and wine processing. Ethyl acetate and 5-amino-2-methylbenzothiazole were identified as potential markers for wine processing. Honey and full wash processing did not have any distinct volatile marker. Natural processing exhibited a dry aroma of caramelly, roasted peanut, and chocolate, while honey processing had caramelly, nutty, and earthy aromas. Full wash processing had sweet nut, earthy, and herbal aromas with a hint of potato, and wine processing had fermented, winey, molasses, and chocolaty aromas. This research demonstrated that post-harvest processing influenced volatile compounds in second-crack roasted coffee. Identifying potential markers provides valuable information for authenticating second-crack roasted coffee and differentiating it based on post-harvest processing and dry aroma.

| [1] |
Suaib NF, Faridah DN, Adawiyah DR, et al. (2024) Authentication of volatile and non-volatile compounds in Robusta Java Bogor as a differentiator in post-harvest processes. BIO Web Conf 123: 1–15. http://dx.doi.org/10.1051/bioconf/202412301002 doi: 10.1051/bioconf/202412301002

|
| [2] | Kreicbergs V, Dimins F, Mikelsone V, et al. (2011) Biologically active compounds in roasted coffee. In: Proceedings of the 6th Baltic Conference on Food Science and Technology: Innovations for Food Science and Production, FOODBALT, Jelgava, Latvia, 110–115. |
| [3] | Lambot C, Herrera JC, Bertrand B, et al. (2017) Cultivating coffee quality-terroir and agro-ecosystem. In: Folmer B (Ed.), The Craft and Science of Coffee, Elsevier, 17–49. https://doi.org/10.1016/B978-0-12-803520-7.00002-5 |
| [4] |
Várady M, Tauchen J, Fraňková A, et al. (2022) Effect of method of processing specialty coffee beans (natural, washed, honey, fermentation, maceration) on bioactive and volatile compounds. LWT 172: 1–8. https://doi.org/10.1016/j.lwt.2022.114245 doi: 10.1016/j.lwt.2022.114245
|
| [5] |
Münchow M, Alstrup J, Steen I, et al. (2020) Roasting conditions and coffee flavor: A multi-study empirical investigation. Beverages 6: 1–14. http://dx.doi.org/10.3390/beverages6020029 doi: 10.3390/beverages6020029
|
| [6] | Schenker S, Rothgeb T (2017) The Roast-creating the beans' signature. In: Folmer B (Ed.), The Craft and Science of Coffee, Elsevier, 245–271. https://doi.org/10.1016/B978-0-12-803520-7.00011-6 |
| [7] |
Poyraz İE, Öztürk N, Kıyan HT, et al. (2016) Volatile compounds of Coffea arabica L. green and roasted beans. Anadolu University Journal of Science and Technology C Life Sciences and Biotechnology 5: 31–35. http://dx.doi.org/10.18036/btdc.13390 doi: 10.18036/btdc.13390
|
| [8] |
Yergenson N, Aston DE (2020) Monitoring coffee roasting cracks and predicting with in situ near-infrared spectroscopy. J Food Process Eng 43: 1–10. https://doi.org/10.1111/jfpe.13305 doi: 10.1111/jfpe.13305
|
| [9] |
Cortés-Macías ET, López CF, Gentile P, et al. (2022) Impact of post-harvest treatments on physicochemical and sensory characteristics of coffee beans in Huila, Colombia. Postharvest Biol Technol 187: 1–9. https://doi.org/10.1016/j.postharvbio.2022.111852 doi: 10.1016/j.postharvbio.2022.111852
|
| [10] |
Hernández JA, Heyd B, Trystram G (2008) Prediction of brightness and surface area kinetics during coffee roasting. J Food Eng 89: 156–163. https://doi.org/10.1016/j.jfoodeng.2008.04.026 doi: 10.1016/j.jfoodeng.2008.04.026
|
| [11] |
Franca AS, Oliveira LS, Oliveira RCS, et al. (2009) A preliminary evaluation of the effect of processing temperature on coffee roasting degree assessment. J Food Eng 92: 345–352. https://doi.org/10.1016/j.jfoodeng.2008.12.012 doi: 10.1016/j.jfoodeng.2008.12.012
|
| [12] |
Melo Pereira GV d, Carvalho Neto DP d, Magalhães Júnior AI, et al. (2019) Exploring the impacts of postharvest processing on the aroma formation of coffee beans—A review. Food Chem 272: 441–452. https://doi.org/10.1016/j.foodchem.2018.08.061 doi: 10.1016/j.foodchem.2018.08.061
|
| [13] |
Gonzalez-Rios O, Suarez-Quiroz ML, Boulanger R, et al. (2007) Impact of 'ecological' post-harvest processing on coffee aroma: Ⅱ. Roasted coffee. J Food Compos Anal 20: 297–307. https://doi.org/10.1016/j.jfca.2006.12.004 doi: 10.1016/j.jfca.2006.12.004
|
| [14] |
Barea-Ramos JD, Cascos G, Mesías M, et al. (2022) Evaluation of the olfactory quality of roasted coffee beans using a digital nose. Sensors 22: 1–14. https://doi.org/10.3390/s22228654 doi: 10.3390/s22228654
|
| [15] | Hetzel A (2015) Fine robusta standards and protocols—A compilation of technical standards, evaluation procedures and reference materials for quality-differentiated robusta coffee, California, USA: Coffee Quality Institute, 1–47. |
| [16] |
Ongo EA, Montevecchi G, Antonelli A, et al. (2020) Metabolomics fingerprint of philippine coffee by SPME-GC-MS for geographical and varietal classification. Food Res Int 134: 1–24. https://doi.org/10.1016/j.foodres.2020.109227 doi: 10.1016/j.foodres.2020.109227
|
| [17] |
Senizza A, Rocchetti G, Callegari ML, et al. (2020) Linoleic acid induces metabolic stress in the intestinal microorganism Bifidobacterium breve DSM 20213. Sci Rep 10: 1–11. https://doi.org/10.1038/s41598-020-62897-w doi: 10.1038/s41598-020-62897-w
|
| [18] |
Wilson PS (2014) Coffee roasting acoustics. J Acoust Soc Am 135: 265–269. https://doi.org/10.1121/1.4874355 doi: 10.1121/1.4874355
|
| [19] | Farah A (2012) Coffee constituents. In: Chu Y-F (Ed.), Coffee: Emerging Health Effects and Disease Prevention, England: John Wiley and Sons, 21–58. http://dx.doi.org/10.1002/9781119949893.ch2 |
| [20] | Al-Shemmeri M (2023) Effect of post-harvest processing on coffee's roasting performance. Medium, 1–19. Available from: https://medium.com/@markalshemmeri/effect-of-post-harvest-processing-on-coffees-roasting-performance-130bdfe2da36. |
| [21] | Dupres L (2023) How to get the perfect coffee roasting temperature every time. In: Brew coffee Daily. Available from https://www.brewcoffeedaily.com/guides/roasting/coffee-roasting-temperature/. |
| [22] | Haile M, Hee Kang W (2020) The harvest and post-harvest management practices' impact on coffee quality. In: Castanheira DT (Ed.), Coffee-Production and Research, IntechOpen. 1–18. https://doi.org/10.5772/intechopen.89224 |
| [23] | Gruczyńska E, Kowalska D, Kozłowska M, et al. (2018) Furan in roasted, ground and brewed coffee. Rocz Panstw Zakl Hig 69: 111–118. |
| [24] |
Umano K, Hagi Y, Nakahara K, et al. (1995) Volatile chemicals formed in the headspace of a heated D-glucose/ L-cysteine maillard model system. J Agric Food Chem 43: 2212–2218. https://doi.org/10.1021/jf00056a046 doi: 10.1021/jf00056a046
|
| [25] |
Cannon RJ, Trinnaman L, Grainger B, et al. (2010) The key odorants of coffee from various geographical locations. ACS Symposium Series, American Chemical Society, 77–90. http://dx.doi.org/10.1021/bk-2010-1036.ch006 doi: 10.1021/bk-2010-1036.ch006
|
| [26] |
Afriliana A, Pratiwi D, Giyarto, et al. (2019) Volatile compounds changes in unfermented robusta coffee by re-fermentation using commercial kefir. Nutr Food Sci Int J 8: 1–6. https://doi.org/10.19080/nfsij.2019.08.555745 doi: 10.19080/nfsij.2019.08.555745
|
| [27] |
Liu C, Yang Q, Linforth R, et al. (2019) Modifying robusta coffee aroma by green bean chemical pre-treatment. Food Chem 272: 251–257. https://doi.org/10.1016/j.foodchem.2018.07.226 doi: 10.1016/j.foodchem.2018.07.226
|
| [28] |
Leino M, Lapveteläinen A, Menchero P, et al. (1991) Characterisation of stored arabica and robusta coffees by headspace-GC and sensory analysis. Food Qual Prefer 2: 115–125. https://doi.org/10.1016/0950-3293(91)90031-9 doi: 10.1016/0950-3293(91)90031-9
|
| [29] |
Pavesi Arisseto A, Vicente E, Soares Ueno M, et al. (2011) Furan levels in coffee as influenced by species, roast degree, and brewing procedures. J Agric Food Chem 59: 3118–3124. https://doi.org/10.1021/jf104868g doi: 10.1021/jf104868g
|
| [30] |
Guenther H, Hoenicke K, Biesterveld S, et al. (2010) Furan in coffee: Pilot studies on formation during roasting and losses during production steps and consumer handling. Food Addit Contam 27: 283–290. https://doi.org/10.1080/19440040903317505 doi: 10.1080/19440040903317505
|
| [31] |
Schenker S, Heinemann C, Huber M, et al. (2002) Impact of roasting conditions on the formation of aroma compounds in coffee beans. J Food Sci 67: 60–66. https://doi.org/10.1111/j.1365-2621.2002.tb11359.x doi: 10.1111/j.1365-2621.2002.tb11359.x
|
| [32] |
Moon JK, Shibamoto T (2009) Role of roasting conditions in the profile of volatile flavor chemicals formed from coffee beans. J Agric Food Chem 57: 5823–5831. https://doi.org/10.1021/jf901136e doi: 10.1021/jf901136e
|
| [33] |
Ku Madihah KY, Zaibunnisa AH, Norashikin S, et al. (2012) Optimization of roasting conditions for high-quality robusta coffee. APCBEE Procedia 4: 209–214. https://doi.org/10.1016/j.apcbee.2012.11.035 doi: 10.1016/j.apcbee.2012.11.035
|
| [34] |
Cao X, Wu H, Viejo CG, et al. (2023) Effects of postharvest processing on aroma formation in roasted coffee—A review. Int J Food Sci Technol 58: 1007–1027. http://dx.doi.org/10.1111/ijfs.16261 doi: 10.1111/ijfs.16261
|
| [35] |
Agnoletti Z, Dos W, Gomes S, et al. (2022) Effect of fermentation on the quality of conilon coffee (Coffea canephora): Chemical and sensory aspects rights and content. Microchem J 182: 107966. https://doi.org/10.1016/j.microc.2022.107966 doi: 10.1016/j.microc.2022.107966
|
| [36] |
Zofia NŁ, Aleksandra Z, Tomasz B, et al. (2020) Effect of fermentation time on antioxidant and anti-ageing properties of green coffee kombucha ferments. Molecules 25: 1–26. https://doi.org/10.3390/molecules25225394 doi: 10.3390/molecules25225394
|
| [37] |
Galarza G, Figueroa JG (2022) Volatile compound characterization of coffee (Coffea arabica) processed at different fermentation times using SPME–GC–MS. Molecules 27: 1–15. https://doi.org/10.3390/molecules27062004 doi: 10.3390/molecules27062004
|
| [38] |
Zhang L, Cao Y, Tong J, et al. (2019) An alkylpyrazine synthesis mechanism involving L-threonine-3-dehydrogenase describes the production of 2,5-dimethylpyrazine and 2, 3,5-trimethylpyrazine by Bacillus subtilis. Appl Environ Microbiol 85: 1–15. https://doi.org/10.1128/aem.01807-19 doi: 10.1128/aem.01807-19
|
| [39] |
Müller R, Rappert S (2010) Pyrazines: Occurrence, formation and biodegradation. Appl Microbiol Biotechnol 85: 1315–1320. https://doi.org/10.1007/s00253-009-2362-4 doi: 10.1007/s00253-009-2362-4
|
| [40] |
Kłosowski G, Mikulski D, Pielech-Przybylska K (2021) Pyrazines biosynthesis by Bacillus strains isolated from natto fermented soybean. Biomolecules 11: 1–12. https://doi.org/10.3390/biom11111736 doi: 10.3390/biom11111736
|
| [41] |
Arkadaş M (2018) Formation of volatile compounds in double roasted antakya coffee. Journal of Nutrition, Food Research and Technology 1: 19–22. http://dx.doi.org/10.30881/jnfrt.00006 doi: 10.30881/jnfrt.00006
|
| [42] |
Dippong T, Dan M, Kovacs MH, et al. (2022) Analysis of volatile compounds, composition, and thermal behavior of coffee beans according to variety and roasting intensity. Foods 11: 1–15. https://doi.org/10.3390/foods11193146 doi: 10.3390/foods11193146
|
| [43] | Pereira LL, Júnior DB, Pimenta de Sousa LHB, et al. (2021) Relationship between coffee processing and fermentation. In: Pereira LL (Ed.), Quality Determinants in Coffee Production, Switzerland: Springer, 255–301. https://doi.org/10.1007/978-3-030-54437-9_6 |
| [44] |
Haile M, Kang WH (2019) The role of microbes in coffee fermentation and their impact on coffee quality. J Food Qual 2019: 1–6. https://doi.org/10.1155/2019/4836709 doi: 10.1155/2019/4836709
|
| [45] |
de Bruyn F, Zhang SJ, Pothakos V, et al. (2017) Exploring the impacts of postharvest processing on the microbiota and metabolite profiles during green coffee bean production. Appl Environ Microbiol 83: 1–40. https://doi.org/10.1128/AEM.02398-16 doi: 10.1128/AEM.02398-16
|
| [46] |
Miao Y, Zou Q, Wang Q, et al. (2022) Evaluation of the physiochemical and metabolite of different region coffee beans by using UHPLC-QE-MS untargeted-metabonomics approaches. Food Biosci 46: 1–39. https://doi.org/10.1016/j.fbio.2022.101561 doi: 10.1016/j.fbio.2022.101561
|
| [47] |
Lee BH, Huang CH, Liu TY, et al. (2023) Microbial diversity of anaerobic-fermented coffee and potential for inhibiting ochratoxin-produced Aspergillus niger. Foods 12: 1–17. https://doi.org/10.3390/foods12152967 doi: 10.3390/foods12152967
|
| [48] |
Smit A, Cordero Otero RR, Lambrechts MG, et al. (2003) Enhancing volatile phenol concentrations in wine by expressing various phenolic acid decarboxylase genes in Saccharomyces cerevisiae. J Agric Food Chem 51: 4909–4915. https://doi.org/10.1021/jf026224d doi: 10.1021/jf026224d
|
| [49] |
Yang Y, Wu Z, Li S, et al. (2020) Targeted blood metabolomic study on retinopathy of prematurity. Invest Ophthalmol Vis Sci 61: 1–10. https://doi.org/10.1167/iovs.61.2.12 doi: 10.1167/iovs.61.2.12
|
| [50] |
Rha CS, Jang EK, Hong YD, et al. (2021) Supervised statistical learning prediction of soybean varieties and cultivation sites using rapid uplc-ms separation, method validation, and targeted metabolomic analysis of 31 phenolic compounds in the leaves. Metabolites 11: 3–18. https://doi.org/10.3390/metabo11120884 doi: 10.3390/metabo11120884
|
| [51] |
Nebesny E, Budryn G, Kula J, et al. (2007) The effect of roasting method on headspace composition of robusta coffee bean aroma. European Food Research and Technology 225: 9–19. https://doi.org/10.1007/s00217-006-0375-0 doi: 10.1007/s00217-006-0375-0
|
| [52] |
Mathieu F, Malosse C, Frérot B (1998) Identification of the volatile components released by fresh coffee berries at different stages of ripeness. J Agric Food Chem 46: 1106–1110. https://doi.org/10.1021/jf970851z doi: 10.1021/jf970851z
|
| [53] |
Li S, Tian Y, Sun M, et al. (2022) Characterization of key aroma compounds in fermented bamboo shoots using gas chromatography-olfactometry-mass spectrometry, odor activity values, and aroma recombination experiments. Foods 11: 1–13. https://doi.org/10.3390/foods11142106 doi: 10.3390/foods11142106
|
| [54] |
da Silva Vale A, Balla G, Rodrigues LRS, et al. (2023) Understanding the effects of self-induced anaerobic fermentation on coffee beans quality: Microbiological, metabolic, and sensory studies. Foods 12: 1–20. https://doi.org/10.3390/foods12010037 doi: 10.3390/foods12010037
|
| [55] | Mawardi AD, Fadli ML, Hakim AR, et al. (2020) Karakteristik lahan dalam mendukung perkembangan kopi robusta kabupaten Bogor sebagai produk indikasi geografis. RADAR 1: 1–6. |


Figures(6) / Tables(3)

Nur Fajriani Suaib, Didah Nur Faridah, Dede Robiatul Adawiyah, Nuri Andarwulan. Semiquantification of volatile compounds and identification of potential volatile markers and dry aroma from robusta second-crack roasted coffee processed from several post-harvest processing[J]. AIMS Agriculture and Food, 2025, 10(1): 74-96. doi: 10.3934/agrfood.2025005


 DownLoad: