Epigenetic changes, such as DNA methylation and miRNA-target gene mechanisms, have recently emerged as key provokers in Ischemic stroke (IS) onset. However, cellular and molecular events harboring these epigenetic alterations are poorly understood. Therefore, the present study aimed to explore the potential biomarkers and therapeutic targets for IS.
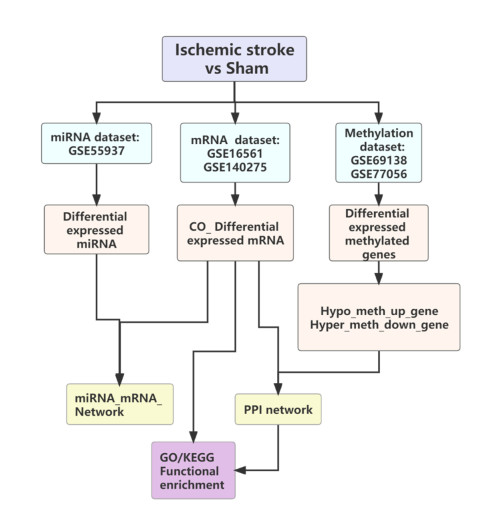
miRNAs, mRNAs and DNA methylation datasets of IS were derived from the GEO database and normalized by PCA sample analysis. Differentially expressed genes (DEGs) were identified, and GO and KEGG enrichment analyses were performed. The overlapped genes were utilized to construct a protein-protein interaction network (PPI). Meanwhile, differentially expressed mRNAs and miRNAs interaction pairs were obtained from the miRDB, TargetScan, miRanda, miRMap and miTarBase databases. We constructed differential miRNA-target gene regulatory networks based on mRNA-miRNA interactions.
A total of 27 up-regulated and 15 down-regulated differential miRNAs were identified. Dataset analysis identified 1053 and 132 up-regulated and 1294 and 9068 down-regulated differentially expressed genes in the GSE16561 and GSE140275 datasets, respectively. Moreover, 9301 hypermethylated and 3356 hypomethylated differentially methylated sites were also identified. Moreover, DEGs were enriched in terms related to translation, peptide biosynthesis, gene expression, autophagy, Th1 and Th2 cell differentiation, primary immunodeficiency, oxidative phosphorylation and T cell receptor signaling pathway. MRPS9, MRPL22, MRPL32 and RPS15 were identified as hub genes. Finally, a differential miRNA-target gene regulatory network was constructed.
RPS15, along with hsa-miR-363-3p and hsa-miR-320e have been identified in the differential DNA methylation protein interaction network and miRNA-target gene regulatory network, respectively. These findings strongly posit the differentially expressed miRNAs as potential biomarkers to improve ischemic stroke diagnosis and prognosis.
Citation: Ming-Xi Zhu, Tian-Yang Zhao, Yan Li. Insight into the mechanism of DNA methylation and miRNA-mRNA regulatory network in ischemic stroke[J]. Mathematical Biosciences and Engineering, 2023, 20(6): 10264-10283. doi: 10.3934/mbe.2023450
Epigenetic changes, such as DNA methylation and miRNA-target gene mechanisms, have recently emerged as key provokers in Ischemic stroke (IS) onset. However, cellular and molecular events harboring these epigenetic alterations are poorly understood. Therefore, the present study aimed to explore the potential biomarkers and therapeutic targets for IS.
miRNAs, mRNAs and DNA methylation datasets of IS were derived from the GEO database and normalized by PCA sample analysis. Differentially expressed genes (DEGs) were identified, and GO and KEGG enrichment analyses were performed. The overlapped genes were utilized to construct a protein-protein interaction network (PPI). Meanwhile, differentially expressed mRNAs and miRNAs interaction pairs were obtained from the miRDB, TargetScan, miRanda, miRMap and miTarBase databases. We constructed differential miRNA-target gene regulatory networks based on mRNA-miRNA interactions.
A total of 27 up-regulated and 15 down-regulated differential miRNAs were identified. Dataset analysis identified 1053 and 132 up-regulated and 1294 and 9068 down-regulated differentially expressed genes in the GSE16561 and GSE140275 datasets, respectively. Moreover, 9301 hypermethylated and 3356 hypomethylated differentially methylated sites were also identified. Moreover, DEGs were enriched in terms related to translation, peptide biosynthesis, gene expression, autophagy, Th1 and Th2 cell differentiation, primary immunodeficiency, oxidative phosphorylation and T cell receptor signaling pathway. MRPS9, MRPL22, MRPL32 and RPS15 were identified as hub genes. Finally, a differential miRNA-target gene regulatory network was constructed.
RPS15, along with hsa-miR-363-3p and hsa-miR-320e have been identified in the differential DNA methylation protein interaction network and miRNA-target gene regulatory network, respectively. These findings strongly posit the differentially expressed miRNAs as potential biomarkers to improve ischemic stroke diagnosis and prognosis.

| [1] |
D. Mozaffarian, E. J. Benjamin, A. S. Go, D. K. Arnett, M. J. Blaha, M. Cushman, et al., Heart disease and stroke statistics-2016 update: A report from the American heart association, Circulation, 133 (2016), e38–e360. https://doi.org/10.1161/CIR.0000000000000409 doi: 10.1161/CIR.0000000000000409

|
| [2] |
S. S. Virani, A. Alonso, E. J. Benjamin, M. S. Bittencourt, C. W. Callaway, A. P. Carson, et al., Heart disease and stroke statistics-2020 update: A report from the American heart association, Circulation, 141 (2020), e139–e596. https://doi.org/10.1161/CIR.0000000000000757 doi: 10.1161/CIR.0000000000000757
|
| [3] |
A. H. Barfejani, M. Jafarvand, S. M. Seyedsaadat, R. T. Rasekhi, Donepezil in the treatment of ischemic stroke: Review and future perspective, Life Sci., 263 (2020), 118575. https://doi.org/10.1016/j.lfs.2020.118575 doi: 10.1016/j.lfs.2020.118575
|
| [4] |
Y. Qian, M. Chopp, J. Chen, Emerging role of microRNAs in ischemic stroke with comorbidities, Exp. Neurol., 331 (2020), 113382. https://doi.org/10.1016/j.expneurol.2020.113382 doi: 10.1016/j.expneurol.2020.113382
|
| [5] |
G. S. Silva, R. G. Nogueira, Endovascular treatment of acute ischemic stroke, Continuum (Minneap Minn), 26 (2020), 310–331. https://doi.org/10.1212/CON.0000000000000852 doi: 10.1212/CON.0000000000000852
|
| [6] |
A. K. Boehme, C. Esenwa, M. S. Elkind, Stroke risk factors, genetics, and prevention, Circ. Res, 120 (2017), 472–495. https://doi.org/10.1161/CIRCRESAHA.116.308398 doi: 10.1161/CIRCRESAHA.116.308398
|
| [7] |
J. W. Doria, P. B. Forgacs, Incidence, implications, and management of seizures following ischemic and hemorrhagic stroke, Curr. Neurol. Neurosci. Rep., 19 (2019), 37. https://doi.org/10.1007/s11910-019-0957-4 doi: 10.1007/s11910-019-0957-4
|
| [8] |
H. Xu, J. Zhang, Y. Ma, J. Gu, X. Jing, S. Lu, et al., The identification and verification of key long noncoding RNAs in ischemic stroke, Biomed. Res. Int., 2020 (2020), 2094320. https://doi.org/10.1155/2020/2094320 doi: 10.1155/2020/2094320
|
| [9] |
H. Wang, L. Shen, Y. Li, J. Lv, Integrated characterisation of cancer genes identifies key molecular biomarkers in stomach adenocarcinoma, J. Clin. Pathol., 73 (2020), 579–586. https://doi.org/10.1136/jclinpath-2019-206400 doi: 10.1136/jclinpath-2019-206400
|
| [10] | G. J. Hankey, Stroke, Lancet, 389 (2017), 641–654. https://doi.org/10.1016/S0140-6736(16)30962-X |
| [11] |
Z. Qi, Y. Zhao, Y. Su, B. Cao, J. J. Yang, Q. Xing, Serum extracellular vesicle-derived miR-124-3p as a diagnostic and predictive marker for early-stage acute ischemic stroke, Front. Mol. Biosci., 8 (2021), 685088. https://doi.org/10.3389/fmolb.2021.685088 doi: 10.3389/fmolb.2021.685088
|
| [12] | The cochrane database of systematic reviews, J. Evid. Based Med., 3 (2010), 130–131. https://doi.org/10.1111/j.1756-5391.2010.01079.x |
| [13] |
H. Saber, B. B. Navi, J. C. Grotta, H. Kamel, A. Bambhroliya, F. S. Vahidy, et al., Real-world treatment trends in endovascular stroke therapy, Stroke, 50 (2019), 683–689. https://doi.org/10.1161/STROKEAHA.118.023967 doi: 10.1161/STROKEAHA.118.023967
|
| [14] |
S. A. Sheth, S. Lee, S. J. Warach, J. Gralla, R. Jahan, M. Goyal, et al., Sex differences in outcome after endovascular stroke therapy for acute ischemic stroke, Stroke, 50 (2019), 2420–2427. https://doi.org/10.1161/STROKEAHA.118.023867 doi: 10.1161/STROKEAHA.118.023867
|
| [15] |
C. V. Borlongan, Concise review: Stem cell therapy for stroke patients: Are we there yet?, Stem Cells Transl. Med., 8 (2019), 983–988. https://doi.org/10.1002/sctm.19-0076 doi: 10.1002/sctm.19-0076
|
| [16] |
Z. G. Zhang, B. Buller, M. Chopp, Exosomes-beyond stem cells for restorative therapy in stroke and neurological injury, Nat. Rev. Neurol., 15 (2019), 193–203. https://doi.org/10.1038/s41582-018-0126-4 doi: 10.1038/s41582-018-0126-4
|
| [17] |
C. Feschotte, N. Jiang, S. R. Wessler, Plant transposable elements: where genetics meets genomics, Nat. Rev. Genet., 3 (2002), 329–341. https://doi.org/10.1038/nrg793 doi: 10.1038/nrg793
|
| [18] |
R. Sunkar, J. K. Zhu, Novel and stress-regulated microRNAs and other small RNAs from Arabidopsis, Plant Cell, 16 (2004), 2001–2019. https://doi.org/10.1105/tpc.104.022830 doi: 10.1105/tpc.104.022830
|
| [19] |
A. M. Cheng, M. W. Byrom, J. Shelton, L. P. Ford, Antisense inhibition of human miRNAs and indications for an involvement of miRNA in cell growth and apoptosis, Nucleic Acids Res., 33 (2005), 1290–1297. https://doi.org/10.1093/nar/gki200 doi: 10.1093/nar/gki200
|
| [20] |
S. Crippa, M. Cassano, M. Sampaolesi, Role of miRNAs in muscle stem cell biology: proliferation, differentiation and death, Curr. Pharm. Des., 18 (2012), 1718–1729. https://doi.org/10.2174/138161212799859620 doi: 10.2174/138161212799859620
|
| [21] |
P. Kumar, H. Wu, J. L. McBride, K. E. Jung, M. H. Kim, et al., Transvascular delivery of small interfering RNA to the central nervous system, Nature, 448 (2007), 39–43. https://doi.org/10.1038/nature05901 doi: 10.1038/nature05901
|
| [22] |
Z. D. Smith, A. Meissner, DNA methylation: roles in mammalian development, Nat. Rev. Genet., 14 (2013), 204–220. https://doi.org/10.1038/nrg3354 doi: 10.1038/nrg3354
|
| [23] |
P. A. Jones, Functions of DNA methylation: islands, start sites, gene bodies and beyond, Nat. Rev. Genet., 13 (2012), 484–492. https://doi.org/10.1038/nrg3230 doi: 10.1038/nrg3230
|
| [24] |
S. Seisenberger, C. Popp, W. Reik, Retrotransposons and germ cells: reproduction, death, and diversity, F1000 Biol. Rep., 16 (2010), 2. https://doi.org/10.3410/B2-44 doi: 10.3410/B2-44
|
| [25] |
S. Wernig-Zorc, M. P. Yadav, P. K. Kopparapu, M. Bemark, H. L. Kristjansdottir, P. O. Andersson, et al., Global distribution of DNA hydroxymethylation and DNA methylation in chronic lymphocytic leukemia, Epigenet. Chromatin, 12 (2019), 4. https://doi.org/10.1186/s13072-018-0252-7 doi: 10.1186/s13072-018-0252-7
|
| [26] |
L. Miao, R. X. Yin, Q. H. Zhang, X. J. Hu, F. Huang, W. X. Chen, et al., Integrated DNA methylation and gene expression analysis in the pathogenesis of coronary artery disease, Aging (Albany NY), 11 (2019), 1486–1500. https://doi.org/10.18632/aging.101847 doi: 10.18632/aging.101847
|
| [27] |
M. E. Ritchie, B. Phipson, D. Wu, Y. Hu, C. W. Law, W. Shi, et al., limma powers differential expression analyses for RNA-sequencing and microarray studies, Nucleic Acids Res., 43 (2015), e47. https://doi.org/10.1093/nar/gkv007 doi: 10.1093/nar/gkv007
|
| [28] |
R. A. Irizarry, B. Hobbs, F. Collin, Y. D. Beazer-Barclay, K. J. Antonellis, U. Scherf, et al., Exploration, normalization, and summaries of high density oligonucleotide array probe level data, Biostatistics, 4 (2003), 249–264. https://doi.org/10.1093/biostatistics/4.2.249 doi: 10.1093/biostatistics/4.2.249
|
| [29] |
Y. Chen, X. Wang, miRDB: an online database for prediction of functional microRNA targets, Nucleic Acids Res., 48 (2020), D127–d131. https://doi.org/10.1093/nar/gkz757 doi: 10.1093/nar/gkz757
|
| [30] |
B. P. Lewis, C. B. Burge, D. P. Bartel, Conserved seed pairing, often flanked by adenosines, indicates that thousands of human genes are microRNA targets, Cell, 120 (2005), 15–20. https://doi.org/10.1016/j.cell.2004.12.035 doi: 10.1016/j.cell.2004.12.035
|
| [31] |
B. John, A. J. Enright, A. Aravin, T. Tuschl, C. Sander, D. S. Marks, Human MicroRNA targets, PLoS Biol., 2 (2004), e363. https://doi.org/10.1371/journal.pbio.0020363 doi: 10.1371/journal.pbio.0020363
|
| [32] |
E. A. C. Goossens, M. R. de Vries, K. H. Simons, H. Putter, P. H. A. Quax, A. Y. Nossent, miRMap: profiling 14q32 microRNA expression and DNA methylation throughout the human vasculature, Front. Cardiovasc. Med., 6 (2019), 113. https://doi.org/10.3389/fcvm.2019.00113 doi: 10.3389/fcvm.2019.00113
|
| [33] |
H. Y. Huang, Y. C. Lin, J. Li, K. Y. Huang, S. Shrestha, H. C. Hong, et al., miRTarBase 2020: updates to the experimentally validated microRNA-target interaction database, Nucleic Acids Res., 48 (2020), D148–d154. https://doi.org/10.1093/nar/gkz896 doi: 10.1093/nar/gkz896
|
| [34] |
P. Shannon, A. Markiel, O. Ozier, N. S. Baliga, J. T. Wang, D. Ramage, et al., Cytoscape: a software environment for integrated models of biomolecular interaction networks, Genome Res., 13 (2003), 2498–2504. https://doi.org/10.1101/gr.1239303 doi: 10.1101/gr.1239303
|
| [35] |
C. von Mering, M. Huynen, D. Jaeggi, S. Schmidt, P. Bork, B. Snel, STRING: a database of predicted functional associations between proteins, Nucleic Acids Res., 31 (2003), 258–261. https://doi.org/10.1093/nar/gkg034 doi: 10.1093/nar/gkg034
|
| [36] |
X. He, J. Zhang, Why do hubs tend to be essential in protein networks? PLoS Genet., 2 (2006), e88. https://doi.org/10.1371/journal.pgen.0020088 doi: 10.1371/journal.pgen.0020088
|
| [37] |
M. Ashburner, C. A. Ball, J. A. Blake, D. Botstein, H. Butler, J. M. Cherry, et al., Gene ontology: Tool for the unification of biology, Nat. Genet., 25 (2000), 25–29. https://doi.org/10.1038/75556 doi: 10.1038/75556
|
| [38] |
M. Kanehisa, S. Goto, KEGG: kyoto encyclopedia of genes and genomes, Nucleic Acids Res., 28 (2000), 27–30. https://doi.org/10.1093/nar/28.1.27 doi: 10.1093/nar/28.1.27
|
| [39] |
M. E. Glickman, S. R. Rao, M. R. Schultz, False discovery rate control is a recommended alternative to Bonferroni-type adjustments in health studies, J. Clin. Epidemiol., 67 (2014), 850–857. https://doi.org/10.1016/j.jclinepi.2014.03.012 doi: 10.1016/j.jclinepi.2014.03.012
|
| [40] |
A. Abukaresh, R. Al-Abadlah, B. Böttcher, K. El-Essi, Ischaemic stroke management at Al-Shifa Hospital in the Gaza Strip: a clinical audit, Lancet, 391 (2018), S7. https://doi.org/10.1016/S0140-6736(18)30373-8 doi: 10.1016/S0140-6736(18)30373-8
|
| [41] |
Y. Shen, C. Peng, Q. Bai, Y. Ding, X. Yi, H. Du, et al., Epigenome-wide association study indicates hypomethylation of MTRNR2L8 in large-artery atherosclerosis stroke, Stroke, 50 (2019), 1330–1338. https://doi.org/10.1161/STROKEAHA.118.023436 doi: 10.1161/STROKEAHA.118.023436
|
| [42] |
R. Fujii, H. Yamada, E. Munetsuna, M. Yamazaki, G. Mizuno, Y. Tsuboi, et al., Dietary vegetable intake is inversely associated with ATP-binding cassette protein A1 (ABCA1) DNA methylation levels among Japanese women, Nutrition, 65 (2019), 1–5. https://doi.org/10.1016/j.nut.2019.02.010 doi: 10.1016/j.nut.2019.02.010
|
| [43] |
C. Soriano-Tárraga, J. Jiménez-Conde, E. Giralt-Steinhauer, M. Mola, A. Ois, A. Rodríguez-Campello, et al., Global DNA methylation of ischemic stroke subtypes, PLoS One, 9 (2014), e96543. https://doi.org/10.1371/journal.pone.0096543 doi: 10.1371/journal.pone.0096543
|
| [44] |
Z. Wu, W. Wei, H. Fan, Y. Gu, L. Li, H. Wang, Integrated analysis of competitive endogenous RNA networks in acute ischemic stroke, Front. Genet., 13 (2022), 833545. https://doi.org/10.3389/fgene.2022.833545 doi: 10.3389/fgene.2022.833545
|
| [45] |
G. X. Deng, N. Xu, Q. Huang, J. Y. Tan, Z. Zhang, X. F. Li, et al., Association between promoter DNA methylation and gene expression in the pathogenesis of ischemic stroke, Aging (Albany NY), 11 (2019), 7663–7677. https://doi.org/10.18632/aging.102278 doi: 10.18632/aging.102278
|
| [46] |
X. Liu, T. Yamashita, J. Shang, X. Shi, R. Morihara, Y. Huang, et al., Molecular switching from ubiquitin-proteasome to autophagy pathways in mice stroke model, J. Cereb. Blood Flow Metab., 40 (2020), 214–224. https://doi.org/10.1177/0271678X18810617 doi: 10.1177/0271678X18810617
|
| [47] |
L. Chen, M. He, M. Zhang, Q. Sun, S. Zeng, H. Zhao, et al., The Role of noncoding RNAs in colorectal cancer, with a focus on its autophagy, Pharmacol. Ther., 226 (2021), 107868. https://doi.org/10.1016/j.pharmthera.2021.107868 doi: 10.1016/j.pharmthera.2021.107868
|
| [48] |
H. Ren, Q. Wang, Noncoding RNA and diabetic kidney disease, DNA Cell Biol., 40 (2021), 553–567. https://doi.org/10.1089/dna.2020.5973 doi: 10.1089/dna.2020.5973
|
| [49] |
Z. Zhang, F. Cui, C. Cao, Q. Wang, Q. Zou, Single-cell RNA analysis reveals the potential risk of organ-specific cell types vulnerable to SARS-CoV-2 infections, Comput. Biol. Med., 140 (2021), 105092. https://doi.org/10.1016/j.compbiomed.2021.105092 doi: 10.1016/j.compbiomed.2021.105092
|
| [50] |
G. C. Jickling, B. P. Ander, X. H. Zhan, D. Noblett, B. Stamova, D. Z. Liu, microRNA expression in peripheral blood cells following acute ischemic stroke and their predicted gene targets, PloS One, 9 (2014), 51. https://doi.org/10.1371/journal.pone.0099283 doi: 10.1371/journal.pone.0099283
|
| [51] |
A. R. Sharma, U. Shashikiran, A. R. Uk, R. Shetty, K. Satyamoorthy, P. S. Rai, Aberrant DNA methylation and miRNAs in coronary artery diseases and stroke: a systematic review, Brief. Funct. Genomics, 19 (2020), 259–285. https://doi.org/10.1093/bfgp/elz043 doi: 10.1093/bfgp/elz043
|


Figures(8) / Tables(10)

Ming-Xi Zhu, Tian-Yang Zhao, Yan Li. Insight into the mechanism of DNA methylation and miRNA-mRNA regulatory network in ischemic stroke[J]. Mathematical Biosciences and Engineering, 2023, 20(6): 10264-10283. doi: 10.3934/mbe.2023450


 DownLoad: