
Motivation is a key factor for success in education and modern working life. Cross-cultural environment is a challenge to it and, if not taken into account, it can impair learning outcome and lead to high turnover rates in companies. We performed an ethnographic study in two Chinese companies expanded to Europe and observed what problems the organizations faced. Our finding is that main problems originate from cultural differences between Chinese and Western organizations, and that they are mostly explained by the different power distance in the two cultures. The host company has a steep hierarchy of the organization, and it did not delegate the decision making to the locals. This led to frustration, loss of motivation, and high turnover rate.
Citation: Shuo Wang, Pasi Fränti. How power distance affect motivation in cross-cultural environment: Findings from Chinese companies in Europe[J]. STEM Education, 2022, 2(2): 96-120. doi: 10.3934/steme.2022008
[1] | Akbar Ali, Ivan Gutman, Boris Furtula, Abeer M. Albalahi, Amjad E. Hamza . On chemical and mathematical characteristics of generalized degree–based molecular descriptors. AIMS Mathematics, 2025, 10(3): 6788-6804. doi: 10.3934/math.2025311 |
[2] | Chenxu Yang, Meng Ji, Kinkar Chandra Das, Yaping Mao . Extreme graphs on the Sombor indices. AIMS Mathematics, 2022, 7(10): 19126-19146. doi: 10.3934/math.20221050 |
[3] | Ali Al Khabyah . Mathematical aspects and topological properties of two chemical networks. AIMS Mathematics, 2023, 8(2): 4666-4681. doi: 10.3934/math.2023230 |
[4] | Jorge Batanero, Edil D. Molina, José M. Rodríguez . On h-integral Sombor indices. AIMS Mathematics, 2025, 10(5): 12421-12446. doi: 10.3934/math.2025561 |
[5] | Fei Yu, Hifza Iqbal, Saira Munir, Jia Bao Liu . M-polynomial and topological indices of some transformed networks. AIMS Mathematics, 2021, 6(12): 13887-13906. doi: 10.3934/math.2021804 |
[6] | Sumaira Hafeez, Rashid Farooq . On generalized inverse sum indeg index and energy of graphs. AIMS Mathematics, 2020, 5(3): 2388-2411. doi: 10.3934/math.2020158 |
[7] | Kun Wang, Wenjie Ning, Yuheng Song . Extremal values of the modified Sombor index in trees. AIMS Mathematics, 2025, 10(5): 12092-12103. doi: 10.3934/math.2025548 |
[8] | Jianwei Du, Xiaoling Sun . On the graph connectivity and the variable sum exdeg index. AIMS Mathematics, 2021, 6(1): 607-622. doi: 10.3934/math.2021037 |
[9] | Ali N. A. Koam, Ali Ahmad, Azeem Haider, Moin A. Ansari . Computation of eccentric topological indices of zero-divisor graphs based on their edges. AIMS Mathematics, 2022, 7(7): 11509-11518. doi: 10.3934/math.2022641 |
[10] | Zeeshan Saleem Mufti, Ali Tabraiz, Qin Xin, Bander Almutairi, Rukhshanda Anjum . Fuzzy topological analysis of pizza graph. AIMS Mathematics, 2023, 8(6): 12841-12856. doi: 10.3934/math.2023647 |
Motivation is a key factor for success in education and modern working life. Cross-cultural environment is a challenge to it and, if not taken into account, it can impair learning outcome and lead to high turnover rates in companies. We performed an ethnographic study in two Chinese companies expanded to Europe and observed what problems the organizations faced. Our finding is that main problems originate from cultural differences between Chinese and Western organizations, and that they are mostly explained by the different power distance in the two cultures. The host company has a steep hierarchy of the organization, and it did not delegate the decision making to the locals. This led to frustration, loss of motivation, and high turnover rate.
A topological index is a single number, representing a chemical structure in graph-theoretical terms, which correlates with a molecular property. The concept of topological indices began with the work of Harold Wiener in the 1940s [42], particularly in relation to chemical graph theory. His Wiener index, which quantifies the branching of a molecular structure by counting the sum of distances between all pairs of vertices in a graph, laid the groundwork for subsequent research.
Since then, numerous topological indices have been developed, each capturing different aspects of molecular structure and properties. Examples include the Zagreb indices and the Randić index, among many others. These indices are used to correlate structural features with various chemical properties, aiding in the prediction of physical and chemical behaviors of compounds. For additional approaches related to topological indices and their applications, see [1,3,28].
The first and second Zagreb indices, which we denote M1 and M2, respectively, are defined (see [18]) by
M1(G)=∑u∈V(G)d2u,M2(G)=∑uv∈E(G)dudv, |
where V(G) and E(G) denote the set of vertices and edges of the graph G, respectively, and dx denotes the degree (the number of neighbors) of the vertex x.
In [5,23,27] the general first and second Zagreb indices are introduced as
Mα1(G)=∑u∈V(G)dαu,Mα2(G)=∑uv∈E(G)(dudv)α, |
respectively.
Note that Mα1 generalizes the first Zagreb index M1, the inverse index ID(G) [12], the forgotten index F(G), etc.; also, Mα2 generalizes the Randić index, the second Zagreb index M2, the modified Zagreb index [29], etc.
The concept of variable topological indices offers a flexible approach to characterizing molecular structures, especially when it comes to heteroatoms and the structural differences between acyclic and cyclic components in molecules like alkylcycloalkanes (see [32,33,34]). By allowing the variables to be optimized during regression analysis, the method aims to minimize the standard error of the estimate for a given property. This adaptability can lead to more accurate and reliable models for predicting molecular behavior and properties, making it a valuable tool in cheminformatics and molecular modeling.
The sum-connectivity index was introduced in [43]. It has been shown that it correlates well with the π-electronic energy of benzenoid hydrocarbons [24]. In [25] appear more applications of this index. This index was extended to the general sum-connectivity index in the paper [44], which is defined as
χa(G)=∑uv∈E(G)(du+dv)a. |
Notice that χ1 is the first Zagreb index, χ−1 is half the harmonic index, and χ−1/2 is the sum-connectivity index.
There are relationships between all these indices (see e.g. [13,14]).
If α,β are arbitrary real numbers, the Gutman-Milovanović index is defined in [16] by
Mα,β(G)=∑uv∈E(G)(dudv)α(du+dv)β. |
This index is a natural generalization of the first Zagreb, the general second Zagreb, and the general sum-connectivity indices.
Notice that M0,1 is the first Zagreb index M1, M1,0 is the second Zagreb index M2, M−1/2,0 is the Randić index R, 2M1/2,−1 is the geometric-arithmetic index GA, 12M−1/2,1 is the arithmetic-geometric index AG, M0,−1/2 is the sum-connectivity index χ, 2M0,−1 is the harmonic index H, Mα,0 is the general second Zagreb index Mα2, M0,β is the general sum-connectivity index χβ, and 4M1,−2 is the harmonic-arithmetic index HA [2], etc. In all these examples we have α≠β, but we can also obtain known indices when α=β: the third redefined Zagreb index (also called the second Gourava index) if α=β=1 (see [20]), the second hyper-Gourava index if α=β=2 (see [19]), and the Gourava product-connectivity index if α=β=1/2 (see [21]).
Note that the definition of Mα,β in [16] is slightly different, but it is equivalent to this one.
The purpose of this paper is to provide new inequalities for the Gutman-Milovanović index. Moreover, the characterization of extremal graphs with respect to many of these inequalities is obtained (by extremal graphs, we mean graphs for which the inequality is, in fact, an equality). Also, some applications are given to the study of the physicochemical properties of polycyclic aromatic hydrocarbons (PAHs). The physicochemical properties of these compounds studied are boiling point, entropy, acentric factor, octanol-water partition coefficient, Kovats retention index and enthalpy of formation.
One of the novelties of studying this index for all parameter values is that it allows obtaining results for many of the known indices in a unified way. On the other hand, this characteristic also introduces the main technical difficulty, since it is necessary to search for arguments that work for all parameter values.
Given positive integers δ≤Δ and a∈R, let us define the constants ca=ca(δ,Δ) and Ca=Ca(δ,Δ) as follows:
If a≥0, then
ca=2δ2a+1,Ca=2Δ2a+1. |
If a≤−1, then
ca=2Δ2a+1,Ca=2δ2a+1. |
If a=−1/2, then
c−1/2=2,C−1/2=Δ+δ√Δδ. |
If −1/2<a<0 and (a+1)δ+aΔ≥0, then
ca=2δ2a+1,Ca=2Δ2a+1. |
If −1/2<a<0 and (a+1)δ+aΔ<0, then
ca=min{2δ2a+1,|a|a(a+1)a+1Δ2a+1},Ca=max{(Δ+δ)(Δδ)a,2Δ2a+1}. |
If −1<a<−1/2 and (a+1)Δ+aδ≤0, then
ca=2Δ2a+1,Ca=2δ2a+1. |
If −1<a<−1/2 and (a+1)Δ+aδ>0, then
ca=min{2Δ2a+1,|a|a(a+1)a+1δ2a+1},Ca=max{(Δ+δ)(Δδ)a,2δ2a+1}. |
Recall that a biregular graph is a bipartite graph for which any vertex in one side of the given bipartition has degree Δ and any vertex in the other side of the bipartition has degree δ. We say that a graph is (Δ,δ)-biregular if we want to write explicitly the maximum and minimum degrees.
Proposition 2.1. Let G be a graph with m edges, minimum degree δ, and maximum degree Δ, and a∈R. Then,
cam≤Ma,1(G)≤Cam. |
If ca (respectively, Ca) is equal to 2δ2a+1 or 2Δ2a+1, then we have Ma,1(G)=cam (respectively, Ma,1(G)=Cam) for every regular graph G.
If ca (respectively, Ca) is equal to (Δδ)a(Δ+δ), then we have Ma,1(G)=cam (respectively, Ma,1(G)=Cam) for every biregular graph G.
Proof. We are going to compute the extremal values of the next function Λ:[δ,Δ]×[δ,Δ]→R of class C∞ given by
Λ(x,y)=(x+y)(xy)a=xa+1ya+xaya+1. |
We will prove that ca≤Λ(x,y)≤Ca for every δ≤x,y≤Δ, then ca≤(du+dv)(dudv)a≤Ca for every edge uv∈E(G), and so, cam≤Ma,1(G)≤Cam.
Since ca and Ca have different expressions depending on the values of a, it will be necessary to consider several cases in the proof depending on the values of a.
The partial derivatives of Λ are
∂Λ∂x(x,y)=(a+1)xaya+axa−1ya+1=xa−1ya((a+1)x+ay),∂Λ∂y(x,y)=ya−1xa((a+1)y+ax). |
If a≥0, then ∂Λ/∂x,∂Λ/∂y>0 and so,
2δ2a+1=Λ(δ,δ)≤Λ(x,y)≤Λ(Δ,Δ)=2Δ2a+1,ca≤(du+dv)(dudv)a≤Ca,cam≤Ma,1(G)≤Cam. |
If a≤−1, then ∂Λ/∂x,∂Λ/∂y<0 and so,
2Δ2a+1=Λ(Δ,Δ)≤Λ(x,y)≤Λ(δ,δ)=2δ2a+1,ca≤(du+dv)(dudv)a≤Ca,cam≤Ma,1(G)≤Cam. |
If a=−1/2, then
Λ(x,y)=x+y√xy, |
and it is well known that
c−1/2=2≤x+y√xy≤Δ+δ√Δδ=C−1/2,c−1/2≤(du+dv)(dudv)−1/2≤C−1/2,c−1/2m≤M−1/2,1(G)≤C−1/2m. |
We just need to consider the cases −1/2<a<0 and −1<a<−1/2.
(A) Assume first −1/2<a<0. By symmetry, it suffices to study the function Λ on the set A={(x,y)∈[δ,Δ]×[δ,Δ]:x≥y}. If (x0,y0) is a critical point of Λ, then ∇Λ(x0,y0)=0 and
(a+1)x0+ay0=0,(a+1)y0+ax0=0. |
Thus, we have (x0,y0)=(0,0)∉A. Since there are no critical points of Λ in A, the extremal values of Λ are attained on the boundary ∂A.
On the set {δ≤x=y≤Δ}⊂∂A one gets Λ(x,x)=2x2a+1. Since 2a+1>0, we have 2δ2a+1≤Λ(x,x)≤2Δ2a+1.
In order to deal with [δ,Δ]×{δ}⊂∂A, let us consider the function γ(x)=Λ(x,δ). Thus, γ′(x)=xa−1δa((a+1)x+aδ). Since a+1>−a, we have
γ′(x)>xa−1δa(−ax+aδ)=−axa−1δa(x−δ)≥0. |
Therefore,
2δ2a+1=γ(δ)≤γ(x)=Λ(x,δ)≤γ(Δ)=(Δ+δ)(Δδ)a. |
In order to deal with {Δ}×[δ,Δ]⊂∂A, let us consider the function σ(y)=Λ(Δ,y). Thus, σ′(y)=ya−1Δa((a+1)y+aΔ)=0 if and only if
y=−aa+1Δ. |
Note that −1/2<a<0 implies a+1>−a, and so,
0<−aa+1<1,−aa+1Δ<Δ. |
(A.1) If (a+1)δ+aΔ≥0, then −aΔ/(a+1)≤δ, and so,
0≤ya−1Δa((a+1)δ+aΔ)<ya−1Δa((a+1)y+aΔ)=σ′(y), |
if y∈(δ,Δ]. Hence,
(Δ+δ)(Δδ)a=σ(δ)≤σ(y)=Λ(Δ,y)≤σ(Δ)=2Δ2a+1. |
Consequently,
2δ2a+1≤Λ(x,y)≤2Δ2a+1,ca≤(du+dv)(dudv)a≤Ca,cam≤Ma,1(G)≤Cam. |
(A.2) If (a+1)δ+aΔ<0, then δ<−aΔ/(a+1)<Δ. Since 2a+1>0,
σ′(δ)=δa−1Δa((a+1)δ+aΔ)<0,σ′(Δ)=Δ2a(2a+1)>0. |
Since σ′ has a single zero, we have
σ(−aa+1Δ)≤σ(y)=Λ(Δ,y)≤max{σ(δ),σ(Δ)},|a|a(a+1)a+1Δ2a+1≤σ(y)≤max{(Δ+δ)(Δδ)a,2Δ2a+1}. |
Consequently,
min{2δ2a+1,|a|a(a+1)a+1Δ2a+1}≤Λ(x,y)≤max{(Δ+δ)(Δδ)a,2Δ2a+1},ca≤(du+dv)(dudv)a≤Ca,cam≤Ma,1(G)≤Cam. |
(B) Assume now −1<a<−1/2. By symmetry, it suffices to study the function Λ on the set B={(x,y)∈[δ,Δ]×[δ,Δ]:y≥x}. As in the previous case, the extremal values of Λ are attained on the boundary ∂B.
On the set {δ≤x=y≤Δ}⊂∂B one gets Λ(x,x)=2x2a+1. Since 2a+1<0, we have 2Δ2a+1≤Λ(x,x)≤2δ2a+1.
In order to deal with [δ,Δ]×{Δ}⊂∂B, let us consider the function η(x)=Λ(x,Δ). Thus, η′(x)=xa−1Δa((a+1)x+aΔ). Since a+1<−a, we have
η′(x)<xa−1Δa(−ax+aΔ)=axa−1Δa(Δ−x)≤0. |
Therefore,
2Δ2a+1=η(Δ)≤η(x)=Λ(x,Δ)≤η(δ)=(Δ+δ)(Δδ)a. |
In order to deal with {δ}×[δ,Δ]⊂∂B, let us consider the function μ(y)=Λ(δ,y). Thus, μ′(y)=ya−1δa((a+1)y+aδ)=0 if and only if
y=−aa+1δ. |
Note that −1<a<−1/2 implies a+1<−a, and so,
−aa+1>1,−aa+1δ>δ. |
(B.1) If (a+1)Δ+aδ≤0, then −aδ/(a+1)≥Δ, and so,
0≥ya−1δa((a+1)Δ+aδ)>ya−1δa((a+1)y+aδ)=μ′(y), |
if y∈[δ,Δ). Hence,
(Δ+δ)(Δδ)a=μ(Δ)≤μ(y)=Λ(δ,y)≤μ(δ)=2δ2a+1. |
Consequently,
2Δ2a+1≤Λ(x,y)≤2δ2a+1,ca≤(du+dv)(dudv)a≤Ca,cam≤Ma,1(G)≤Cam. |
(B.2) If (a+1)Δ+aδ>0, then δ<−aδ/(a+1)<Δ. Since 2a+1<0,
μ′(δ)=δ2a(2a+1)<0,μ′(Δ)=Δa−1δa((a+1)Δ+aδ)>0. |
Hence,
μ(−aa+1δ)≤μ(y)=Λ(δ,y)≤max{μ(δ),μ(Δ)},|a|a(a+1)a+1δ2a+1≤μ(y)≤max{2δ2a+1,(Δ+δ)(Δδ)a}. |
Consequently,
min{2Δ2a+1,|a|a(a+1)a+1δ2a+1}≤Λ(x,y)≤max{(Δ+δ)(Δδ)a,2δ2a+1},ca≤(du+dv)(dudv)a≤Ca,cam≤Ma,1(G)≤Cam. |
If G is a regular graph, then Ma,1(G)=2δ2a+1=2Δ2a+1. Consequently, if ca (respectively, Ca) is equal to 2δ2a+1 or 2Δ2a+1, then we have Ma,1(G)=cam (respectively, Ma,1(G)=Cam) for every regular graph G.
If G is a biregular graph, then Ma,1(G)=(Δ+δ)(Δδ)a. Consequently, if ca (respectively, Ca) is equal to (Δ+δ)(Δδ)a, then we have Ma,1(G)=cam (respectively, Ma,1(G)=Cam) for every biregular graph G.
Remark 2.2. It is natural to wonder about equality in inequalities in Proposition 2.1 when the values of the constants are not equal to 2δ2a+1, 2Δ2a+1, or (Δδ)a(Δ+δ). Although these inequalities are very good in these cases as well, equality is not achieved for any graph at almost every value of the parameter a∈R, as the following example shows:
Assume for instance (the other cases are similar) that −1/2<a<0, (a+1)δ+aΔ<0, as in Case (A.2), and
|a|a(a+1)a+1Δ2a+1<2δ2a+1. |
Hence,
ca=|a|a(a+1)a+1Δ2a+1. |
The argument in the proof of Proposition 2.1 provides that
ca=|a|a(a+1)a+1Δ2a+1=Λ(Δ,−aa+1Δ). |
And so, the equality Ma,1(G)=cam is attained if and only if every edge in E(G) has vertices with degrees Δ and −aa+1Δ. This can happen just if k=−aa+1Δ is a positive integer, and then
kΔ=−aa+1⇒ka+k=−aΔ⇒a=−kk+Δ∈Q. |
Hence, for almost every value of a (when a∈R∖Q), there is no graph attaining the equality Ma,1(G)=cam.
Corollary 2.3. Given a∈R and integers 1≤δ≤Δ, we have ca≤Ca, and ca=Ca if and only if δ=Δ.
Proof. Let J=[δ,Δ]×[δ,Δ] and let Λ:J→R be the function defined as
Λ(x,y)=(x+y)(xy)a. |
Then the argument in the proof of Proposition 2.1 gives that
ca=min(x,y)∈JΛ(x,y),Ca=max(x,y)∈JΛ(x,y). |
The statement follows since Λ is not constant if δ<Δ.
Given positive integers δ≤Δ and α,β∈R, let us define the constants cα,β=cα,β(δ,Δ) and Cα,β=Cα,β(δ,Δ) as follows:
If β>0, then
cα,β=cβα/β,Cα,β=Cβα/β. |
If β<0, then
cα,β=Cβα/β,Cα,β=cβα/β. |
If β=0 and α≥0, then
cα,0=δ2α,Cα,0=Δ2α. |
If β=0 and α<0, then
cα,0=Δ2α,Cα,0=δ2α. |
Theorem 2.4. Let G be a graph with m edges, minimum degree δ, and maximum degree Δ, and α,β∈R. Then,
cα,βm≤Mα,β(G)≤Cα,βm. |
If cα,β (respectively, Cα,β) is equal to 2βδ2α+β or 2βΔ2α+β, then we have Mα,β(G)=cα,βm (respectively, Mα,β(G)=Cα,βm) for every regular graph G.
If cα,β (respectively, Cα,β) is equal to (Δδ)α(Δ+δ)β, then we have Mα,β(G)=cα,βm (respectively, Mα,β(G)=Cα,βm) for every biregular graph G.
Proof. The argument in the proof of Proposition 2.1 implies that
ca≤(xy)a(x+y)≤Ca |
for every a∈R and δ≤x,y≤Δ. Hence, if β≠0 and we take a=α/β, we have
cα/β≤(xy)α/β(x+y)≤Cα/β |
for every δ≤x,y≤Δ.
If β>0, then
cβα/β≤(xy)α(x+y)β≤Cβα/β |
for every δ≤x,y≤Δ.
If β<0, then
Cβα/β≤(xy)α(x+y)β≤cβα/β |
for every δ≤x,y≤Δ.
If β=0 and α≥0, then
δ2α≤(xy)α(x+y)0≤Δ2α |
for every δ≤x,y≤Δ.
If β=0 and α<0, then
Δ2α≤(xy)α(x+y)0≤δ2α |
for every δ≤x,y≤Δ.
Therefore, we have for every α,β∈R,
cα,β≤(dudv)α(du+dv)β≤Cα,β |
for every uv∈E(G), and so,
cα,βm≤Mα,β(G)≤Cα,βm. |
The statements on the equalities follow from the argument in the proof of Proposition 2.1.
The argument in the proof of Corollary 2.3 has the following consequence.
Corollary 2.5. Given α,β∈R and integers 1≤δ≤Δ, we have cα,β≤Cα,β; also, cα,β=Cα,β if and only if δ=Δ.
The following inequality relating two Mα,β indices is direct.
Proposition 2.6. Let G be a graph and α,β,α′,β′∈R with α≤α′ and β≤β′. Then,
Mα,β(G)≤Mα′,β′(G). |
Theorem 2.4 allows us to prove the following inequality relating two Mα,β indices.
Theorem 2.7. Let G be a graph with minimum degree δ, and maximum degree Δ, and α,β,α′,β′∈R. Then,
cα−α′,β−β′Mα′,β′(G)≤Mα,β(G)≤Cα−α′,β−β′Mα′,β′(G). |
Proof. The argument in the proof of Theorem 2.4 implies that
cα−α′,β−β′≤(dudv)α−α′(du+dv)β−β′≤Cα−α′,β−β′ |
for every uv∈E(G), and so,
cα−α′,β−β′(dudv)α′(du+dv)β′≤(dudv)α(du+dv)β≤Cα−α′,β−β′(dudv)α′(du+dv)β′cα−α′,β−β′Mα′,β′(G)≤Mα,β(G)≤Cα−α′,β−β′Mα′,β′(G). |
Recall that M−1/22 is the Randić index R, χ−1/2 is the sum-connectivity index S, and 2χ−1 is the harmonic index H. Thus, Theorem 2.7 has the following consequence.
Corollary 2.8. Let G be a graph with minimum degree δ, maximum degree Δ, and α,β,α′,β′∈R. Then,
cα−α′,βMα′2(G)≤Mα,β(G)≤Cα−α′,βMα′2(G),cα,β−β′χβ′(G)≤Mα,β(G)≤Cα,β−β′χβ′(G),cα−1,βM2(G)≤Mα,β(G)≤Cα−1,βM2(G),cα+1/2,βR(G)≤Mα,β(G)≤Cα+1/2,βR(G),cα,β−1M1(G)≤Mα,β(G)≤Cα,β−1M1(G),cα,β+1/2S(G)≤Mα,β(G)≤Cα,β+1/2S(G),12cα,β+1H(G)≤Mα,β(G)≤12Cα,β+1H(G). |
The geometric-arithmetic and the arithmetic-geometric indices are defined, respectively, as
GA(G)=∑uv∈E(G)2√dudvdu+dv,AG(G)=∑uv∈E(G)du+dv2√dudv. |
The geometric-arithmetic index is a good predictor of the heat of formation of benzenoid hydrocarbons, and it has been extensively studied (see, e.g., [6,7,8,9,35,36]).
In [4,10] (see also [37]), the variable geometric-arithmetic index was defined by
GAa(G)=∑uv∈E(G)(2√dudvdu+dv)a=2aMa/2,−a(G). |
Theorem 2.7 also has the following consequence.
Corollary 2.9. Let G be a graph with minimum degree δ, maximum degree Δ, and α,β,a∈R. Then,
2−acα−a/2,β+aGAa(G)≤Mα,β(G)≤2−aCα−a/2,β+aGAa(G). |
Corollary 2.9 has the following consequence for the geometric-arithmetic and the arithmetic-geometric indices.
Corollary 2.10. Let G be a graph with minimum degree δ, maximum degree Δ, and α,β∈R. Then,
12cα−1/2,β+1GA(G)≤Mα,β(G)≤12Cα−1/2,β+1GA(G),2cα+1/2,β−1AG(G)≤Mα,β(G)≤2Cα+1/2,β−1AG(G). |
In [40,41], a family of Adriatic indices is introduced. An especially interesting subclass of these descriptors consists of 148 discrete Adriatic indices. Most of the indices showed good predictive properties on the testing sets provided by the International Academy of Mathematical Chemistry. Twenty of them were selected as good predictors. The inverse sum indeg index, ISI, is an Adriatic index that was selected in [41] as a significant predictor of the total surface area of octane isomers. This index was defined by
ISI(G)=∑uv∈E(G)dudvdu+dv=∑uv∈E(G)11du+1dv=M1,−1(G). |
In the last years there has been an increasing interest in this index (see, e.g., [11,15,17,30]).
Theorem 2.7 provides inequalities relating the inverse sum indeg and the Gutman-Milovanović indices.
Corollary 2.11. Let G be a graph with minimum degree δ, maximum degree Δ, and α,β∈R. Then,
cα−1,β+1ISI(G)≤Mα,β(G)≤Cα−1,β+1ISI(G). |
The following result is a useful and well-known inequality (see, e.g., [26, Lemma 3.4] for a proof of the statement of equality).
Lemma 3.1. If ai,bi≥0 and Mbi≤ai≤Nbi for 1≤i≤k and some positive constants M,N, then
(k∑i=1a2i)1/2(k∑i=1b2i)1/2≤12(√NM+√MN)k∑i=1aibi. |
If ai>0 for some 1≤i≤k, then the equality holds if and only if M=N and ai=Mbi=Nbi for every 1≤i≤k.
Lemma 3.1 allows us to obtain the following result relating Mα,β, the general second Zagreb index and the general sum-connectivity index.
Theorem 3.2. Let G be a graph with minimum degree δ, maximum degree Δ, and α,β∈R. Then,
Mα,β(G)2≥4Cα,−βcα,−β+cα,−βCα,−β+2M2α2(G)χ2β(G), |
where cα,−β,Cα,−β are the constants in Theorem 2.4. The equality in the bound is attained if and only if G is regular.
Proof. The argument in the proof of Theorem 2.4 gives
cα,β≤(dudv)α(du+dv)β≤Cα,β |
for every α,β∈R and uv∈E(G) and so, we have
cα,−β≤(dudv)α(du+dv)β≤Cα,−β |
for every α,β∈R and uv∈E(G). Hence, by applying Lemma 3.1, we obtain
(∑uv∈E(G)(dudv)2α)(∑uv∈E(G)(du+dv)2β)≤14(√Cα,−βcα,−β+√cα,−βCα,−β)2(∑uv∈E(G)(dudv)α(du+dv)β)2,M2α2(G)χ2β(G)≤14(Cα,−βcα,−β+cα,−βCα,−β+2)Mα,β(G)2. |
By Lemma 3.1, the equality in this bound is attained if and only if Cα,−β=cα,−β; Corollary 2.5 gives that this happens if and only if δ=Δ, i.e., G is regular.
The following results relate to the Gutman-Milovanović, the general second Zagreb and the general sum-connectivity indices.
Theorem 3.3. Let G be a graph and p,α,β∈R with p>1. Then,
Mα,β(G)≤1pMpα2(G)+p−1pχpβ/(p−1)(G). |
Proof. By applying Young's inequality, we obtain
∑uv∈E(G)(dudv)α(du+dv)β≤1p∑uv∈E(G)(dudv)pα+p−1p∑uv∈E(G)(du+dv)pβ/(p−1),Mα,β(G)≤1pMpα2(G)+p−1pχpβ/(p−1)(G). |
Young's inequality is a very important result in analysis, since it is a key tool in the proof of Hölder's inequality. Its reverse inequality was given in [39] with Specht's ratio as follows:
S(xpyq)xy≥1pxp+1qyq, | (3.1) |
where the Specht's ratio [38] is defined on R+ as
S(a)=a1a−1eloga1a−1. |
In [31] appears the following version of (3.1) for n real numbers, improving Specht's ratio.
Theorem 3.4. If 0<a<1, p1,…,pn>1, and x1,…,xn≥0 are real numbers such that 1p1+⋯+1pn=1 and axpkk≤xpii for 1≤i,k≤n, then there exists a positive constant A, which just depends on a,p1,…,pn, such that
1p1xp11+⋯+1pnxpnn≤Ax1⋯xn. | (3.2) |
In fact, if Pn denotes the group of permutations of {1,…,n}, then the best value of A is the maximum on the following finite set:
A=max1≤m<n,σ∈Pn(a+(1−a)m∑k=11pσ(k))a−1+m∑k=11/pσ(k)≤a1a−1eloga1a−1=S(a). |
Corollary 3.5. If 0<a<1, p,q>1 and x,y≥0 are real numbers such that 1p+1q=1 and axp≤yq, ayq≤xp, then
1pxp+1qyq≤Axy, | (3.3) |
with
A=max{(a+(1−a)1p)a−1/q,(a+(1−a)1q)a−1/p}≤S(a). |
Theorem 3.6. Let G be a graph and p,α,β∈R with p>1. Then,
Aα,β,pMα,β(G)≥1pMpα2(G)+p−1pχpβ/(p−1)(G), |
where
aα,β,p:=min{cpα,−pβ/(p−1),c−pα,pβ/(p−1)},Aα,β,p:=max{paα,β,p+1−aα,β,ppa(1−p)/pα,β,p,aα,β,p+p−1pa−1/pα,β,p}≤S(aα,β,p). |
Proof. The argument in the proof of Theorem 2.4 gives
cpα,−pβ/(p−1)≤(dudv)pα(du+dv)pβ/(p−1),c−pα,pβ/(p−1)≤(du+dv)pβ/(p−1)(dudv)pα, |
for every uv∈E(G).
In order to apply Corollary 3.5, note that
A=max{(a+(1−a)1p)a−1/q,(a+(1−a)1q)a−1/p}=max{pa+1−apa(1−p)/p,a+p−1pa−1/p}≤S(a). |
Taking into account the definitions of aα,β,p and Aα,β,p, Corollary 3.5 implies
Aα,β,p∑uv∈E(G)(dudv)α(du+dv)β≥1p∑uv∈E(G)(dudv)pα+p−1p∑uv∈E(G)(du+dv)pβ/(p−1),Aα,β,pMα,β(G)≥1pMpα2(G)+p−1pχpβ/(p−1)(G). |
In this section, we assess the predictive power of the topological index Mα,β in modeling the boiling point (BP), entropy (S), acentric factor (ω), octanol-water partition coefficient (logP), Kovats retention index (RI), and enthalpy of formation (ΔHf) of 22 polycyclic aromatic hydrocarbons. The experimental data for these physicochemical properties were obtained from [22].
We first calculated the coefficient of determination (R2) for each property between the experimental data and Mα,β. The parameters α and β were varied systematically over a grid ranging from −20 to 20 with a step size of 0.1. Figure 1 shows grayscale maps of the R2 values obtained from the variation of α and β, where darker regions indicate higher R2 values. Subsequently, the optimal values of α and β that maximize R2 in each case were identified; these are represented as red points in the same figure. The selection of the optimal combination is based on the pair of α and β that yields the maximum R2 within the explored grid, ensuring the best linear relationship between Mα,β and the property. This systematic grid search guarantees comprehensive coverage of the parameter space, and the chosen step size balances computational feasibility with precision.
Property P | α | β | c1 | c2 | R2 | SE | F | SF |
BP | −0.6 | 1.2 | 11.072 | −28.642 | 0.9923 | 8.913 | 2565.3 | 1.36×10⁻²² |
S | 6.9 | −13.4 | 26259 | 53.611 | 0.9406 | 3.08 | 316.6 | 9.9×10⁻¹⁴ |
ω | 5.8 | −10.6 | 12.3447 | 0.169 | 0.9827 | 0.0095 | 511.3 | 3.1×10⁻⁹ |
logP | −0.1 | 0.3 | 0.2201 | 0.344 | 0.97853 | 0.172 | 911.4 | 3.7×10⁻¹⁸ |
RI | 2.1 | −0.6 | 10.8178 | −54.59 | 0.9983 | 4.12 | 11448 | 4.6×10⁻²⁹ |
ΔHf | 2.3 | −4.5 | 282.563 | 37.322 | 0.946 | 12.22 | 351.7 | 3.7×10⁻¹⁴ |
Once the optimal values of α and β are obtained, linear models of the form
P=c1Mα,β+c2, |
are constructed, where P represents the physicochemical property, and the coefficients c1 and c2 are determined using the linear regression method. After determining the linear models for each physicochemical property, the results are summarized as follows:
BP=11.072M−0.6,1.2−28.642,S=26259M6.9,−13.4+53.611,ω=12.3447M5.8,−10.6+0.169,logP=0.2201M−0.1,0.3+0.344,RI=10.8178M−0.6,1.2−54.59,ΔHf=282.563M2.3,−4.5+37.322. | (4.1) |
The performance of these linear models was evaluated, and the results are presented in Figure 2, which shows the correlation between the predicted (red line) and experimental values (blue dots) for each physicochemical property.
The analysis of the predictive power of the topological index Mα,β for modeling the physicochemical properties of polycyclic aromatic hydrocarbons reveals several key insights. The R2 values obtained for the various properties, ranging from 0.9406 for entropy to 0.9983 for the Kovats retention index, indicate a generally strong correlation between the experimental data and the predictions derived from Mα,β. This suggests that the topological index effectively captures the underlying structural variations in PAHs that influence these properties. Notably, the high R2 value for BP and RI implies that Mα,β is particularly effective in modeling these properties, likely due to the sensitivity to molecular topology. Conversely, the relatively lower R2 value for S and ΔHf indicates a more complex relationship between molecular structure and these properties, which might require additional descriptors or interactions beyond those captured by Mα,β alone.
Furthermore, the optimal parameter combinations (α,β) vary significantly across different properties, highlighting the importance of parameter tuning for each specific property. This variability underscores the flexibility of the Mα,β index in adapting to different molecular interactions. However, as shown in Figure 1, the areas where the highest R2 values are reached (darker areas) are similar across all properties. This suggests the possibility of identifying a combination of the parameters α and β that, while not optimal for each individual property, could provide a good overall fit for all the properties considered.
Building upon the insights gained in the previous analysis, we now explore the possibility of deriving a unified parameter combination (α∗,β∗) that achieves strong correlations collectively, ensuring a robust performance for all properties.
To identify (α∗,β∗), we evaluate the average of the R2 values for all properties. The (α∗,β∗) combination is determined by maximizing this average over the same parameter grid used previously (α,β∈[−20,20], with a step size of 0.1). In Figure 3 we show a greysacle map of the average values obtained from the variation of α and β across the grid.
From these calculations we obtain (α∗,β∗)=(1.4,−2.6) (red dot in Figure 3). With this combination of parameters, a linear model is proposed for each property.
BP=134.337Mα∗,β∗−15.58,S=16.246Mα∗,β∗+50.754,ω=0.09Mα∗,β∗+0.153,logP=1.547Mα∗,β∗+0.44,RI=131.26Mα∗,β∗−41.857,ΔHf=68.245Mα∗,β∗+36.883. | (4.2) |
To assess the performance of the general model, we calculate the R2 values for each property using (α∗,β∗) and compare them to the optimal R2 values obtained for property-specific parameter combinations (see Table 2).
Property P | Specific (α,β) | Generalized (α∗,β∗) | Unified Model |
BP | 0.9923 | 0.9888 | 0.9776 |
S | 0.9406 | 0.9298 | 0.828 |
ω | 0.9827 | 0.9766 | 0.8698 |
logP | 0.9785 | 0.9768 | 0.9679 |
RI | 0.9983 | 0.9948 | 0.9901 |
ΔHf | 0.9462 | 0.9445 | 0.9382 |
The results in Table 2 demonstrate that the general parameter combination (α∗,β∗)=(1.4,−2.6) provides consistently high R2 values across all physicochemical properties. While the R2(α∗,β∗) values are slightly lower than those achieved with property-specific parameter combinations, the differences are minimal (e.g., for RI, the difference is only 0.0035). This indicates that the models obtained from (α∗,β∗) capture the structural features relevant to all properties effectively, making it a robust alternative for predicting multiple properties.
Next, we aim to construct and evaluate a unified model using (α∗,β∗) to simultaneously predict all physicochemical properties. This approach will enable us to assess the practicality and effectiveness of a general model in capturing the structural factors influencing diverse properties. To ensure comparability across properties, each property is normalized to the range [0,1] using the transformation,
Pnorm=P−min(P)max(P)−min(P). |
This normalization removes scale differences and enables consistent evaluation of the generalized model. Then, the Mα∗,β∗ index is calculated for each molecule using the general parameter combination (α∗,β∗). The normalized values of all properties are then combined into a single dataset. Thus, the general model takes the form
Pnorm=0.3408Mα∗,β∗−0.5888. |
The performance of the unified model was evaluated by calculating the R2 values for each property using the normalized data and comparing them to those from the property-specific models, as summarized in Table 2. The unified model achieves lower R2 values overall, with the largest differences observed for S (0.828 vs. 0.9406) and ω (0.8698 vs. 0.9827). These results indicate that while the generalized model effectively captures overall trends, it struggles with some properties.
Finally, to place the predictive power of the topological index in context, we compare its performance against well-established indices commonly used in the modeling of physicochemical properties. The selected indices are the first Zagreb index M1, the second Zagreb index M2, the Randić index R, and the inverse degree index ID. In Table 3 we show the R2 values calculated for each property and each index.
Property | Mα,β | M1 | M2 | R | ID |
BP | 0.9923 | 0.9666 | 0.8972 | 0.9575 | 0.8794 |
S | 0.9406 | 0.887 | 0.8167 | 0.8916 | 0.7733 |
ω | 0.9827 | 0.9662 | 0.937 | 0.9444 | 0.8745 |
logP | 0.9785 | 0.9541 | 0.8851 | 0.9401 | 0.8498 |
RI | 0.9983 | 0.9729 | 0.9045 | 0.9641 | 0.8893 |
ΔHf | 0.9462 | 0.9031 | 0.8291 | 0.9198 | 0.8273 |
The results in Table 3 demonstrate that Mα,β consistently outperforms the other indices in terms of R2 values across all properties. The most pronounced differences are observed for BP and S, where Mα,β shows a clear advantage. In contrast, for ω and logP, the differences are smaller, with Mα,β performing comparably to the best alternative indices. Overall, Mα,β stands out as the most predictive and reliable index for modeling the physicochemical properties of PAHs.
In this study, we have derived novel inequalities for the Gutman-Milovanović index Mα,β, which generalizes several important topological indices. By establishing new bounds based on the minimum and maximum degrees of graphs, we have deepened the understanding of the structural properties that influence this index. Additionally, we characterized extremal graphs that achieve these bounds, providing insights into their structural configurations and illustrating the scenarios where these inequalities are tight.
Our theoretical findings have direct implications for chemical graph theory. We demonstrated the applicability of the Gutman-Milovanović index in modeling the physicochemical properties of 22 polycyclic aromatic hydrocarbons. The high coefficients of determination R2 values suggest a robust correlation between the index and experimental data, highlighting its effectiveness as a predictive tool in quantitative structure-property relationships (QSPR). The versatility of Mα,β in capturing complex molecular interactions indicates its potential for applications in chemical informatics, such as drug discovery and material science.
Future research could address the complexity of properties like entropy (S) and enthalpy of formation (ΔHf) by integrating additional molecular descriptors, such as geometric-topological parameters or vertex distance and degree-based indices. Hybrid models combining Mα,β with these descriptors or non-linear techniques like machine learning could improve the predictions and uncover hidden structural patterns. Additionally, refining the parameter optimization for α and β could further enhance the predictive accuracy of the Gutman-Milovanović index. Extending these inequalities to other classes of graphs and assessing the applicability to a broader range of chemical compounds, such as heterocyclic compounds or large organic molecules, remain promising directions for future exploration. A more detailed analysis of the limitations encountered in generalizing this approach could also inform the development of more tailored predictive models.
All the authors contributed equally to this work. All the authors have agreed and given their consent for the publication of this research paper.
The authors declare they have used Artificial Intelligence (AI) tools in the creation of this article.
Prof. Jose M. Rodriguez-Garcia is the Guest Editor of special issue "Graph theory and its applications, 2nd Edition" for AIMS Mathematics. Prof. Jose M. Rodriguez-Garcia was not involved in the editorial review and the decision to publish this article.
The authors confirm that the content of this article has no conflict of interest or competing interests.
[1] |
Hofstede, G., Culture's consequences : international differences in work-related values, Vol. 5, 1980, Beverly Hills, Calif. : SAGE. |
[2] |
Beugelsdijk, S., Maseland, R. and van Hoorn, A., Are scores on Hofstede's dimensions of national culture stable over time? A cohort analysis. Global Strategy Journal, 2015, 5(3): 223-240. https://doi.org/10.1002/gsj.1098 doi: 10.1002/gsj.1098![]() |
[3] |
Mootz, J., Dimensions of Culture (Geert H. Hofstede)–Power Distance. The Encyclopedia of Cross-Cultural Psychology, 2013, 405-407. https://doi.org/10.1002/9781118339893.wbeccp585 doi: 10.1002/9781118339893.wbeccp585![]() |
[4] |
Wang, H. and Guan, B., The positive effect of authoritarian leadership on employee performance: The moderating role of power distance. Frontiers in psychology, 2018, 9: 357. https://doi.org/10.3389/fpsyg.2018.00357 doi: 10.3389/fpsyg.2018.00357![]() |
[5] |
Dai, Y., Hao, L., Wenting X. Tianyi D., Power Distance Belief and Workplace Communication: The Mediating Role of Fear of Authority. International Journal of Environmental Research and Public Health, 2022, 19(5): 2932. https://doi.org/10.3390/ijerph19052932 doi: 10.3390/ijerph19052932![]() |
[6] |
Gu, Q., Hempel, P.S. and Mingchuan, Y., Tough love and creativity: how authoritarian leadership tempered by benevolence or morality influences employee creativity. British Journal of Management, 2020, 31(2): 305-324. https://doi.org/10.1111/1467-8551.12361 doi: 10.1111/1467-8551.12361![]() |
[7] |
Hu, X., Leung, F.K.S. and Yuan, T., The influence of culture on students' mathematics achievement across 51 countries. International Journal of Science and Mathematics Education, 2018, 16(1): 7-24. https://doi.org/10.1007/s10763-018-9899-6 doi: 10.1007/s10763-018-9899-6![]() |
[8] |
Al Hawamdeh, N. and Al Qatamin, A., The effect of cultural dimensions on knowledge-sharing intentions: Evidence from higher education institutions in Jordan. The Journal of Asian Finance, Economics and Business, 2021, 8(5): 1079-1089. |
[9] |
de Vries, H., Space for STEAM: New creativity challenge in education. Frontiers in psychology, 2021, 12: 812. https://doi.org/10.3389/fpsyg.2021.586318 doi: 10.3389/fpsyg.2021.586318![]() |
[10] |
Wenxin, Z. and Yue, W., An Analysis on Sino-UK Cultural Differences in Education from the Perspective of Hofstede's Cultural Dimensions Theory (A Case Study of Are Our Kids Tough Enough?). Journal on Education, 2022, 4(2): 373-384. https://doi.org/10.31004/joe.v4i2.438 doi: 10.31004/joe.v4i2.438![]() |
[11] |
Choi, M.S., Cook, C.M. and Brunton, M.A., Power distance and migrant nurses: The liminality of acculturation. Nursing Inquiry, 2019, 26(4): e12311. https://doi.org/10.1111/nin.12311 doi: 10.1111/nin.12311![]() |
[12] |
Hickman, L. and Mesut A., Exploring virtual reality for developing soft-skills in STEM education. 2017 7th World Engineering Education Forum (WEEF), 2017, 461-465. IEEE, 2017. https://doi.org/10.1109/WEEF.2017.8467037 |
[13] |
Fuangtharnthip, P., Jaitui, K., Pachimsawat, P., Bhattarai, B.P., Manopatanakul, S. and Kasetsuwan, J., Cultural dimensions of dental students in a Thai university. Science, Engineering and Health Studies, 2021, 21050010-21050010. |
[14] |
Cooke, F.L., Enterprise culture management in China: Insiders' perspective. Management and organization review, 2008, 4(2): 291-314. https://doi.org/10.1111/j.1740-8784.2008.00101.x doi: 10.1111/j.1740-8784.2008.00101.x![]() |
[15] |
Bian, S. and Emons, O., Chinese investments in Germany: increasing in line with Chinese industrial policy. Chinese investment in Europe: corporate strategies and labour relations, 2017, 157-177. |
[16] |
Hanemann, T. and Huotari, M., Record flows and growing imbalances: Chinese investment in Europe in 2016. MERICS papers on China, 2017, 3: 5. |
[17] |
Hammersley, M., What's wrong with ethnography?: methodological explorations, 1992, London: Routledge. |
[18] |
De Rond, M. and Lok, J., Some things can never be unseen: The role of context in psychological injury at war. Academy of Management Journal, 2016, 59(6), 1965-1993. https://doi.org/10.5465/amj.2015.0681 doi: 10.5465/amj.2015.0681![]() |
[19] |
Robben, A.C. and Sluka, J.A., Ethnographic fieldwork: An anthropological reader, 2012, John Wiley & Sons. |
[20] |
Atkinson, P., Ethnography: Principles in practice, 2007, Routledge. |
[21] |
Zhai, X., 关系与中国社会[Guanxi and Chinese society], 2012, Beijing: Chinese Social Science press. |
[22] |
Di Minin, A., Zhang, J. and Gammeltoft, P., Chinese foreign direct investment in R & D in Europe: A new model of R & D internationalization? European Management Journal, 2012, 30(3), 189-203. https://doi.org/10.1016/j.emj.2012.03.004 doi: 10.1016/j.emj.2012.03.004![]() |
[23] |
Howitt, D., Introduction to qualitative methods in psychology, 2010, Prentice Hall Harlow. |
[24] |
Dennis, H.S., (1974). A theoretical and empirical study of manageiral communication climate in complex organizations, 1974, Purdue University. |
[25] |
Markova, I. and Gillespie, A., Trust and distrust: sociocultural perspectives, 2007, Charlotte, N. C: Information Age Publishing. |
[26] |
Puusa, A. and Tolvanen, U., Organizational identity and trust. Electronic Journal of Business Ethics and Organization Studies, 2006, 11(2): 29-33. |
[27] |
Schein, E.H., Organizational culture and leadership, 1985, San Francisco, Calif. : Jossey-Bass Publishers. |
[28] |
Maslow, A.H., A theory of human motivation. Psychological review, 1943, 50(4), 370. https://doi.org/10.1037/h0054346 doi: 10.1037/h0054346![]() |
[29] |
Herzberg, F., The motivation-hygiene concept and problems of manpower. Personnel Administration, 1964, 27(1): 3-7. |
[30] |
McGregor, D., The human side of enterprise, Vol. 21, 1960, New York. |
[31] |
Huang, X., Van de Vliert, E. and Van der Vegt, G., Breaking the silence culture: Stimulation of participation and employee opinion withholding cross-nationally. Management and Organization Review, 2005, 1(3): 459-482. https://doi.org/10.1111/j.1740-8784.2005.00023.x doi: 10.1111/j.1740-8784.2005.00023.x![]() |
[32] |
Hendrix, K.G. and Moore, N. -J., Intercultural Communication in the Classroom. The International Encyclopedia of Intercultural Communication, 2017, 1-13. https://doi.org/10.1002/9781118783665.ieicc0049 doi: 10.1002/9781118783665.ieicc0049![]() |
[33] |
Gerritsen, D., Zimmerman, J. and Ogan, A., Exploring power distance, classroom activity, and the international classroom through personal informatics. Proceedings Sixth International Workshop on Culturally-Aware Tutoring Systems, 2015, 11-19. |
[34] |
Hu, J., Erdogan, B., Jiang, K., Bauer, T.N. and Liu, S., Leader humility and team creativity: The role of team information sharing, psychological safety, and power distance. Journal of Applied Psychology, 2018, 103(3): 313-323. https://doi.org/10.1037/apl0000277 doi: 10.1037/apl0000277![]() |
[35] |
Cooke, F.L., Enterprise culture management in China: Insiders' perspective. Management and organization review, 2008, 4(2): 291-314. https://doi.org/10.1111/j.1740-8784.2008.00101.x doi: 10.1111/j.1740-8784.2008.00101.x![]() |
[36] |
Aycan, Z., Paternalistic leadership, 2015, Wiley encyclopedia of management. https://doi.org/10.1002/9781118785317.weom060156 |
[37] |
Chen, C.C., Zhang, A.Y. and Wang, H., Enhancing the effects of power sharing on psychological empowerment: The roles of management control and power distance orientation. Management and Organization Review, 2014, 10(1): 135-156. https://doi.org/10.1111/more.12032 doi: 10.1111/more.12032![]() |
[38] |
Lin, W., Wang, L. and Chen, S., Abusive supervision and employee well-being: The moderating effect of power distance orientation. Applied Psychology, 2013, 62(2): 308-329. https://doi.org/10.1111/j.1464-0597.2012.00520.x doi: 10.1111/j.1464-0597.2012.00520.x![]() |
[39] |
Yuan, F. and Zhou, J., Effects of cultural power distance on group creativity and individual group member creativity. Journal of Organizational Behavior, 2015, 36(7): 990-1007. https://doi.org/10.1002/job.2022 doi: 10.1002/job.2022![]() |
[40] |
Schuder, K.L., Using followership to develop new leadership in cultures with greater power distance. Journal of Leadership Studies, 2016, 10(3): 58-61. https://doi.org/10.1002/jls.21495 doi: 10.1002/jls.21495![]() |
[41] |
Barner-Rasmussen, W. and Björkman, I., Language fluency, socialization and inter-unit relationships in Chinese and Finnish subsidiaries. Management and Organization Review, 2007, 3(1): 105-128. https://doi.org/10.1111/j.1740-8784.2007.00060.x doi: 10.1111/j.1740-8784.2007.00060.x![]() |
[42] |
Hofstede, G., Hofstede, G.J. and Minkov, M., Cultures and organizations : software of the mind : intercultural cooperation and its importance for survival (3rd ed. ), 2010, New York: McGraw-Hill. |
[43] |
Ting-toomey, S. and Kurogi, A., Facework competence in intercultural conflict: an updated face-negotiation theory. International Journal of Intercultural Relations, 1998, 22(2): 187-225. https://doi.org/10.1016/S0147-1767(98)00004-2 doi: 10.1016/S0147-1767(98)00004-2![]() |
[44] |
Anderson, C., John, O.P. and Keltner, D., The personal sense of power. Journal of personality, 2012, 80(2): 313-344. https://doi.org/10.1111/j.1467-6494.2011.00734.x doi: 10.1111/j.1467-6494.2011.00734.x![]() |
[45] |
Fast, N.J. and Chen, S., When the boss feels inadequate: power, incompetence, and aggression. Psychological science, 2009, 20(11): 1406-1413. https://doi.org/10.1111/j.1467-9280.2009.02452.x doi: 10.1111/j.1467-9280.2009.02452.x![]() |
[46] |
Bugental, D.B. and Lewis, J.C., The paradoxical misuse of power by those who see themselves as powerless: How does it happen? Journal of Social Issues, 1999, 55(1): 51-64. https://doi.org/10.1111/0022-4537.00104 doi: 10.1111/0022-4537.00104![]() |
[47] |
Keltner, D., Gruenfeld, D.H. and Anderson, C., Power, approach, and inhibition. Psychological review, 2003, 110(2): 265. https://doi.org/10.1037/0033-295X.110.2.265 doi: 10.1037/0033-295X.110.2.265![]() |
[48] |
Haidt, J. and Rodin, J., Control and efficacy as interdisciplinary bridges. Review of General Psychology, 1999, 3(4): 317-337. https://doi.org/10.1037/1089-2680.3.4.317 doi: 10.1037/1089-2680.3.4.317![]() |
[49] |
Morrison, E.W. and Milliken, F.J., Organizational silence: A barrier to change and development in a pluralistic world. Academy of Management Review, 2000, 25(4): 706-725. https://doi.org/10.5465/amr.2000.3707697 doi: 10.5465/amr.2000.3707697![]() |
[50] |
Georgesen, J. and Harris, M.J., Holding onto power: Effects of powerholders' positional instability and expectancies on interactions with subordinates. European Journal of Social Psychology, 2006, 36(4): 451-468. https://doi.org/10.1002/ejsp.352 doi: 10.1002/ejsp.352![]() |
[51] |
Ilgen, D.R., Fisher, C.D. and Taylor, M.S., Consequences of individual feedback on behavior in organizations. Journal of applied psychology, 1979, 64(4): 349. https://doi.org/10.1037/0021-9010.64.4.349 doi: 10.1037/0021-9010.64.4.349![]() |
[52] |
Argyris, C. and Schön, D.A., Organizational learning: A theory of action perspective, Vol. 173, 1978, Addison-Wesley Reading MA. |
[53] |
Zhou, J. and Liao, J., (2012). 权力距离导向与员工建言: 组织地位感知的影响[Effects of Perceived Organizational Status on the Relationship between Power Distance Orientation and Employee Voice]. Journal of Management Science, 2012, (01): 35-44. |
[54] |
Landau, J., When employee voice is met by deaf ears. Sam Advanced Management Journal, 2009, 74(1): 4. |
[55] |
Avery, D.R., McKay, P.F., Wilson, D.C., Volpone, S.D. and Killham, E.A., Does voice go flat? How tenure diminishes the impact of voice. Human resource management, 2011, 50(1): 147-158. https://doi.org/10.1002/hrm.20403 doi: 10.1002/hrm.20403![]() |
[56] |
Detert, J.R. and Edmondson, A.C., Implicit voice theories: Taken-for-granted rules of self-censorship at work. Academy of Management Journal, 2011, 54(3): 461-488. https://doi.org/10.5465/amj.2011.61967925 doi: 10.5465/amj.2011.61967925![]() |
[57] |
Paine, J.B. and Organ, D.W., The cultural matrix of organizational citizenship behavior: Some preliminary conceptual and empirical observations. Human Resource Management Review, 2000, 10(1): 45-59. https://doi.org/10.1016/S1053-4822(99)00038-8 doi: 10.1016/S1053-4822(99)00038-8![]() |
[58] |
Liao, J., Zhao, J. and Zhang, Y., 权力距离对中国领导行为的影响研究[The influence of power distance on leadership behavior in China]. Chinese Journal of Management, 2010, 7(7): 988-992. |
[59] |
Spreitzer, G.M., Psychological empowerment in the workplace: Dimensions, measurement, and validation. Academy of Management Journal, 1995, 38(5): 1442-1465. |
[60] |
Moye, M.J. and Henkin, A.B., Exploring associations between employee empowerment and interpersonal trust in managers. Journal of management development, 2006, 25(2): 101-117. https://doi.org/10.1108/02621710610645108 doi: 10.1108/02621710610645108![]() |
[61] |
Likert, R., From Production and Employee-Centeredness to Systems 1-4. Journal of management, 1979, 5(2): 147-156. https://doi.org/10.1177/014920637900500205 doi: 10.1177/014920637900500205![]() |
[62] |
Hammuda, I.M. and Dulaimi, M.F., (1997). The effects of the situational variables on the leadership styles in construction projects. Proceedings 13th Annual ARCOM Conference, 1997, 22-31. |
[63] |
Pasa, S.F., Leadership influence in a high power distance and collectivist culture. Leadership & Organization Development Journal, 2000, 21(8): 414-426. https://doi.org/10.1108/01437730010379258 doi: 10.1108/01437730010379258![]() |
[64] |
Napier, B.J. and Ferris, G.R., Distance in organizations. Human Resource Management Review, 1993, 3(4): 321-357. https://doi.org/10.1016/1053-4822(93)90004-N doi: 10.1016/1053-4822(93)90004-N![]() |
[65] |
De Souza, G. and Klein, H.J., Emergent Leadership in the Group Goal-Setting Process. Small Group Research, 1995, 26(4): 475-496. https://doi.org/10.1177/1046496495264002 doi: 10.1177/1046496495264002![]() |
[66] |
Van Dyne, L. and LePine, J.A., Helping and Voice Extra-Role Behaviors: Evidence of Construct and Predictive Validity. Academy of Management Journal, 1998, 41(1): 108-119. https://doi.org/10.5465/256902 doi: 10.5465/256902![]() |
[67] |
Hirschman, A.O., Exit, voice and loyalty : responses to decline in firms, organizations, and states (3. pr. ed. ), 1974, Cambridge, Mass: Harvard UP. |
[68] |
Borman, W.C. and Motowidlo, S.J., Task performance and contextual performance: The meaning for personnel selection research. Human Performance, 1997, 10(2): 99-109. https://doi.org/10.1207/s15327043hup1002_3 doi: 10.1207/s15327043hup1002_3![]() |
[69] |
Waldron, V.R., Hunt, M.D. and Dsilva, M., Towards a threat management model of upward communication: A study of influence and maintenance tactics in the leader-member dyad. Communication Studies, 1993, 44(3-4): 254-272. https://doi.org/10.1080/10510979309368399 doi: 10.1080/10510979309368399![]() |
[70] |
Ryan, K.D. and Oestreich, D.K., Driving fear out of the workplace: Creating the high-trust, high-performance organization, 1998, Jossey-Bass. |
[71] |
Morrison, E.W., Employee voice and silence. Annu. Rev. Organ. Psychol. Organ. Behav. , 2014, 1(1): 173-197. https://doi.org/10.1146/annurev-orgpsych-031413-091328 doi: 10.1146/annurev-orgpsych-031413-091328![]() |
[72] |
Botero, I.C. and Van Dyne, L., Employee voice behavior interactive effects of LMX and power distance in the United States and Colombia. Management Communication Quarterly, 2009, 23(1): 84-104. https://doi.org/10.1177/0893318909335415 doi: 10.1177/0893318909335415![]() |
[73] |
Pronovost, P.J. and Freischlag, J.A., Improving teamwork to reduce surgical mortality. Jama, 2010, 304(15): 1721-1722. https://doi.org/10.1001/jama.2010.1542 doi: 10.1001/jama.2010.1542![]() |
[74] |
Ma, Q., 中国政治文化论纲[The outline of Chinese political culture]. Theory Journal, 2002, (06): 29-32. |
[75] |
Duan, J. and Ling, B., 中国背景下员工建言行为结构及中庸思维对其的影响[A Chinese Indigenous Study of the Construct of Employee Voice Behavior and the Influence of Zhongyong on It]. Acta Psychologica Sinica, 2011, (10): 1185-1197. |
[76] |
Duan, J. and Huang, C., 个人权力感对进谏行为的影响机制: 权力认知的视角[The Mechanisem of Employee's Sense of Power on Speaking-up: A Power Cognition Perspective]. Acta Psychologica Sinica, 2013, (02): 217-230. |
[77] |
Dyne, L.V., Ang, S. and Botero, I.C., Conceptualizing employee silence and employee voice as multidimensional constructs. Journal of Management Studies, 2003, 40(6): 1359-1392. https://doi.org/10.1111/1467-6486.00384 doi: 10.1111/1467-6486.00384![]() |
[78] |
Tjosvold, D. and Sun, H.F., Understanding conflict avoidance: Relationship, motivations, actions, and consequences. International Journal of Conflict Management, 2002, 13(2): 142-164. https://doi.org/10.1108/eb022872 doi: 10.1108/eb022872![]() |
[79] |
Milliken, F.J., Morrison, E.W. and Hewlin, P.F., An exploratory study of employee silence: Issues that employees don't communicate upward and why. Journal of Management Studies, 2003, 40(6): 1453-1476. https://doi.org/10.1111/1467-6486.00387 doi: 10.1111/1467-6486.00387![]() |
[80] |
Vakola, M. and Bouradas, D., Antecedents and consequences of organisational silence: an empirical investigation. Employee Relations, 2005, 27(5): 441-458. https://doi.org/10.1108/01425450510611997 doi: 10.1108/01425450510611997![]() |
[81] |
Smith, P.B., Bond, M.H. and Kagitcibasi, C., Understanding social psychology across cultures : living and working in a changing world, 2006, London: Sage. https://doi.org/10.4135/9781446212028 |
[82] |
Yang, Z. -F., 如何理解中国人: 文化与个人论文集[How to Understand the Chinese: cultural and personal Engineers], 2009, Chongqing: Chongqing Univeristy Press. |
[83] |
Zhao, Z., 从中国俗谚看中国文化的个人集体取向[G], The Individual and Collective Orientation of Chinese Culture from the Perspective of Chinese Proverbs, unpublished work, 1986. |
[84] |
House, R.J., Hanges, P.J., Dorfman, P.W., Gupta, V. and Javidan, M., Culture, leadership, and organizations : the GLOBE study of 62 societies, 2004, Sage Publications. |
[85] |
Chen, X., 跨文化管理[Cross-cultural management], 2016, Beijing: Tsinghua University press. |
[86] |
Busch, R., McMahon, R., Unger, A., May, C. and Wang, Y.C., A Comparison of Leadership Styles between Chinese and German Managers of Chinese Companies in Germany. Chinese Management Review, 2013, 16(2): 1-17. |
[87] |
Farh, J. -L. and Cheng, B. -S., A cultural analysis of paternalistic leadership in Chinese organizations. Management and organizations in the Chinese context, 2000, 84-127. https://doi.org/10.1057/9780230511590_5 doi: 10.1057/9780230511590_5![]() |
[88] |
King, A.Y., An analysis of "reqing" in interpersonal relationships: A preliminary inquiry. Proceedings ofthe international Conference on Sinology. Taipei, Taiwan: Academia Sinica (in Chinese), 1980. |
[89] |
Mayer, R.C., Davis, J.H. and Schoorman, F.D., An integrative model of organizational trust. Academy of Management Review, 1995, 20(3): 709-734. https://doi.org/10.2307/258792 doi: 10.2307/258792![]() |
[90] |
Eylon, D. and Au, K.Y., Exploring empowerment cross-cultural differences along the power distance dimension. International Journal of Intercultural Relations, 1999, 23(3): 373-385. https://doi.org/10.1016/S0147-1767(99)00002-4 doi: 10.1016/S0147-1767(99)00002-4![]() |
[91] |
Pronovost, P.J. and Freischlag, J.A., Improving teamwork to reduce surgical mortality. Jama, 2010, 304(15): 1721-1722. https://doi.org/10.1001/jama.2010.1542 doi: 10.1001/jama.2010.1542![]() |
[92] |
Miles, R.E., Theories of management: implications for organizational behavior and development, 1975, Tokyo: McGraw-Hill. |
[93] |
Bhagat, R.S. and Triandis, H.C., Cultural variations in the cross-border transfer of organizastional knowledge: an integratyive framework. Academy of Management Review, 2002, 27(2): 204-221. https://doi.org/10.2307/4134352 doi: 10.2307/4134352![]() |
[94] |
Yao, S., Deng, Y. and Zheng, J., 中国背景下企业员工沉默行为的文化根源[Under the Chinese Background the Silence Behavior of Employees of Cultural Roots]. East china economic management, 2009, (06): 135-138. |
[95] |
Zhang, X., 跨文化上下级信任互动研究[A study on the interaction of trust between different cultures], 2014, (Doctor), Beijing Foreign Studies University. |
[96] |
Oyserman, D. and Markus, H.R., Self as social representation, 1998. |
[97] |
Fry, D.P., Conflict management in cross-cultural perspective. Natural conflict resolution, 2000, 334-351. |
[98] |
Schramm-Nielsen, J., Conflict Management in Scandinavia. Paper presented at the IACM 15th Annual Conference, 2002. https://doi.org/10.2139/ssrn.305153 doi: 10.2139/ssrn.305153![]() |
[99] |
Lunenburg, F.C., Power and leadership: an influence process. International journal of management, business, and administration, 2012, 15(1): 1-9. |
[100] |
Varela, O.E., Salgado, E.I. and Lasio, M.V., The Meaning of Job Performance in Collectivistic and High Power Distance Cultures: Evidence from Three Latin American Countries. Cross Cultural Management An International Journal, 2010, 17(4): 407-426. https://doi.org/10.1108/13527601011086603 doi: 10.1108/13527601011086603![]() |
[101] |
Greenberg, J., Stealing in the name of justice: Informational and interpersonal moderators of theft reactions to underpayment inequity. Organizational behavior and human decision processes, 1993, 54(1): 81-103. https://doi.org/10.1006/obhd.1993.1004 doi: 10.1006/obhd.1993.1004![]() |
[102] |
Wang, Y., Long, L., Zhou, H. and Zu, W., 分配不公正下的退缩行为: 程序公正和互动公正的影响[Withdrawn Behaviors under Distributive Injustice: The Influence of Procedural Justice and Interactional Justice]. Acta Psychologica Sinica, 2007, (02): 335-342. |
[103] |
Fei, X., 乡土中国修订版[Rural China], 2013, Shanghai: Shanghai people's publishing house. |
[104] |
Choi, J. and Chen, C.C., The relationships of distributive justice and compensation system fairness to employee attitudes in international joint ventures. Journal of Organizational Behavior, 2007, 28(6): 687-703. https://doi.org/10.1002/job.438 doi: 10.1002/job.438![]() |
[105] |
Trompenaars, F. and Hampden-Turner, C., Riding the waves of culture: Understanding diversity in global business, 2011, Nicholas Brealey Publishing. |
[106] |
Han, W. and Xi, Y., 关系: 中国商业活动的基本模式探讨[Relationship: the basic model of Chinese commercial activities]. Journal of Northwestern University (PHILOSOPHY AND SOCIAL SCIENCES EDITION), 2001, 31(01): 43-47. |
[107] |
Luo, Y., Guanxi: Principles, Philosophies, and Implications. Human Systems Management, 1997, 16(1): 43-51. https://doi.org/10.3233/HSM-1997-16106 doi: 10.3233/HSM-1997-16106![]() |
[108] |
Huang, G., 人情与面子中国人的权利游戏[Favor and Face: Power Game of Chinese], 2010, China Renmin University Press. |
[109] |
Zhou, J., 权力距离导向对员工沉默的作用机制研究[A study on the mechanism of the relationship between power distance orientation and employee silence], 2013, (Doctor), Huazhong University of Science and Technology. |
Property P | α | β | c1 | c2 | R2 | SE | F | SF |
BP | −0.6 | 1.2 | 11.072 | −28.642 | 0.9923 | 8.913 | 2565.3 | 1.36×10⁻²² |
S | 6.9 | −13.4 | 26259 | 53.611 | 0.9406 | 3.08 | 316.6 | 9.9×10⁻¹⁴ |
ω | 5.8 | −10.6 | 12.3447 | 0.169 | 0.9827 | 0.0095 | 511.3 | 3.1×10⁻⁹ |
logP | −0.1 | 0.3 | 0.2201 | 0.344 | 0.97853 | 0.172 | 911.4 | 3.7×10⁻¹⁸ |
RI | 2.1 | −0.6 | 10.8178 | −54.59 | 0.9983 | 4.12 | 11448 | 4.6×10⁻²⁹ |
ΔHf | 2.3 | −4.5 | 282.563 | 37.322 | 0.946 | 12.22 | 351.7 | 3.7×10⁻¹⁴ |
Property P | Specific (α,β) | Generalized (α∗,β∗) | Unified Model |
BP | 0.9923 | 0.9888 | 0.9776 |
S | 0.9406 | 0.9298 | 0.828 |
ω | 0.9827 | 0.9766 | 0.8698 |
logP | 0.9785 | 0.9768 | 0.9679 |
RI | 0.9983 | 0.9948 | 0.9901 |
ΔHf | 0.9462 | 0.9445 | 0.9382 |
Property | Mα,β | M1 | M2 | R | ID |
BP | 0.9923 | 0.9666 | 0.8972 | 0.9575 | 0.8794 |
S | 0.9406 | 0.887 | 0.8167 | 0.8916 | 0.7733 |
ω | 0.9827 | 0.9662 | 0.937 | 0.9444 | 0.8745 |
logP | 0.9785 | 0.9541 | 0.8851 | 0.9401 | 0.8498 |
RI | 0.9983 | 0.9729 | 0.9045 | 0.9641 | 0.8893 |
ΔHf | 0.9462 | 0.9031 | 0.8291 | 0.9198 | 0.8273 |
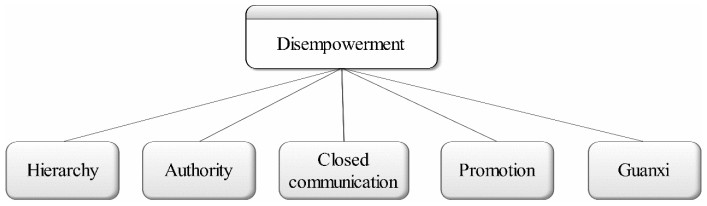
Themes of disempowerment in the perceptions of local employees
Power distance index adapted from [42]
Themes of closed communication in the perceptions of local employees