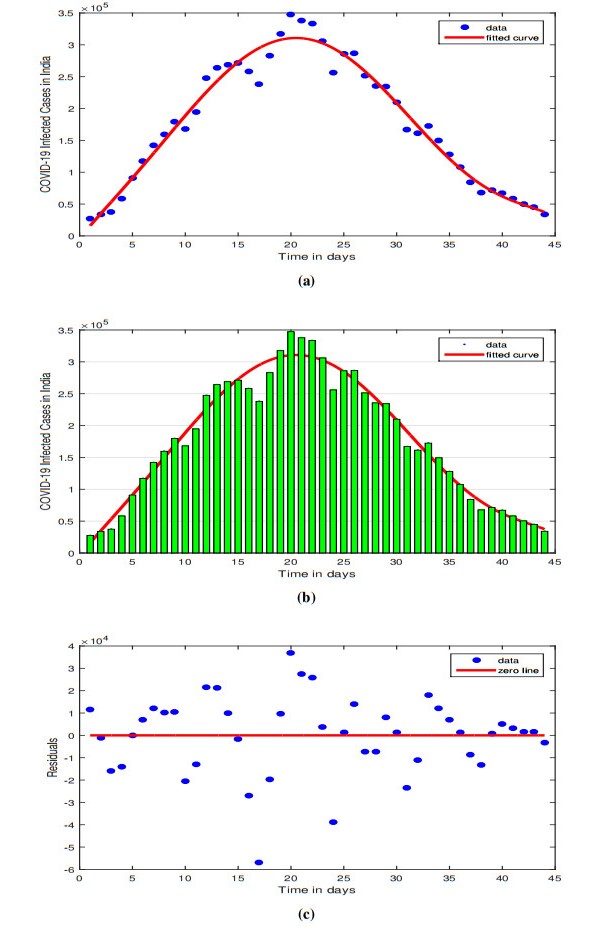
This study explores the use of numerical simulations to model the spread of the Omicron variant of the SARS-CoV-2 virus using fractional-order COVID-19 models and Haar wavelet collocation methods. The fractional order COVID-19 model considers various factors that affect the virus's transmission, and the Haar wavelet collocation method offers a precise and efficient solution to the fractional derivatives used in the model. The simulation results yield crucial insights into the Omicron variant's spread, providing valuable information to public health policies and strategies designed to mitigate its impact. This study marks a significant advancement in comprehending the COVID-19 pandemic's dynamics and the emergence of its variants. The COVID-19 epidemic model is reworked utilizing fractional derivatives in the Caputo sense, and the model's existence and uniqueness are established by considering fixed point theory results. Sensitivity analysis is conducted on the model to identify the parameter with the highest sensitivity. For numerical treatment and simulations, we apply the Haar wavelet collocation method. Parameter estimation for the recorded COVID-19 cases in India from 13 July 2021 to 25 August 2021 has been presented.
Citation: Rahat Zarin, Usa Wannasingha Humphries, Amir Khan, Aeshah A. Raezah. Computational modeling of fractional COVID-19 model by Haar wavelet collocation Methods with real data[J]. Mathematical Biosciences and Engineering, 2023, 20(6): 11281-11312. doi: 10.3934/mbe.2023500
This study explores the use of numerical simulations to model the spread of the Omicron variant of the SARS-CoV-2 virus using fractional-order COVID-19 models and Haar wavelet collocation methods. The fractional order COVID-19 model considers various factors that affect the virus's transmission, and the Haar wavelet collocation method offers a precise and efficient solution to the fractional derivatives used in the model. The simulation results yield crucial insights into the Omicron variant's spread, providing valuable information to public health policies and strategies designed to mitigate its impact. This study marks a significant advancement in comprehending the COVID-19 pandemic's dynamics and the emergence of its variants. The COVID-19 epidemic model is reworked utilizing fractional derivatives in the Caputo sense, and the model's existence and uniqueness are established by considering fixed point theory results. Sensitivity analysis is conducted on the model to identify the parameter with the highest sensitivity. For numerical treatment and simulations, we apply the Haar wavelet collocation method. Parameter estimation for the recorded COVID-19 cases in India from 13 July 2021 to 25 August 2021 has been presented.

| [1] | A. S. Omrani, J. A. Al-Tawfiq, Z. A. Memish, Middle east respiratory syndrome coronavirus (MERS-CoV): Animal to human interaction, pathogens and global health, 109 (2015), 354–362. https://doi.org/10.1080/20477724.2015.1122852 |
| [2] | World Health Organization, Weekly epidemiological update on COVID-19–-11 January 2023, 2023. Available from: https://www.who.int/publications/m/item/weekly-epidemiological-update-on-covid-19-11-january-2023 |
| [3] |
M. Z. Tay, C. M. Poh, L. Rénia, P. A. MacAry, L. F. Ng, The trinity of COVID-19: immunity, inflammation and intervention, Nat. Rev. Immunol., 20 (2020), 363–374. https://doi.org/10.1038/s41577-020-0311-8 doi: 10.1038/s41577-020-0311-8

|
| [4] |
I. Owusu-Mensah, L. Akinyemi, B. Oduro, O. S. Iyiola, A fractional order approach to modeling and simulations of the novel COVID-19, Adv. Differ. Equations, 1 (2020), 1–21. https://doi.org/10.1186/s13662-020-03141-7 doi: 10.1186/s13662-020-03141-7
|
| [5] |
E. Iboi, A. Richardson, R. Ruffin, D. Ingram, J. Clark, J. Hawkins, et al., Impact of public health education program on the novel coronavirus outbreak in the United States, Front. Public Health, 9 (2021), 630974. https://doi.org/10.3389/fpubh.2021.630974 doi: 10.3389/fpubh.2021.630974
|
| [6] |
S. E. Eikenberry, M. Mancuso, E. Iboi, T. Phan, K. Eikenberry, Y. Kuang, et al., To mask or not to mask: Modeling the potential for face mask use by the general public to curtail the COVID-19 pandemic, Infec. Dis. Modell., 5 (2020), 293–308. https://doi.org/10.1016/j.idm.2020.04.001 doi: 10.1016/j.idm.2020.04.001
|
| [7] |
A. Khan, R. Zarin, G. Hussain, N. A. Ahmad, M. H. Mohd, A. Yusuf, Stability analysis and optimal control of covid-19 with convex incidence rate in Khyber Pakhtunkhawa (Pakistan), Results Phys., 20 (2021), 103703. https://doi.org/10.1016/j.rinp.2020.103703 doi: 10.1016/j.rinp.2020.103703
|
| [8] |
P. Veeresha, L. Akinyemi, Fractional approach for mathematical model of Phytoplankton–toxic phytoplankton–zooplankton system with Mittag-Leffler kernel, Int. J. Biomath., 16 (2023), 2250090. https://doi.org/10.1142/S1793524522500905 doi: 10.1142/S1793524522500905
|
| [9] |
Z. U. A. Zafar, M. Inc, F. Tchier, L. Akinyemi, Stochastic suicide substrate reaction model, Phys. A, 610 (2023), 128384. https://doi.org/10.1016/j.physa.2022.128384 doi: 10.1016/j.physa.2022.128384
|
| [10] |
S. J. Achar, C. Baishya, P. Veeresha, L. Akinyemi, Dynamics of fractional model of biological pest control in tea plants with Beddington–DeAngelis functional response, Fractal Fractional, 6 (2021), 1. https://doi.org/10.3390/fractalfract6010001 doi: 10.3390/fractalfract6010001
|
| [11] |
A. Khan, R. Zarin, U. W. Humphries, A. Akgül, A. Saeed, T. Gul, Fractional optimal control of COVID-19 pandemic model with generalized Mittag-Leffler function, Adv. Differ. Equations, 1 (2021), 1–22. https://doi.org/10.1186/s13662-021-03546-y doi: 10.1186/s13662-021-03546-y
|
| [12] |
M. S. Alqarni, M. Alghamdi, T. Muhammad, A. S. Alshomrani, M. A. Khan, Mathematical modeling for novel coronavirus (COVID-19) and control, Numer. Methods Partial Differ. Equations, 38 (2022), 760–776. https://doi.org/10.1002/num.22695 doi: 10.1002/num.22695
|
| [13] |
A. Khan, R. Zarin, S. Khan, A. Saeed, T. Gul, U. W. Humphries, Fractional dynamics and stability analysis of COVID-19 pandemic model under the harmonic mean type incidence rate, Comput. Methods Biomech. Biomed. Eng., 25 (2022), 619–640. https://doi.org/10.1080/10255842.2021.1972096 doi: 10.1080/10255842.2021.1972096
|
| [14] |
T. Krueger, K. Gogolewski, M. Bodych, A. Gambin, G. Giordano, S. Cuschieri, et al., Risk assessment of COVID-19 epidemic resurgence in relation to SARS-CoV-2 variants and vaccination passes, Commun. Med., 2 (2022), 23. https://doi.org/10.1038/s43856-022-00084-w doi: 10.1038/s43856-022-00084-w
|
| [15] |
A. Calero-Valdez, E. N. Iftekhar, M. Oliu-Barton, R. Böhm, S. Cuschieri, T. Czypionka, et al., Europe must come together to confront omicron, BMJ, 376 (2022), o90. https://doi.org/10.1136/bmj.o90 doi: 10.1136/bmj.o90
|
| [16] |
R. Markovič, M. Šterk, M. Marhl, M. Perc, M. Gosak, Socio-demographic and health factors drive the epidemic progression and should guide vaccination strategies for best COVID-19 containment, Results Phys., 26 (2021), 104433. https://doi.org/10.1016/j.rinp.2021.104433 doi: 10.1016/j.rinp.2021.104433
|
| [17] |
M. Goyal, H. M. Baskonus, A. Prakash, An efficient technique for a time fractional model of lassa hemorrhagic fever spreading in pregnant women, Eur. Phys. J. Plus, 134 (2019), 482. https://doi.org/10.1140/epjp/i2019-12854-0 doi: 10.1140/epjp/i2019-12854-0
|
| [18] |
W. Gao, P. Veeresha, D. G. Prakasha, H. M. Baskonus, G. Yel, New approach for the model describing the deathly disease in pregnant women using Mittag-Leffler function, Chaos Solitons Fractals, 134 (2020), 109696. https://doi.org/10.1016/j.chaos.2020.109696 doi: 10.1016/j.chaos.2020.109696
|
| [19] |
R. T. Alqahtani, S. Ahmad, A. Akgül, Dynamical analysis of bio-ethanol production model under generalized nonlocal operator in Caputo sense, Mathematics, 9 (2021), 2370. https://doi.org/10.3390/math9192370 doi: 10.3390/math9192370
|
| [20] |
P. Agarwal, R. Singh, Modelling of transmission dynamics of Nipah virus (Niv): A fractional order approach, Phys. A, 547 (2020), 124243. https://doi.org/10.1016/j.physa.2020.124243 doi: 10.1016/j.physa.2020.124243
|
| [21] | R. Zarin, A. Khan, A. Yusuf, S. Abdel-Khalek, M. Inc, Analysis of fractional COVID-19 epidemic model under Caputo operator, Math. Methods Appl. Sci., 2021 (2021). https://doi.org/10.1002/mma.7294 |
| [22] |
R. Zarin, A. Khan, P. Kumar, Fractional-order dynamics of Chagas-HIV epidemic model with different fractional operators, AIMS Math., 7 (2022), 18897–18924. https://doi.org/10.3934/math.20221041 doi: 10.3934/math.20221041
|
| [23] |
D. Baleanu, A. Fernandez, A. Akgül, On a fractional operator combining proportional and classical differintegrals, Mathematics, 8 (2020), 360. https://doi.org/10.3390/math8030360 doi: 10.3390/math8030360
|
| [24] |
M. Caputo, M. Fabrizio, A new definition of fractional derivative without singular kernel, Prog. Fractional Differ. Appl., 1 (2015), 73–85. http://dx.doi.org/10.12785/pfda/010201 doi: 10.12785/pfda/010201
|
| [25] | A. Atangana, D. Baleanu, New fractional derivatives with nonlocal and non-singular kernel: Theory and application to heat transfer model, preprint, arXiv: 1602.03408. |
| [26] | P. Agarwal, J. Choi, R. B. Paris, Extended Riemann-Liouville fractional derivative operator and its applications, J. Sci. Appl., 8 (2015), 451–466. |
| [27] |
R. Zarin, A. Khan, M. Inc, U. W. Humphries, T. Karite, Dynamics of five grade leishmania epidemic model using fractional operator with Mittag–Leffler kernel, Chaos Solitons Fractals, 147 (2021), 110985. https://doi.org/10.1016/j.chaos.2021.110985 doi: 10.1016/j.chaos.2021.110985
|
| [28] |
P. Agarwal, J. Choi, Fractional calculus operators and their image formulas, J. Korean Math. Soc., 53 (2016), 1183–1210. https://doi.org/10.4134/JKMS.j150458 doi: 10.4134/JKMS.j150458
|
| [29] |
A. Atangana, Non validity of index law in fractional calculus: A fractional differential operator with Markovian and non-Markovian properties, Phys. A, 505 (2018), 688–706. https://doi.org/10.1016/j.physa.2018.03.056 doi: 10.1016/j.physa.2018.03.056
|
| [30] |
D. Kumar, J. Singh, D. Baleanu, A new analysis of the Fornberg-Whitham equation pertaining to a fractional derivative with Mittag-Leffler-type kernel, Eur. Phys. J. Plus, 133 (2018), 1–10. https://doi.org/10.1140/epjp/i2018-11934-y doi: 10.1140/epjp/i2018-11934-y
|
| [31] |
D. Kumar, J. Singh, S. D. Purohit, R. Swroop, A hybrid analytical algorithm for nonlinear fractional wave-like equations, Math. Modell. Nat. Phenom., 14 (2019), 304. https://doi.org/10.1051/mmnp/2018063 doi: 10.1051/mmnp/2018063
|
| [32] |
P. Liu, X. Huang, R. Zarin, T. Cui, A. Din, Modeling and numerical analysis of a fractional order model for dual variants of SARS-CoV-2, Alexandria Eng. J., 65 (2023), 427–442. https://doi.org/10.1016/j.aej.2022.10.025 doi: 10.1016/j.aej.2022.10.025
|
| [33] |
R. Zarin, I. Ahmed, P. Kumam, A. Zeb, A. Din, Fractional modeling and optimal control analysis of rabies virus under the convex incidence rate, Results Phys., 28 (2021), 104665. https://doi.org/10.1016/j.rinp.2021.104665 doi: 10.1016/j.rinp.2021.104665
|
| [34] |
A. Atangana, A novel Covid-19 model with fractional differential operators with singular and non-singular kernels: Analysis and numerical scheme based on Newton polynomial, Alexandria Eng. J., 60 (2021), 3781–3806. https://doi.org/10.1016/j.aej.2021.02.016 doi: 10.1016/j.aej.2021.02.016
|
| [35] |
M. U. Rahman, M. Arfan, W. Deebani, P. Kumam, Z. Shah, Analysis of time-fractional Kawahara equation under Mittag-Leffler Power Law, Fractals, 30 (2022), 2240021. https://doi.org/10.1142/S0218348X22400461 doi: 10.1142/S0218348X22400461
|
| [36] |
K. Bansal, S. Arora, K. S. Pritam, T. Mathur, S. Agarwal, Dynamics of crime transmission using fractional-order differential equations, Fractals, 30 (2022), 2250012. https://doi.org/10.1142/S0218348X22500128 doi: 10.1142/S0218348X22500128
|
| [37] |
K. S. Pritam, T. Mathur, S. Agarwal, Underlying dynamics of crime transmission with memory, Chaos Solitons Fractals, 146 (2021), 110838. https://doi.org/10.1016/j.chaos.2021.110838 doi: 10.1016/j.chaos.2021.110838
|
| [38] |
M. Partohaghighi, V. Kumar, A. Akgül, Comparative study of the fractional-order crime system as a social epidemic of the USA scenario, Int. J. Appl. Comput. Math., 8 (2022), 1–17. https://doi.org/10.1007/s40819-022-01399-x doi: 10.1007/s40819-022-01399-x
|
| [39] |
M. U. Rahman, S. Ahmad, M. Arfan, A. Akgül, F. Jarad, Fractional order mathematical model of serial killing with different choices of control strategy, Fractal Fractional, 6 (2022), 162. https://doi.org/10.3390/fractalfract6030162 doi: 10.3390/fractalfract6030162
|
| [40] | S. Zhi, L. Y. Deng, J. C. Qing, Numerical solution of differential equations by using Haar wavelets, in Proceeding of the International Conference on Wavelet Analysis and Pattern Recognition, (2007), 1037–1044. https://doi.org/10.1109/ICWAPR.2007.4421585 |
| [41] |
K. Shah, Z. A. Khan, A. Ali, R. Amin, H. Khan, A. Khan, Haar wavelet collocation approach for the solution of fractional order COVID-19 model using Caputo derivative, Alexandria Eng. J., 59 (2020), 3221–3231. https://doi.org/10.1016/j.aej.2020.08.028 doi: 10.1016/j.aej.2020.08.028
|
| [42] |
B. Prakash, A. Setia, D. Alapatt, Numerical solution of nonlinear fractional SEIR epidemic model by using Haar wavelets, J. Comput. Sci., 22 (2017), 109–118. https://doi.org/10.1016/j.jocs.2017.09.001 doi: 10.1016/j.jocs.2017.09.001
|
| [43] |
D. Kumar, R. P. Agarwal, J. Singh, A modified numerical scheme and convergence analysis for fractional model of Lienard's equation, J. Comput. Appl. Math., 339 (2018), 405–413. https://doi.org/10.1016/j.cam.2017.03.011 doi: 10.1016/j.cam.2017.03.011
|
| [44] |
A. Goswami, J. Singh, D. Kumar, An efficient analytical approach for fractional equal width equations describing hydro-magnetic waves in cold plasma, Phys. A, 524 (2019), 563–575. https://doi.org/10.1016/j.physa.2019.04.058 doi: 10.1016/j.physa.2019.04.058
|
| [45] |
M. Caputo, F. Mainardi, A new dissipation model based on memory mechanism, Pure Appl. Geophys., 91 (1971), 134–147. https://doi.org/10.1007/BF00879562 doi: 10.1007/BF00879562
|
| [46] |
Y. Chen, M. Yi, C. Yu, Error analysis for numerical solution of fractional differential equation by Haar wavelets method, J. Comput. Sci., 3 (2012), 367–373. https://doi.org/10.1016/j.jocs.2012.04.008 doi: 10.1016/j.jocs.2012.04.008
|
| [47] | Ü. Lepik, H. Hein, Haar wavelets, in Haar Wavelets, Springer, 2014. https://doi.org/10.1007/978-3-319-04295-4 |
| [48] |
P. Van den Driessche, J. Watmough, Reproduction number and sub-threshold endemic equilbria for compartmental models of disease transmission, Math. Biosci., 180 (2002), 29–38. https://doi.org/10.1016/S0025-5564(02)00108-6 doi: 10.1016/S0025-5564(02)00108-6
|
| [49] | A. E. Taylor, D. C. Lay, Introduction to Functional Analysis, CRC Press, 1958. |
| [50] | World Health Organization, https://www.who.int/countries/ind/. |
| [51] |
Ü Lepik, Numerical solution of differential equations using Haar wavelets, Math. Comput. Simul., 68 (2005), 127–143. https://doi.org/10.1016/j.matcom.2004.10.005 doi: 10.1016/j.matcom.2004.10.005
|
| [52] | S. C. Shiralashetti, R. A. Mundewadi, S. S. Naregal, B. Veeresh, Haar wavelet collocation method for the numerical solution of nonlinear Volterra-Fredholm-Hammerstein integral equations, Global J. Pure Appl. Math., 13 (2017), 463–474. |
| [53] |
Y. Li, W. Zhao, Haar wavelet operational matrix of fractional order integration and its applications in solving the fractional order differential equations, Appl. Math. Comput., 216 (2010), 2276–2285. https://doi.org/10.1016/j.amc.2010.03.063 doi: 10.1016/j.amc.2010.03.063
|
| [54] |
J. Majak, B. Shvartsman, K. Karjust, M. Mikola, A. Haavajõe, M. Pohlak, On the accuracy of the Haar wavelet discretization method, Compos. Part B Eng., 80 (2015), 321–327. https://doi.org/10.1016/j.compositesb.2015.06.008 doi: 10.1016/j.compositesb.2015.06.008
|
| [55] |
R. Zarin, H. Khaliq, A. Khan, I. Ahmed, U. W. Humphries, A numerical study based on Haar wavelet collocation methods of fractional-order antidotal computer virus model, Symmetry, 15 (2023), 621. https://doi.org/10.3390/sym15030621 doi: 10.3390/sym15030621
|


Figures(7) / Tables(1)

Rahat Zarin, Usa Wannasingha Humphries, Amir Khan, Aeshah A. Raezah. Computational modeling of fractional COVID-19 model by Haar wavelet collocation Methods with real data[J]. Mathematical Biosciences and Engineering, 2023, 20(6): 11281-11312. doi: 10.3934/mbe.2023500


 DownLoad: