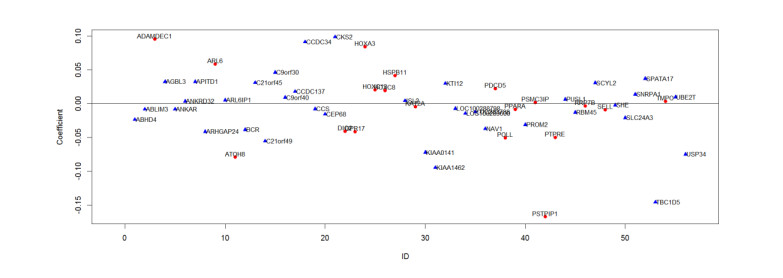
Penalized Cox regression can efficiently be used for the determination of biomarkers in high-dimensional genomic data related to disease prognosis. However, results of Penalized Cox regression is influenced by the heterogeneity of the samples who have different dependent structure between survival time and covariates from most individuals. These observations are called influential observations or outliers. A robust penalized Cox model (Reweighted Elastic Net-type maximum trimmed partial likelihood estimator, Rwt MTPL-EN) is proposed to improve the prediction accuracy and identify influential observations. A new algorithm AR-Cstep to solve Rwt MTPL-EN model is also proposed. This method has been validated by simulation study and application to glioma microarray expression data. When there were no outliers, the results of Rwt MTPL-EN were close to the Elastic Net (EN). When outliers existed, the results of EN were impacted by outliers. And whenever the censored rate was large or low, the robust Rwt MTPL-EN performed better than EN. and could resist the outliers in both predictors and response. In terms of outliers detection accuracy, Rwt MTPL-EN was much higher than EN. The outliers who "lived too long" made EN perform worse, but were accurately detected by Rwt MTPL-EN. Through the analysis of glioma gene expression data, most of the outliers identified by EN were those "failed too early", but most of them were not obvious outliers according to risk estimated from omics data or clinical variables. Most of the outliers identified by Rwt MTPL-EN were those who "lived too long", and most of them were obvious outliers according to risk estimated from omics data or clinical variables. Rwt MTPL-EN can be adopted to detect influential observations in high-dimensional survival data.
Citation: Hongwei Sun, Qian Gao, Guiming Zhu, Chunlei Han, Haosen Yan, Tong Wang. Identification of influential observations in high-dimensional survival data through robust penalized Cox regression based on trimming[J]. Mathematical Biosciences and Engineering, 2023, 20(3): 5352-5378. doi: 10.3934/mbe.2023248
Penalized Cox regression can efficiently be used for the determination of biomarkers in high-dimensional genomic data related to disease prognosis. However, results of Penalized Cox regression is influenced by the heterogeneity of the samples who have different dependent structure between survival time and covariates from most individuals. These observations are called influential observations or outliers. A robust penalized Cox model (Reweighted Elastic Net-type maximum trimmed partial likelihood estimator, Rwt MTPL-EN) is proposed to improve the prediction accuracy and identify influential observations. A new algorithm AR-Cstep to solve Rwt MTPL-EN model is also proposed. This method has been validated by simulation study and application to glioma microarray expression data. When there were no outliers, the results of Rwt MTPL-EN were close to the Elastic Net (EN). When outliers existed, the results of EN were impacted by outliers. And whenever the censored rate was large or low, the robust Rwt MTPL-EN performed better than EN. and could resist the outliers in both predictors and response. In terms of outliers detection accuracy, Rwt MTPL-EN was much higher than EN. The outliers who "lived too long" made EN perform worse, but were accurately detected by Rwt MTPL-EN. Through the analysis of glioma gene expression data, most of the outliers identified by EN were those "failed too early", but most of them were not obvious outliers according to risk estimated from omics data or clinical variables. Most of the outliers identified by Rwt MTPL-EN were those who "lived too long", and most of them were obvious outliers according to risk estimated from omics data or clinical variables. Rwt MTPL-EN can be adopted to detect influential observations in high-dimensional survival data.

| [1] |
Z. Liu, M. Li, Q. Hua, Y. Li, G. Wang, Identification of an eight-lncrna prognostic model for breast cancer using wgcna network analysis and a cox‑proportional hazards model based on l1-penalized estimation, Int. J. Mol. Med., 44 (2019), 1333–1343. https://doi.org/10.3892/ijmm.2019.4303 doi: 10.3892/ijmm.2019.4303

|
| [2] |
X. Y. Shen, X. P. Liu, C. K. Song, Y. J. Wang, S. Li, W. D. Hu, Genome‐wide analysis reveals alcohol dehydrogenase 1c and secreted phosphoprotein 1 for prognostic biomarkers in lung adenocarcinoma, J. Cellular Physiol., 234 (2019), 22311–22320. https://doi.org/10.1002/jcp.28797 doi: 10.1002/jcp.28797
|
| [3] |
L. Wang, J. Shi, Y. Huang, S. Liu, J. Zhang, H. Ding, et al., A six-gene prognostic model predicts overall survival in bladder cancer patients, Cancer Cell Int., 19 (2019), 229. https://doi.org/10.1186/s12935-019-0950-7 doi: 10.1186/s12935-019-0950-7
|
| [4] |
J. Choi, S. Park, Y. Yoon, J. Ahn, Improved prediction of breast cancer outcome by identifying heterogeneous biomarkers, Bioinformatics, 33 (2017), 3619–3626. https://doi.org/10.1093/bioinformatics/btx487 doi: 10.1093/bioinformatics/btx487
|
| [5] |
K. Polyak, Heterogeneity in breast cancer, J. Clin. Invest., 121 (2011), 3786–3788. https://doi.org/10.1172/JCI60534 doi: 10.1172/JCI60534
|
| [6] |
R. A. Burrell, N. McGranahan, J. Bartek, C. Swanton, The causes and consequences of genetic heterogeneity in cancer evolution, Nature, 501 (2013), 338–345. https://doi.org/10.1038/nature12625 doi: 10.1038/nature12625
|
| [7] |
A. Nardi, M. Schemper, New residuals for cox regression and their application to outlier screening, Biometrics, 55 (1999), 523–529. https://doi.org/10.1111/j.0006-341X.1999.00523.x doi: 10.1111/j.0006-341X.1999.00523.x
|
| [8] |
M. Valsecchi, D. Silvestri, P. Sasieni, Evaluation of long‐term survival: Use of diagnostics and robust estimators with cox's proportional hazards model, Stat. Med., 15 (1996), 2763–2780. https://doi.org/10.1002/(SICI)1097-0258(19961230)15:24<2763::AID-SIM319>3.0.CO;2-O doi: 10.1002/(SICI)1097-0258(19961230)15:24<2763::AID-SIM319>3.0.CO;2-O
|
| [9] |
E. Carrasquinha, A. Veríssimo, M. B. Lopes, S. Vinga, Identification of influential observations in high-dimensional cancer survival data through the rank product test, BioData mining, 11 (2018), 1. https://doi.org/10.1186/s13040-018-0162-z doi: 10.1186/s13040-018-0162-z
|
| [10] |
S. Peng, H. Dhruv, B. Armstrong, B. Salhia, C. Legendre, J. Kiefer, et al., Integrated genomic analysis of survival outliers in glioblastoma, Neuro-oncol., 19 (2017), 833–844. https://doi.org/10.1093/neuonc/nox036.104 doi: 10.1093/neuonc/nox036.104
|
| [11] |
P. J. Rousseeuw, Least median of squares regression, J. Am. Stat. Assoc., 79 (1984), 871–880. https://doi.org/10.1080/01621459.1984.10477105 doi: 10.1080/01621459.1984.10477105
|
| [12] |
A. Farcomeni, S. Viviani, Robust estimation for the cox regression model based on trimming, Biometr. J., 53 (2011), 956–973. https://doi.org/10.1002/bimj.201100008 doi: 10.1002/bimj.201100008
|
| [13] |
P. J. Rousseeuw, K. Van Driessen, Computing lts regression for large data sets, Data mining and knowledge discovery, 12 (2006), 29–45. https://doi.org/10.1007/s10618-005-0024-4 doi: 10.1007/s10618-005-0024-4
|
| [14] |
B. Chakraborty, P. Chaudhuri, On an optimization problem in robust statistics, J. Comput. Graph. Stat., 17 (2008), 683–702. https://doi.org/10.1198/106186008X340751 doi: 10.1198/106186008X340751
|
| [15] |
T. M. Therneau, P. M. Grambsch, T. R. Fleming, Martingale-based residuals for survival models, Biometrika, 77 (1990), 147–160. https://doi.org/10.1093/biomet/77.1.147 doi: 10.1093/biomet/77.1.147
|
| [16] | J. Klein, M. Moeschberger, Survival analysis: Techniques for censored and truncated data springer, New York (1997), |
| [17] |
R. Bender, T. Augustin, M. Blettner, Generating survival times to simulate cox proportional hazards models, Stat. Med., 24 (2005), 1713–1723. https://doi.org/10.1002/sim.2059 doi: 10.1002/sim.2059
|
| [18] |
L. D. Maxim, R. Niebo, M. J. Utell, Screening tests: A review with examples, Inhal Toxicol., 26 (2014), 811–828. https://doi.org/10.3109/08958378.2014.955932 doi: 10.3109/08958378.2014.955932
|
| [19] |
N. Ternes, F. Rotolo, S. Michiels, Empirical extensions of the lasso penalty to reduce the false discovery rate in high-dimensional cox regression models, Stat. Med., 35 (2016), 2561–2573. https://doi.org/10.1002/sim.6927 doi: 10.1002/sim.6927
|
| [20] |
H. Uno, T. Cai, M. J. Pencina, On the c-statistics for evaluating overall adequacy of risk prediction procedures with censored survival data, Stat. Med., 30 (2011), 1105–1117. https://doi.org/10.1002/sim.4154 doi: 10.1002/sim.4154
|
| [21] |
W. Cheng, M. Li, Y. Jiang, C. Zhang, J. Cai, K. Wang, et al., Association between small heat shock protein b11 and the prognostic value of mgmt promoter methylation in patients with high-grade glioma, J. Neurosurg., (2015), 1–10. https://doi.org/10.3171/2015.5.JNS142437 doi: 10.3171/2015.5.JNS142437
|
| [22] |
A. Bunevicius, E. R. Laws, A. Saudargiene, A. Tamasauskas, G. Iervasi, V. Deltuva, et al., Common genetic variations of deiodinase genes and prognosis of brain tumor patients, Endocrine, 66 (2019), 563–572. https://doi.org/10.1007/s12020-019-02016-6 doi: 10.1007/s12020-019-02016-6
|
| [23] |
D. Carvalho, A. Mackay, L. Bjerke, R. G. Grundy, C. Lopes, R. M. Reis, et al., The prognostic role of intragenic copy number breakpoints and identification of novel fusion genes in paediatric high grade glioma, Acta Neuropathol. Commun., 2 (2014), 23. https://doi.org/10.1186/2051-5960-2-23 doi: 10.1186/2051-5960-2-23
|
| [24] |
M. Sibin, S. Harshitha, K. Narasingarao, I. B. Dhananjaya, P. S. Dhaval, G. Chetan, Effect of rs11614913 polymorphism on mature mir196a2 expression and its target gene hoxc8 expression in human glioma, J. Mol. Neurosci., 61 (2017), 144–151. https://doi.org/10.1007/s12031-016-0855-z doi: 10.1007/s12031-016-0855-z
|
| [25] |
L. Zhang, G. Wang, S. Chen, J. Ding, S. Ju, H. Cao, et al., Depletion of thymopoietin inhibits proliferation and induces cell cycle arrest/apoptosis in glioblastoma cells, World J. Surg. Oncol., 14 (2016), 267. https://doi.org/10.1186/s12957-016-1018-y doi: 10.1186/s12957-016-1018-y
|
| [26] |
A. Jimenez-Pascual, J. D. Lathia, F. A. Siebzehnrubl, Adamdec1 and fgf2/fgfr1 signaling constitute a positive feedback loop to maintain gbm cancer stem cells, Mol. Cell. Oncol., 7 (2020), 1684787. https://doi.org/10.1080/23723556.2019.1684787 doi: 10.1080/23723556.2019.1684787
|
| [27] |
S. H. Miao, H. B. Sun, Y. Ye, J. J. Yang, Y. W. Shi, M. Lu, et al., Astrocytic jwa expression is essential to dopaminergic neuron survival in the pathogenesis of parkinson's disease, CNS Neurosci. Ther., 20 (2014), 754-762. https://doi.org/10.1111/cns.12249 doi: 10.1111/cns.12249
|
| [28] |
F. Ducray, A. Idbaih, A. de Reyniès, I. Bièche, J. Thillet, K. Mokhtari, et al., Anaplastic oligodendrogliomas with 1p19q codeletion have a proneural gene expression profile, Mol. Cancer, 7 (2008), 41. https://doi.org/10.1186/1476-4598-7-41 doi: 10.1186/1476-4598-7-41
|
| [29] |
J. D. Dougherty, E. I. Fomchenko, A. A. Akuffo, E. Schmidt, K. Y. Helmy, E. Bazzoli, et al., Candidate pathways for promoting differentiation or quiescence of oligodendrocyte progenitor-like cells in glioma, Cancer Res., 72 (2012), 4856–4868. https://doi.org/10.1158/0008-5472.CAN-11-2632 doi: 10.1158/0008-5472.CAN-11-2632
|
| [30] |
A. Di Vinci, I. Casciano, E. Marasco, B. Banelli, G. L. Ravetti, L. Borzì, et al., Quantitative methylation analysis of hoxa3, 7, 9, and 10 genes in glioma: Association with tumor who grade and clinical outcome, J. Cancer Res. Clin. Oncol., 138 (2012), 35–47. https://doi.org/10.1007/s00432-011-1070-5 doi: 10.1007/s00432-011-1070-5
|
| [31] |
N. Liu, Z. Wang, D. Liu, P. Xie, Hoxc13-as-mir-122-5p-satb1-c-myc feedback loop promotes migration, invasion and emt process in glioma, Onco Targets Ther., 12 (2019), 7165–7173. https://doi.org/10.2147/OTT.S220027 doi: 10.2147/OTT.S220027
|
| [32] |
K. Liu, Q. Zhang, H. Lan, L. Wang, P. Mou, W. Shao, et al., Gcn5 potentiates glioma proliferation and invasion via stat3 and akt signaling pathways, Int. J. Mol. Sci., 16 (2015), 21897–21910. https://doi.org/10.3390/ijms160921897 doi: 10.3390/ijms160921897
|
| [33] | C. Wang, J. K. Li, H. Z. Li, H. D. Gong, The importance of expressing pdcd4 and pdcd5 anti-oncogenes in glioma, J. Biol. Regul. Homeost. Agents, 32 (2018), 731–736. |
| [34] |
H. Wang, W. Wu, H. W. Wang, S. Wang, Y. Chen, X. Zhang, et al., Analysis of specialized DNA polymerases expression in human gliomas: Association with prognostic significance, Neuro-oncology, 12 (2010), 679–686. https://doi.org/10.1093/neuonc/nop074 doi: 10.1093/neuonc/nop074
|
| [35] |
R. Luo, L.-Y. Su, G. Li, J. Yang, Q. Liu, L.-X. Yang, et al., Activation of ppara-mediated autophagy reduces alzheimer disease-like pathology and cognitive decline in a murine model, Autophagy, (2019), 1–18. https://doi.org/10.1080/15548627.2019.1596488 doi: 10.1080/15548627.2019.1596488
|
| [36] |
L. Zhang, Y. Wang, M. H. Rashid, M. Liu, K. Angara, N. F. Mivechi, et al., Malignant pericytes expressing gt198 give rise to tumor cells through angiogenesis, Oncotarget, 8 (2017), 51591–51607. https://doi.org/10.18632/oncotarget.18196 doi: 10.18632/oncotarget.18196
|
| [37] |
G. Li, Z. Wang, C. Zhang, X. Liu, F. Yang, L. Sun, et al., Megf10, a glioma survival-associated molecular signature, predicts idh mutation status, Dis. Markers, 2018 (2018), 5975216. https://doi.org/10.1155/2018/5975216 doi: 10.1155/2018/5975216
|
| [38] | P. Yang, W. Yan, W. Zhang, G. You, Z. Bao and T. Jiang, Whole-genome messenger rna profiling reveals genes involved in malignant progression of glioma, Zhonghua yi xue za zhi, 93 (2013), 5–7. |
| [39] |
V. Haage, M. Semtner, R. O. Vidal, D. P. Hernandez, W. W. Pong, Z. Chen, et al., Comprehensive gene expression meta-analysis identifies signature genes that distinguish microglia from peripheral monocytes/macrophages in health and glioma, Acta Neuropathol. Com., 7 (2019), 20. https://doi.org/10.1186/s40478-019-0665-y doi: 10.1186/s40478-019-0665-y
|
| [40] |
M. N. J. Seaman, A. S. Mukadam, S. Y. Breusegem, Inhibition of tbc1d5 activates rab7a and can enhance the function of the retromer cargo-selective complex, J. Cell. Sci., 131 (2018), jcs217398. https://doi.org/10.1242/jcs.217398 doi: 10.1242/jcs.217398
|
| [41] | S. J. Han, K. Begum, C. E. Foulds, R. A. Hamilton, S. Bailey, A. Malovannaya, et al., The dual Receptor α inhibitory effects of the tissue-selective estrogen complex for endometrial and breast safety, Mol. Pharmacol., 89 (2015), 14–26. 10.1124/mol.115.100925. |
| [42] |
L. B. Liu, J. Huang, J. P. Zhong, G. L. Ye, L. Xue, M. H. Zhou, et al., High expression of ccdc34 is associated with poor survival in cervical cancer patients, Med. Sci. Monit., 24 (2018), 8383–8390. https://doi.org/10.12659/MSM.913346 doi: 10.12659/MSM.913346
|
| [43] |
N. Huang, Z. Wu, H. Hong, X. Wang, F. Yang, H. Li, Overexpression of cks2 is associated with a poor prognosis and promotes cell proliferation and invasion in breast cancer, Mol. Med. Rep., 19 (2019), 4761–4769. https://doi.org/10.3892/mmr.2019.10134 doi: 10.3892/mmr.2019.10134
|
| [44] |
T. Harada, A. Iwai, T. Miyazaki, Identification of dele, a novel dap3-binding protein which is crucial for death receptor-mediated apoptosis induction, Apoptosis, 15 (2010), 1247–1255. https://doi.org/10.1007/s10495-010-0519-3 doi: 10.1007/s10495-010-0519-3
|
| [45] |
C. Li, L. Huang, H. Lu, W. Wang, G. Chen, Y. Gu, et al., Expression and clinical significance of ubiquitin‑specific‑processing protease 34 in diffuse large b‑cell lymphoma, Mol. Med. Rep., 18 (2018), 4543–4554. https://doi.org/10.3892/mmr.2018.9447 doi: 10.3892/mmr.2018.9447
|
 mbe-20-03-248 S1.pdf mbe-20-03-248 S1.pdf |
 |


Figures(9) / Tables(4)

Hongwei Sun, Qian Gao, Guiming Zhu, Chunlei Han, Haosen Yan, Tong Wang. Identification of influential observations in high-dimensional survival data through robust penalized Cox regression based on trimming[J]. Mathematical Biosciences and Engineering, 2023, 20(3): 5352-5378. doi: 10.3934/mbe.2023248


 DownLoad: