Research article

Estimating the time-dependent effective reproduction number and vaccination rate for COVID-19 in the USA and India

  • Received: 29 October 2022 Revised: 08 December 2022 Accepted: 19 December 2022 Published: 28 December 2022
  • The effective reproduction number, Rt, is a vital epidemic parameter utilized to judge whether an epidemic is shrinking, growing, or holding steady. The main goal of this paper is to estimate the combined Rt and time-dependent vaccination rate for COVID-19 in the USA and India after the vaccination campaign started. Accounting for the impact of vaccination into a discrete-time stochastic augmented SVEIR (Susceptible-Vaccinated-Exposed-Infectious-Recovered) model, we estimate the time-dependent effective reproduction number (Rt) and vaccination rate (ξt) for COVID-19 by using a low pass filter and the Extended Kalman Filter (EKF) approach for the period February 15, 2021 to August 22, 2022 in India and December 13, 2020 to August 16, 2022 in the USA. The estimated Rt and ξt show spikes and serrations with the data. Our forecasting scenario represents the situation by December 31, 2022 that the new daily cases and deaths are decreasing for the USA and India. We also noticed that for the current vaccination rate, Rt would remain greater than one by December 31, 2022. Our results are beneficial for the policymakers to track the status of the effective reproduction number, whether it is greater or less than one. As restrictions in these countries ease, it is still important to maintain safety and preventive measures.

    Citation: Sarita Bugalia, Jai Prakash Tripathi, Hao Wang. Estimating the time-dependent effective reproduction number and vaccination rate for COVID-19 in the USA and India[J]. Mathematical Biosciences and Engineering, 2023, 20(3): 4673-4689. doi: 10.3934/mbe.2023216
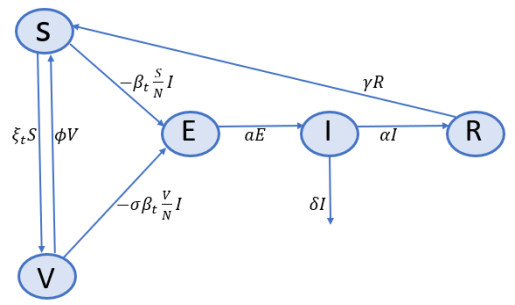
    Related Papers:

    [1] Fang Wang, Lianying Cao, Xiaoji Song . Mathematical modeling of mutated COVID-19 transmission with quarantine, isolation and vaccination. Mathematical Biosciences and Engineering, 2022, 19(8): 8035-8056. doi: 10.3934/mbe.2022376
    [2] Xiaojing Wang, Yu Liang, Jiahui Li, Maoxing Liu . Modeling COVID-19 transmission dynamics incorporating media coverage and vaccination. Mathematical Biosciences and Engineering, 2023, 20(6): 10392-10403. doi: 10.3934/mbe.2023456
    [3] Quentin Griette, Jacques Demongeot, Pierre Magal . What can we learn from COVID-19 data by using epidemic models with unidentified infectious cases?. Mathematical Biosciences and Engineering, 2022, 19(1): 537-594. doi: 10.3934/mbe.2022025
    [4] Weike Zhou, Aili Wang, Fan Xia, Yanni Xiao, Sanyi Tang . Effects of media reporting on mitigating spread of COVID-19 in the early phase of the outbreak. Mathematical Biosciences and Engineering, 2020, 17(3): 2693-2707. doi: 10.3934/mbe.2020147
    [5] Pannathon Kreabkhontho, Watchara Teparos, Thitiya Theparod . Potential for eliminating COVID-19 in Thailand through third-dose vaccination: A modeling approach. Mathematical Biosciences and Engineering, 2024, 21(8): 6807-6828. doi: 10.3934/mbe.2024298
    [6] Yujie Sheng, Jing-An Cui, Songbai Guo . The modeling and analysis of the COVID-19 pandemic with vaccination and isolation: a case study of Italy. Mathematical Biosciences and Engineering, 2023, 20(3): 5966-5992. doi: 10.3934/mbe.2023258
    [7] Aili Wang, Xueying Zhang, Rong Yan, Duo Bai, Jingmin He . Evaluating the impact of multiple factors on the control of COVID-19 epidemic: A modelling analysis using India as a case study. Mathematical Biosciences and Engineering, 2023, 20(4): 6237-6272. doi: 10.3934/mbe.2023269
    [8] Luyu Zhang, Zhaohua Zhang, Sen Pei, Qing Gao, Wei Chen . Quantifying the presymptomatic transmission of COVID-19 in the USA. Mathematical Biosciences and Engineering, 2024, 21(1): 861-883. doi: 10.3934/mbe.2024036
    [9] Yuto Omae, Yohei Kakimoto, Makoto Sasaki, Jun Toyotani, Kazuyuki Hara, Yasuhiro Gon, Hirotaka Takahashi . SIRVVD model-based verification of the effect of first and second doses of COVID-19/SARS-CoV-2 vaccination in Japan. Mathematical Biosciences and Engineering, 2022, 19(1): 1026-1040. doi: 10.3934/mbe.2022047
    [10] Shina D. Oloniiju, Olumuyiwa Otegbeye, Absalom E. Ezugwu . Investigating the impact of vaccination and non-pharmaceutical measures in curbing COVID-19 spread: A South Africa perspective. Mathematical Biosciences and Engineering, 2022, 19(1): 1058-1077. doi: 10.3934/mbe.2022049
  • The effective reproduction number, Rt, is a vital epidemic parameter utilized to judge whether an epidemic is shrinking, growing, or holding steady. The main goal of this paper is to estimate the combined Rt and time-dependent vaccination rate for COVID-19 in the USA and India after the vaccination campaign started. Accounting for the impact of vaccination into a discrete-time stochastic augmented SVEIR (Susceptible-Vaccinated-Exposed-Infectious-Recovered) model, we estimate the time-dependent effective reproduction number (Rt) and vaccination rate (ξt) for COVID-19 by using a low pass filter and the Extended Kalman Filter (EKF) approach for the period February 15, 2021 to August 22, 2022 in India and December 13, 2020 to August 16, 2022 in the USA. The estimated Rt and ξt show spikes and serrations with the data. Our forecasting scenario represents the situation by December 31, 2022 that the new daily cases and deaths are decreasing for the USA and India. We also noticed that for the current vaccination rate, Rt would remain greater than one by December 31, 2022. Our results are beneficial for the policymakers to track the status of the effective reproduction number, whether it is greater or less than one. As restrictions in these countries ease, it is still important to maintain safety and preventive measures.


    A disease outbreak (COVID-19) of an uncommon pneumonia triggered by a new coronavirus, SARS-CoV-2, appeared in Wuhan, China, in December 2019 [1], has instigated at least 631, 989, 826 confirmed cases, with 6, 578, 767 deaths in nearly 230 nations and territories by October 21, 2022 [2]. The COVID-19 crisis was acknowledged as a pandemic by the World Health Organization (WHO) on March 11, 2020. The earliest case and death in India were reported on January 30, 2020 and March 13, 2020, respectively [3]. In the early outbreak, pharmaceutical interventions, for instance, drugs and vaccination, were unavailable, thereafter controlling the pandemic greatly depends only on non-pharmaceutical interventions, such as lockdown, maintaining social distancing, contact tracing, testing, using face masks, etc [4,5,6,7]. However, in India, the vaccination campaign with a single and double dose was started on January 15, 2021 and February 13, 2021, respectively. The double-dose vaccination campaign started on December 13, 2020 in the USA [8].

    The estimation of the reproduction number of a disease is particularly important in modeling the transmission of infection as well as notifying and assessing control policies [9,10]. On the other hand, the instantaneous (or effective) reproduction number Rt exposes the limit of disease spread with the impact of an intervention or population immunity. Public health officials and policymakers use Rt to evaluate the efficacy of control measures and several other factors that influenced the disease transmission at certain points of time and to update policy accordingly. Rt estimates could be exercised to evaluate the effectiveness of control measures or as a near real-time indicator of epidemic progress. For these intents, estimates need to be precise and accurately signify uncertainties, and for near real-time scrutinizing, they also need to be timely. Consequently, Rt estimation is crucial for assessing the achievement of public measures. However, Rt estimation from available data offers numerous challenges, with crucial inferences for the interpretation of the course of the epidemic [11,12]. Though, the parameter assumptions and model structure makes the estimation of Rt sensitive [11]. Poor quality or unavailability of data, on the other hand, often impedes the utilization of several estimation methods, for instance, serial intervals of a disease that are typically required for the estimation of Rt [12,13,14,15].

    Specific hypotheses and data estimates are required for computing the exact value of Rt. Several methods are used to estimate the effective reproduction number and time-dependent rate in the literature. Cazelles et al. [16] utilized stochastic models for the transmission dynamics of a disease coupled with particle Markov Chain Monte Carlo Algorithm and estimated the time-dependent transmission rate. Nishiura et al. [17] discussed a likelihood-based method for the estimation of Rt from the data of early epidemic growth. Bettencourt and Ribeiro [18] estimated R0 and Rt by using the compartmental Susceptible-Infectious-Recovered (SIR) model and incidence data of H5N1 influenza in humans. Pollicott et al. [19] and Kong et al. [20] introduced an inverse method for epidemic models that extract the time-dependent transmission rate from the incidence or prevalence data. Wang et al. [21,22] developed an inverse method and estimated the time-dependent transmission rate and death rate using a generalized boosting model (GBM) and a mechanistic ordinary differential equation (ODE) model. Hasan et al. [23] developed a novel method to estimate the effective reproduction number based on the Kalman filter and a low pass filter method. The authors used a simple SIRD (Susceptible-Infectious-Recovered-Dead) model and augmented the model into a discrete-time stochastic model. This method is quite beneficial since it does not require serial intervals, which forms the process easier without falling the estimation quality.

    In this paper, we estimate the time-dependent effective reproduction number and vaccination rate using the method developed by Hasan et al. [23] for COVID-19 in the USA and India. We use an augmented SVEIR model and the data of daily new cases, cumulative cases, daily new deaths, cumulative deaths, and fully vaccinated individuals concerning COVID-19.

    We estimate the effective reproduction number, Rt, and time-dependent vaccination rate, denoted by ξt, by using a simple compartmental SVEIR model. Figure 1 shows the scheme of the model. Let us denote S,V,E,I, and R respectively as susceptible, vaccinated, exposed (not yet infectious), active/confirmed, and recovered compartment. Let N=S+V+E+I+R, where N denotes the total population.

    Figure 1.  Scheme of the SVEIR model (2.1).

    In the model (2.1), the susceptible individuals are vaccinated at rate ξt, which is time-dependent. βt signifies the average number of contacts per individual per unit time and is time-dependent due to interventions. Since the vaccine is imperfect, vaccinated individuals can also get the infection, but at a reduced rate, σβt, where 1σ characterizes the vaccine efficacy. The immunity acquired by vaccination wanes with time, and vaccinated individuals can become susceptible again at a rate ϕ. a stands for the transition rate of exposed individuals becoming infectious, α denotes the recovery rate of infectious individuals, and δ is the disease-induced death rate. γ represents the antibody waning rate since the immunity acquired by infection also wanes with time. Hence, the model is written in the following non-linear ordinary differential equations:

    dSdt=SNβtI+γRξtS+ϕV,dVdt=VNσβtI+ξtSϕV,dEdt=βtI(SN+σVN)aE,dIdt=aE(α+δ)I,dRdt=αIγR. (2.1)

    To use the method [23], we also need some more information about the Case Fatality Rate (CFR) and the average infectious time, Ti, and

    α=1CFRTi,δ=CFRTi. (2.2)

    For COVID-19, we consider Ti=14 [21], however it may vary from 1.5 to 30 days amongst distinct diseased persons [24]. CFR is assumed to be 1%.

    Covaxin and Covishield, two COVID-19 vaccines were advanced and being utilized in India. Bhatnagar et al. [25] studied that the vaccine efficacy of full (two doses) vaccination was 71% (95% CI: 57-81%) with Covaxin/BBV152 and with covishield/AZD1222, it was 85% (95% CI: 79-89%). The vaccine efficacy was highest at 94% (95% CI: 86-97%) for 6-8 weeks between two doses of Covishield and 93% (95% CI: 34-99%) of Covaxin. In the USA, the COVID-19 mRNA vaccines BNT162b2 (Pfizer-BioNTech) and mRNA-1273 (Moderna) COVID-19 vaccines have been completely permitted by the Food and Drug Administration (FDA) for individuals aged 18 years and older and individuals aged 16 years and older, respectively [26]. In clinical trials, mRNA based COVID-19 vaccines, BNT162b2 (Pfizer Inc, New York, USA; BioNTech Manufacturing GmbH, Mainz, Germany; Comirnaty) and mRNA-1273 (Moderna Inc, Cambridge, USA; Spikevax) were greatly effectual (95% and 94%, respectively) against symptomatic COVID-19 infection [27]. In our estimation, vaccine efficacy is to be assumed 95% and 85% for the USA and India, respectively.

    To compute the effective reproduction number, Rt, we can still apply the next generation matrix method [28,29]. According to Lemma 1 in [30], we define

    F=(0βt(SN+σVN)00),V=(a0aa+δ).

    Following [28,29], the effective reproduction number is defined as the spectral radius of the next generation matrix (FV1), i.e.,

    Rt=ρ(FV1)=βtα+δ(S(t)N+σV(t)N)βtα+δ. (2.3)

    The approximation is under the assumption that government intervention is taken at an early stage so that S(t)+σV(t)N. This is the case especially for the emerging diseases.

    We further augment the SVEIR model (2.1) by considering the following seven equations:

    dCdt=aE, (2.4)
    dDdt=aED, (2.5)
    dCDdt=δI, (2.6)
    dDDdt=δIDD, (2.7)
    dPdt=ξtS, (2.8)
    dRtdt=0, (2.9)
    dξtdt=0, (2.10)

    where the first equation takes into account the cumulative cases (C), second equation provides the daily number of new cases (D), third equation gives cumulative deaths (CD), fourth equation offers the daily number of new deaths (DD), fifth equation produces the cumulative number of vaccinated individuals (P), the sixth and seventh equations say that the effective reproduction number (Rt) and vaccination rate (ξt) are assumed to be piecewise constant functions with one day time interval jump.

    Further, by discretization and applying the forward Euler method, the discrete-time augmented SVEIR model is given as follows:

    S(l+1)=S(l)(1Δtξt(l)(a+δ)ΔtNRt(l)I(l))+γΔtR(l)+ϕΔtV(l),V(l+1)=V(l)(1ϕΔt(a+δ)σΔtNRt(l)I(l))+Δtξt(l)S(l),E(l+1)=E(l)(1aΔt)+(a+δ)ΔtNRt(l)I(l)(S(l)+σV(l),I(l+1)=I(l)(1(a+δ)Δt)+aΔE(l),R(l+1)=R(l)(1γΔt)+αΔtI(l),C(l+1)=C(l)+aΔtE(l),D(l+1)=D(l)(1Δt)+aΔtE(l),CD(l+1)=CD(l)+δΔtI(l),DD(l+1)=DD(l)(1Δt)+δΔtI(l),P(l+1)=P(l)+Δtξt(l)S(l),Rt(l+1)=Rt(l),ξt(l+1)=ξt(l). (2.11)

    We estimate the basic reproduction number, Rt, by using the cumulative cases, new daily cases, cumulative deaths and new daily deaths, and vaccination rate, ξt, by using the full (with two doses) vaccination data. The data has been collected from the World Health Organization (WHO) website https://covid19.who.int/ and https://ourworldindata.org/coronavirus on a daily basis. Since the frequency of the data could be once a day which is low, then by utilizing a modified Akima cubic Hermite interpolation, the new reported data could be interpolated and it fits with Δt time steps. The Δt time step is taken as 0.01 in our simulation, i.e., 100 times discretization within one day time interval. For simplicity, we outline the augmented state vector as follows:

    y(l+1)=(S(l+1)V(l+1)E(l+1)I(l+1)R(l+1)C(l+1)D(l+1)CD(l+1)DD(l+1)P(l+1)Rt(l+1)ξt(l+1)), (2.12)

    and the discrete time augmented SVEIR model (2.11) can be rewritten in the following form:

    y(l+1)=g(y(l))+v(l), (2.13)

    where g is the nonlinear expression of the equations in the right-hand side of the augmented SVEIR model (2.11) and v denotes the uncertainty to the inaccuracies in the model owing to interpretation in the modeling. The uncertainty is supposed to be a zero mean Gaussian white noise with known covariance QF. It is to make the computation simple since the real epidemic data generally follow Gamma distribution. QF, in practice, could be taken as a tuning parameter for the EKF. Hence, the model becomes in the form of a discrete-time stochastic augmented SVEIR model.

    New daily cases, cumulative cases, new daily deaths, cumulative deaths, and cumulative vaccinated individuals can be incorporated into the model including the ensuing output vector

    x(l+1)=Cy(l)+z(l), (2.14)

    where z signifies uncertainties owing to the incorrect testing outcomes. It is also supposed the uncertainties to be a zero mean Gaussian white noise with known covariance RF. Similar to QF, RF could also be taken as a tuning parameter. Ensuing the convenient data, the measurement/data matrix C is considered to be

    C=(000001000000000000100000000000010000000000001000000000000100). (2.15)

    A two-stage filtering approach: We use a two-stage filtering approach for the estimation of the time-dependent effective reproduction number, Rt, and vaccination rate, ξt. This method consists a low-pass filter and the EKF. The EKF is an expansion of Kalman filter (KF) for nonlinear systems. The KF is centered on Bayesian estimation and is an optimal linear filter. The EKF is established based on the linearization of the non-linear system around its estimate. Because of this linearization, the stability and optimality of the EKF cannot be ensured. However, the EKF may provide a fairly good estimation if the non-linearity is not very extreme. In the estimation process, the state variables, Rt and ξt are estimated by using the EKF under uncertainties in the number of new reported cases which could be a consequence of the delays in reporting.

    Let ˆy(l) be a vector state, estimated by the EKF. Operating the first-order Taylor series expansion to g at ˆy(l), which yields

    g(y(l))=g(ˆy(l))+Jg(ˆy(l))(y(l)ˆy(l)). (2.16)

    Here Jg(ˆy(l)) denotes the Jacobian matrix of g, specified by

    Jg(ˆy(l))=(J11(ˆy(l))ϕΔt0J14(ˆy(l))γΔt00000J111(ˆy(l))ˆS(l)Δtˆξt(l)ΔtJ22(ˆy(l))0J24(ˆy(l))000000J211(ˆy(l))ˆS(l)ΔtJ31(ˆy(l))J32(ˆy(l))1aΔtJ34(ˆy(l))000000J311(ˆy(l))000aΔt1(a+δ)Δt00000000000αΔt1γΔt000000000aΔt00100000000aΔt0001Δt00000000δΔt00010000000δΔt00001Δt000ˆξt(l)Δt0000000010ˆS(l)Δt000000000010000000000001), (2.17)

    with

    J11(ˆy(l))=1ˆξ(l)Δt(a+δ)ΔtNˆI(l)ˆRt(l),J14(ˆy(l))=(a+δ)ΔtNˆS(l)ˆRt(l),J111(ˆy(l))=(a+δ)ΔtNˆS(l)ˆI(l),J22(ˆy(l))=1ϕΔt(a+δ)σΔtNˆI(l)ˆRt(l),J24(ˆy(l))=(a+δ)σΔtNˆV(l)ˆRt(l),J211(ˆy(l))=(a+δ)σΔtNˆV(l)ˆI(l),J31(ˆy(l))=(a+δ)ΔtNˆI(l)ˆRt(l),J32(ˆy(l))=(a+δ)σΔtNˆI(l)ˆRt(l),J34(ˆy(l))=(a+δ)ΔtN(ˆS(l)+σˆV(l))ˆRt(l),J311(ˆy(l))=(a+δ)ΔtN(ˆS(l)+σˆV(l))ˆI(l).

    The EKF contains two stages: forecast and update. The model (2.11) is utilized to forecast the upcoming state and covariance and upgrade them after attaining measurement/new data. The EKF could be pondered as one of the straightforward dynamic Bayesian networks. EKF recursively computes the estimate of correct state values over time utilizing a mathematical process model and next measurements while recursive Bayesian estimation computes estimates of an unidentified probability density function over time utilizing a mathematical process model and incoming new data [31]. Let ˆy(m|n) signifies the estimation of y at time m considering observations up to and together with the time nm. The Kalman filter algorithm is given as follows.

    Forecast:

    ˆy(l+1|l)=g(ˆy(l|l)),p(l+1|l)=Jg(ˆy(l|l))p(l|l)Jg(ˆy(l|l))T+QF(l).

    Update:

    ˆx(l+1)=x(l+1)Cˆy(l+1|l),K(l+1)=p(l+1|l)CT(Cp(l+1|l)CT+RF(l))1,ˆy(l+1|l+1)=ˆy(l+1|l)+K(l+1)ˆx(l+1),p(l+1|l+1)=(IK(l+1)C)p(l+1|l),

    where p(l|l) signifies a posteriori estimate covariance matrix. In the step, "update", a low pass filter approach concerning a rational transfer function is utilized to detach short term fluctuation at time step l, and is specified by

    ˆx(l)=1xn(ˆy(l)+ˆy(l1)++ˆy(lxn+1)), (2.18)

    where xn is a window length along the data. We take xn=3/Δt for our case.

    To ensure the estimation quality, we compute a Relative Root Mean Square Error (RRMSE) between the reported and estimated cases. The RRMSE is expressed by

    RRMSE=1OdOdi=1||YiˆYi||2||Yi||2, (2.19)

    where Od denotes the total number of observed time in days and Y{C,D,CD,DD,P}.

    We illustrate the observed and estimated numbers of COVID-19 cases in India in Figure 2 and obtained a good agreement between the data and estimated numbers. We also plot the reported and estimated number of fully vaccinated individuals in Figure 3. In the estimation procedure, the observation and process covariance matrices are chosen as tuning parameters and are taken as RF=diag(10010511) and QF=diag(100101010555550.50.50.5), respectively. These tuning parameters are attained from error and trial and adopted such that RRMSE between the reported and estimated data are adequately small. For our case, the RRMSEs are given in Table 2. Here, we notice that the obtained RRMSEs are sufficiently small. The error could be reduced more by choosing distinct values of RF and QF.

    Figure 2.  Comparison between estimated and reported cases of cumulative cases (C), daily new cases (D), cumulative deaths (CD), and daily new deaths (DD) of COVID-19 during February 15, 2021 to August 22, 2022 in India. The green colored curve shows the prediction from August 23, 2022 to December 31, 2022.
    Figure 3.  Comparison between estimated and reported cases of full vaccinated individuals (P) of COVID-19 during February 15, 2021 to August 22, 2022 in India. The green colored curve shows the prediction from August 23, 2022 to December 31, 2022.
    Table 1.  Numerical values of model parameters.
    Parameters Numerical values for India Source Numerical values for the USA Source
    1σ 0.85 [25] 0.95 [27]
    ξt Figure 5 Estimated Figure 9 Estimated
    ϕ 1/180 day1 [32] 1/180 day1 [32]
    a 1/2 day1 [21] 1/2 day1 [21]
    α 0.0627 1CFRTi 0.0627 1CFRTi
    γ 1/180 day1 [32] 1/180 day1 [32]
    δ 1.8534e-06 CFRTi 9.2978e-06 CFRTi
    Rt Figure 4 Estimated Figure 8 Estimated

     | Show Table
    DownLoad: CSV
    Figure 4.  Estimated time-dependent effective reproduction number (Rt) for COVID-19 in India. The green colored curve shows the prediction from August 23, 2022 to December 31, 2022.
    Figure 5.  Estimated time-dependent vaccination rate (ξt) for COVID-19 in India. The green colored curve shows the prediction from August 23, 2022 to December 31, 2022.
    Table 2.  RRMSE between the reported and estimated data for the USA and India.
    Cases RRMSE for the USA RRMSE for India
    Cumulative cases (C) 1.0876e-05 7.0211e-08
    Daily new cases (D) 1.9846e-04 8.5272e-05
    Cumulative deaths (CD) 4.5707e-06 2.5711e-08
    Daily deaths (DD) 0.0012 0.0125
    Vaccinated individuals (P) 6.1981e-04 0.1259
    Total RRMSE 0.0021 0.1385

     | Show Table
    DownLoad: CSV

    For the USA, the observed and estimated COVID-19 and vaccinated cases are plotted in Figure 6 and 7, respectively. The observation and process covariance matrices are chosen as RF=diag(1000100501010) and QF=diag(100101010555550.50.50.5), respectively. The RRMSEs for the USA are also given in Table 2, which are relatively smaller than India.

    Figure 6.  Comparison between estimated and reported cases of cumulative cases (C), daily new cases (D), cumulative deaths (CD), and daily new deaths (DD) of COVID-19 during December 13, 2020 to August 16, 2022 in the USA. The green colored curve shows the prediction from August 17, 2022 to December 31, 2022.
    Figure 7.  Comparison between estimated and reported cases of full vaccinated individuals (P) of COVID-19 during December 13, 2020 to August 16, 2022 in the USA. The green colored curve shows the prediction from August 17, 2022 to December 31, 2022.

    We finally plot the time-dependent effective reproduction number Rt and vaccination rate ξt for India in Figure 4 and 5, respectively, and for the USA in Figure 8 and 9, respectively. We do not take average out of the new cases data, but consider the likelihood estimation of a new case at one day to depend also on the estimation of the previous three days. The estimated curves of Rt and ξt for the USA and India are also showing spikes and serrations with data.

    Figure 8.  Estimated time-dependent effective reproduction number (Rt) for COVID-19 in the USA. The green colored curve shows the prediction from August 17, 2022 to December 31, 2022.
    Figure 9.  Estimated time-dependent vaccination rate (ξt) for COVID-19 in the USA. The green colored curve shows the prediction from August 17, 2022 to December 31, 2022.

    We also provide the short-term forecast for India from August 23, 2022 to December 31, 2022. The forecasting scenario is shown in Figures 2, 3, 4, and 5 in green colored curves. With the current scenario, the prediction shows that the new daily cases and deaths are steadily decreasing in India. However, the effective reproduction number will be greater than one by December 31, 2022.

    The predictions for the USA from August 17, 2022 to December 31, 2022 are also provided in Figures 6, 7, 8 and 9 in green colored curves. These results also show that the number of new daily cases and deaths is decreasing. From Figure 8, we observe that the effective reproduction number will be greater than one by December 31, 2022.

    Several mathematical models and approaches have been evolved and utilized to estimate various types of time-dependent rates and reproduction numbers. Estimating the time-dependent vaccination rate with the effective reproduction number for COVID-19 progress is essential for making public health decisions to regulate the pandemic. We here estimate the time-dependent effective reproduction number Rt and vaccination rate ξt based on model (2.11) with respect to the COVID-19 data in the USA and India by using a low pass filter approach and EKF developed by Hasan et al. [23]. Our estimated Rt and ξt chase the dynamics of the model, showing the spikes and serrations with data. The prediction results show that the new daily cases and deaths are decreasing in the USA and India. We observed that the effective reproduction number would be greater than one by December 31, 2022 in both countries. Which implies that it is still necessary to maintain safety and preventive measures to control COVID-19. Our results are beneficial for the policy/health makers to track the status of the effective reproduction number that whether it is greater or less than one.

    The inverse method, given by Pollicott et al. [19] and Kong et al. [20], needs an explicit formula to estimate the time-dependent rates. In comparison, the method we used in this work is more straightforward and has various advantages. From the modeling perspective, the time-dependent effective reproduction number and vaccination rate follow the dynamics according to the data. This method does not need serial intervals' information. In this case, the provided time series data have drastic changes or instead do not have many changes. The resulting time-dependent rates show the same serrations and spikes. Consequently, the latest information could be elaborated from the data dynamics.

    Various rates in epidemiological models for contagious diseases vary significantly over time. It is further feasible to estimate other time-dependent rates, such as immunity waning rate and vaccine efficacy, that decrease over time. The model we utilized in this work could also be applied to COVID-19 transmission dynamics in any other country, specifically when vaccination is employed. We have not considered reporting ratio in our model, however, by considering it, time-varying estimates of COVID-19 infection will be observed in future. Using an extended multi-strain SVEIR model (including multiple infectious compartments with different strains), estimation of the strain-specific effective reproduction number will be addressed in the future.

    The research work of Sarita Bugalia is supported by the Council of Scientific & Industrial Research (CSIR), India [File No. 09/1131(0025)/2018-EMR-I]. The research work of Jai Prakash Tripathi is supported by the Science and Engineering Research Board (SERB), India [File No. ECR/2017/002786]. The research work of Hao Wang is partially supported by the Natural Sciences and Engineering Research Council of Canada (NSERC). We are highly thankful to all the anonymous reviewers and editor for their insightful comments and suggestions, which helped us to improve the manuscript considerably.

    The authors declare there is no conflict of interest.


    [1] Q. Li, An outbreak of NCIP (2019-nCoV) infection in China - Wuhan, Hubei province, 2019–2020, China CDC Weekly, 2 (2020), 79.
    [2] Worldometer, Corornvirus Cases. Available from: https://www.worldometers.info/coronavirus/.
    [3] World Health Organization. Available from: https://covid19.who.int/region/searo/country/in.
    [4] S. Jamshidi, M. Baniasad, D. Niyogi, Global to USA county scale analysis of weather, urban density, mobility, homestay, and mask use on COVID-19, Int. J. Environ. Res. Public Health, 17 (2020), 7847. https://doi.org/10.3390/ijerph17217847 doi: 10.3390/ijerph17217847
    [5] D. Milošević, A. Middel, S. Savić, J. Dunjić, K. Lau, R. Stojsavljević, Mask wearing behavior in hot urban spaces of Novi Sad during the COVID-19 pandemic, Sci. Total Environ., 815 (2022), 152782. https://doi.org/10.1016/j.scitotenv.2021.152782 doi: 10.1016/j.scitotenv.2021.152782
    [6] X. Ma, X. F. Luo, L. Li, Y. Li, G.Q. Sun, The influence of mask use on the spread of COVID-19 during pandemic in New York City, Results Phys., 34 (2022), 105224. https://doi.org/10.1016/j.rinp.2022.105224 doi: 10.1016/j.rinp.2022.105224
    [7] J. K. Asamoah, E. Okyere, A. Abidemi, S. E. Moore, G. Q. Sun, Z. Jin, et al., Optimal control and comprehensive cost-effectiveness analysis for COVID-19, Results Phys., 33 (2022), 105177. https://doi.org/10.1016/j.rinp.2022.105177 doi: 10.1016/j.rinp.2022.105177
    [8] Our World in Data. Available from: https://ourworldindata.org/coronavirus.
    [9] M. Baniasad, M. G. Mofrad, B. Bahmanabadi, S. Jamshidi, COVID-19 in Asia: Transmission factors, re-opening policies, and vaccination simulation, Environ. Res., 202 (2021), 111657. https://doi.org/10.1016/j.envres.2021.111657 doi: 10.1016/j.envres.2021.111657
    [10] S. N. Zisad, M. S. Hossain, M. S. Hossain, K. Andersson, An integrated neural network and SEIR model to predict Covid-19, Algorithms, 14 (2021), 94. https://doi.org/10.3390/a14030094 doi: 10.3390/a14030094
    [11] P. L. Delamater, E. J. Street, T. F. Leslie, Y. T. Yang, K. H. Jacobsen, Complexity of the basic reproduction number (R0), Emerg. Infect. Dis., 25 (2019), 1. https://doi.org/10.3201/eid2501.171901 doi: 10.3201/eid2501.171901
    [12] C. Fraser, Estimating individual and household reproduction numbers in an emerging epidemic, PloS One, 2 (2007), e758. https://doi.org/10.1371/journal.pone.0000758 doi: 10.1371/journal.pone.0000758
    [13] J. Wallinga, P. Teunis, Different epidemic curves for severe acute respiratory syndrome reveal similar impacts of control measures, Am. J. Epidemiol., 160 (2004), 509–516. https://doi.org/10.1093/aje/kwh255 doi: 10.1093/aje/kwh255
    [14] S. Cauchemez, P. Y. Boëlle, C. A. Donnelly, N. M. Ferguson, G. Thomas, G. M. Leung, et al., Real-time estimates in early detection of SARS, Emerg. Infect. Dis., 12 (2006), 110. https://doi.org/10.3201/eid1201.050593 doi: 10.3201/eid1201.050593
    [15] L. F. White, M. Pagano, Transmissibility of the influenza virus in the 1918 pandemic, PLoS One, 3 (2008), e1498. https://doi.org/10.1371/journal.pone.0001498 doi: 10.1371/journal.pone.0001498
    [16] B. Cazelles, C. Champagne, J. Dureau, Accounting for non-stationarity in epidemiology by embedding time-varying parameters in stochastic models, PLoS Comput. Biol., 14 (2018), e1006211. https://doi.org/10.1371/journal.pcbi.1006211 doi: 10.1371/journal.pcbi.1006211
    [17] H. Nishiura, G. Chowell, M. Safan, C. Castillo-Chavez, Pros and cons of estimating the reproduction number from early epidemic growth rate of influenza A (H1N1) 2009, Theor. Biol. Medical Model., 7 (2010), 1–13. https://doi.org/10.1186/1742-4682-7-1 doi: 10.1186/1742-4682-7-1
    [18] L. M. Bettencourt, R. M. Ribeiro, Real time bayesian estimation of the epidemic potential of emerging infectious diseases, PloS One, 3 (2008), e2185. https://doi.org/10.1371/journal.pone.0002185 doi: 10.1371/journal.pone.0002185
    [19] M. Pollicott, H. Wang, H. Weiss, Extracting the time-dependent transmission rate from infection data via solution of an inverse ODE problem, J. Biol. Dyn., 6 (2012), 509–523. https://doi.org/10.1080/17513758.2011.645510 doi: 10.1080/17513758.2011.645510
    [20] J. D. Kong, C. Jin, H. Wang, The inverse method for a childhood infectious disease model with its application to pre-vaccination and post-vaccination measles data, Bull. Math. Biol., 77 (2015), 2231–2263. https://doi.org/10.1007/s11538-015-0121-5 doi: 10.1007/s11538-015-0121-5
    [21] X. Wang, H. Wang, P. Ramazi, K. Nah, M. Lewis, A hypothesis-free bridging of disease dynamics and non-pharmaceutical policies, Bull. Math. Biol., 84 (2022), 1–23. https://doi.org/10.1007/s11538-022-01012-8 doi: 10.1007/s11538-022-01012-8
    [22] X. Wang, H. Wang, P. Ramazi, K. Nah, M. Lewis, From policy to prediction: Forecasting COVID-19 dynamics under imperfect vaccination, Bull. Math. Biol., 84 (2022), 1–19. https://doi.org/10.1007/s11538-022-01047-x doi: 10.1007/s11538-022-01047-x
    [23] A. Hasan, H. Susanto, V. Tjahjono, R. Kusdiantara, E. Putri, N. Nuraini, et al., A new estimation method for COVID-19 time-varying reproduction number using active cases, Sci. Rep., 12 (2022), 1–9. https://doi.org/10.1038/s41598-022-10723-w doi: 10.1038/s41598-022-10723-w
    [24] N. Kumar, A. AbdulRahman, S. AlAli, S. Otoom, S. L. Atkin, M. AlQahtani, Time till viral clearance of severe acute respiratory syndrome coronavirus 2 is similar for asymptomatic and non-critically symptomatic individuals, Front. Med., 8 (2021), 616927. https://doi.org/10.3389/fmed.2021.616927 doi: 10.3389/fmed.2021.616927
    [25] T. Bhatnagar, S. Chaudhuri, M. Ponnaiah, P. D. Yadav, R. Sabarinathan, R. R. Sahay, et al., Effectiveness of BBV152/Covaxin and AZD1222/Covishield vaccines against severe COVID-19 and B. 1.617. 2/Delta variant in India, Int. J. Infect. Dis., 122 (2022), 693–702. https://doi.org/10.1016/j.ijid.2022.07.033 doi: 10.1016/j.ijid.2022.07.033
    [26] COVID-19: Vaccines. Available from: https://www.uptodate.com/contents/covid-19-vaccines#disclaimerContent.
    [27] H. Chemaitelly, P. Tang, M. R. Hasan, S. AlMukdad, H. M. Yassine, F. M. Benslimane, et al., Waning of BNT162b2 vaccine protection against SARS-CoV-2 infection in Qatar, N. Engl. J. Med., 385 (2021), e83. https://doi.org/10.1056/NEJMoa2114114 doi: 10.1056/NEJMoa2114114
    [28] O. Diekmann, J. A. Heesterbeek, J. A. Metz, On the definition and the computation of the basic reproduction ratio R0 in models for infectious diseases in heterogeneous populations, J. Math. Biol., 28 (1990), 365–382. https://doi.org/10.1007/BF00178324 doi: 10.1007/BF00178324
    [29] C. Mitchell, C. Kribs, Invasion reproductive numbers for periodic epidemic models, Infect. Dis. Model., 4 (2019), 124–141. https://doi.org/10.1016/j.idm.2019.04.002 doi: 10.1016/j.idm.2019.04.002
    [30] P. Van den Driessche, J. Watmough, Reproduction numbers and sub-threshold endemic equilibria for compartmental models of disease transmission, Math. Biosci., 180 (2002), 29–48. https://doi.org/10.1016/S0025-5564(02)00108-6 doi: 10.1016/S0025-5564(02)00108-6
    [31] C. Masreliez, R. Martin, Robust Bayesian estimation for the linear model and robustifying the Kalman filter, IEEE Trans. Automat. Contr., 22 (1977), 361–371. https://doi.org/10.1109/TAC.1977.1101538 doi: 10.1109/TAC.1977.1101538
    [32] M.M. Chowdhury, M.R. Islam, M.S. Hossain, N. Tabassum, A. Peace, Incorporating the mutational landscape of SARS-COV-2 variants and case-dependent vaccination rates into epidemic models, Infect. Dis. Model., 7 (2022), 75–82. https://doi.org/10.1016/j.idm.2022.02.003 doi: 10.1016/j.idm.2022.02.003
  • This article has been cited by:

    1. Zuo‐jing Yin, Han Xiao, Stuart McDonald, Vladimir Brusic, Tian‐yi Qiu, Dynamically adjustable SVEIR(MH) model of multiwave epidemics: Estimating the effects of public health measures against COVID‐19, 2023, 95, 0146-6615, 10.1002/jmv.29301
    2. Liaofu Luo, Jun Lv, Mathematical Modelling of Virus Spreading in COVID-19, 2023, 15, 1999-4915, 1788, 10.3390/v15091788
    3. Yunbo Tu, Xinzhu Meng, A reaction–diffusion epidemic model with virus mutation and media coverage: Theoretical analysis and numerical simulation, 2023, 214, 03784754, 28, 10.1016/j.matcom.2023.06.023
    4. Arjun Kumar, Uma S. Dubey, Balram Dubey, Modeling the effect of vaccinations, hospital beds, and treatments on the dynamics of infectious disease with delayed optimal control and sensitivity analysis, 2024, 139, 2190-5444, 10.1140/epjp/s13360-024-05508-1
    5. Toshiaki Takayanagi, Estimating parameter values and initial states of variables in a mathematical model of coronavirus disease 2019 epidemic wave using the least squares method, Visual Basic for Applications, and Solver in Microsoft Excel, 2023, 4, 26669900, 100111, 10.1016/j.cmpbup.2023.100111
    6. Sarita Bugalia, Jai Prakash Tripathi, Hao Wang, Mutations make pandemics worse or better: modeling SARS-CoV-2 variants and imperfect vaccination, 2024, 88, 0303-6812, 10.1007/s00285-024-02068-x
    7. May Anne E. Mata, Rey Audie S. Escosio, El Veena Grace A. Rosero, Jhunas Paul T. Viernes, Loreniel E. Anonuevo, Bryan S. Hernandez, Joel M. Addawe, Rizavel C. Addawe, Carlene P.C. Pilar-Arceo, Victoria May P. Mendoza, Aurelio A. de los Reyes, Analyzing the dynamics of COVID-19 transmission in select regions of the Philippines: A modeling approach to assess the impact of various tiers of community quarantines, 2024, 10, 24058440, e39330, 10.1016/j.heliyon.2024.e39330
    8. Abu Zobayer, Mohammad Sharif Ullah, K. M. Ariful Kabir, A cyclic behavioral modeling aspect to understand the effects of vaccination and treatment on epidemic transmission dynamics, 2023, 13, 2045-2322, 10.1038/s41598-023-35188-3
    9. Shimelis Bekele Zerefe, Tigabu Kasie Ayele, Surafel Luleseged Tilahun, Mehmet Ünver, Mathematical Modeling of COVID‐19 Disease Dynamics With Contact Tracing: A Case Study in Ethiopia, 2024, 2024, 1110-757X, 10.1155/2024/5556734
    10. Jayashree Anandakumar, Kuralayanapalya Puttahonnappa Suresh, Archana Veeranagouda Patil, Chethan A. Jagadeesh, Sushma Bylaiah, Sharanagouda S. Patil, Divakar Hemadri, Comprehensive Spatial-Temporal and Risk Factor Insights for Optimizing Livestock Anthrax Vaccination Strategies in Karnataka, India, 2024, 12, 2076-393X, 1081, 10.3390/vaccines12091081
    11. Sarita Bugalia, Jai Prakash Tripathi, Assessing potential insights of an imperfect testing strategy: Parameter estimation and practical identifiability using early COVID-19 data in India, 2023, 123, 10075704, 107280, 10.1016/j.cnsns.2023.107280
    12. Gaurang Sharma, Amit Sharma, Nishant Parmar, A delay differential equation model on covid-19 with vaccination strategy, 2024, 58, 0399-0559, 4093, 10.1051/ro/2024147
    13. Zafer Bekiryazici, Ayhan Önen, Analyzing the stochastic dynamics of COVID-19 waves in Turkey using real data and piecewise sinusoidal functions, 2024, 12, 2195-268X, 2830, 10.1007/s40435-024-01420-9
    14. François M. Castonguay, Brian F. Borah, Seonghye Jeon, Gabriel Rainisch, Patsy Kelso, Bishwa B. Adhikari, Daniel J. Daltry, Leah S. Fischer, Bradford Greening, Emily B. Kahn, Gloria J. Kang, Martin I. Meltzer, The public health impact of COVID-19 variants of concern on the effectiveness of contact tracing in Vermont, United States, 2024, 14, 2045-2322, 10.1038/s41598-024-68634-x
    15. S. Swetha, S. Sindu Devi, K. Kannan, Optimal Control Strategies for COVID-19 Using SEIQR Mathematical Model, 2024, 0369-8203, 10.1007/s40010-024-00898-4
    16. Vikram Singh, Shikha Kapoor, Sandeep kumar Gupta, Sandeep Sharma, Modelling the leadership role of police in controlling COVID-19, 2024, 12, 2544-7297, 10.1515/cmb-2024-0010
    17. Svetozar Margenov, Nedyu Popivanov, Tsvetan Hristov, Veneta Koleva, Computing the COVID-19 Basic and Effective Reproduction Numbers Using Actual Data: SEIRS Model with Vaccination and Hospitalization, 2024, 12, 2227-7390, 3998, 10.3390/math12243998
    18. Yutao Yan, Shuzhen Yu, Zhiyong Yu, Haijun Jiang, Hui Wang, Global dynamics of delayed discrete-time SEIR negative information propagation model with multi-platform and cross-transmission mechanism, 2025, 10075704, 108591, 10.1016/j.cnsns.2025.108591
  • Reader Comments
  • © 2023 the Author(s), licensee AIMS Press. This is an open access article distributed under the terms of the Creative Commons Attribution License (http://creativecommons.org/licenses/by/4.0)
通讯作者: 陈斌, bchen63@163.com
  • 1. 

    沈阳化工大学材料科学与工程学院 沈阳 110142

  1. 本站搜索
  2. 百度学术搜索
  3. 万方数据库搜索
  4. CNKI搜索

Metrics

Article views(2611) PDF downloads(122) Cited by(18)

Figures and Tables

Figures(9)  /  Tables(2)

Other Articles By Authors

/

DownLoad:  Full-Size Img  PowerPoint
Return
Return

Catalog