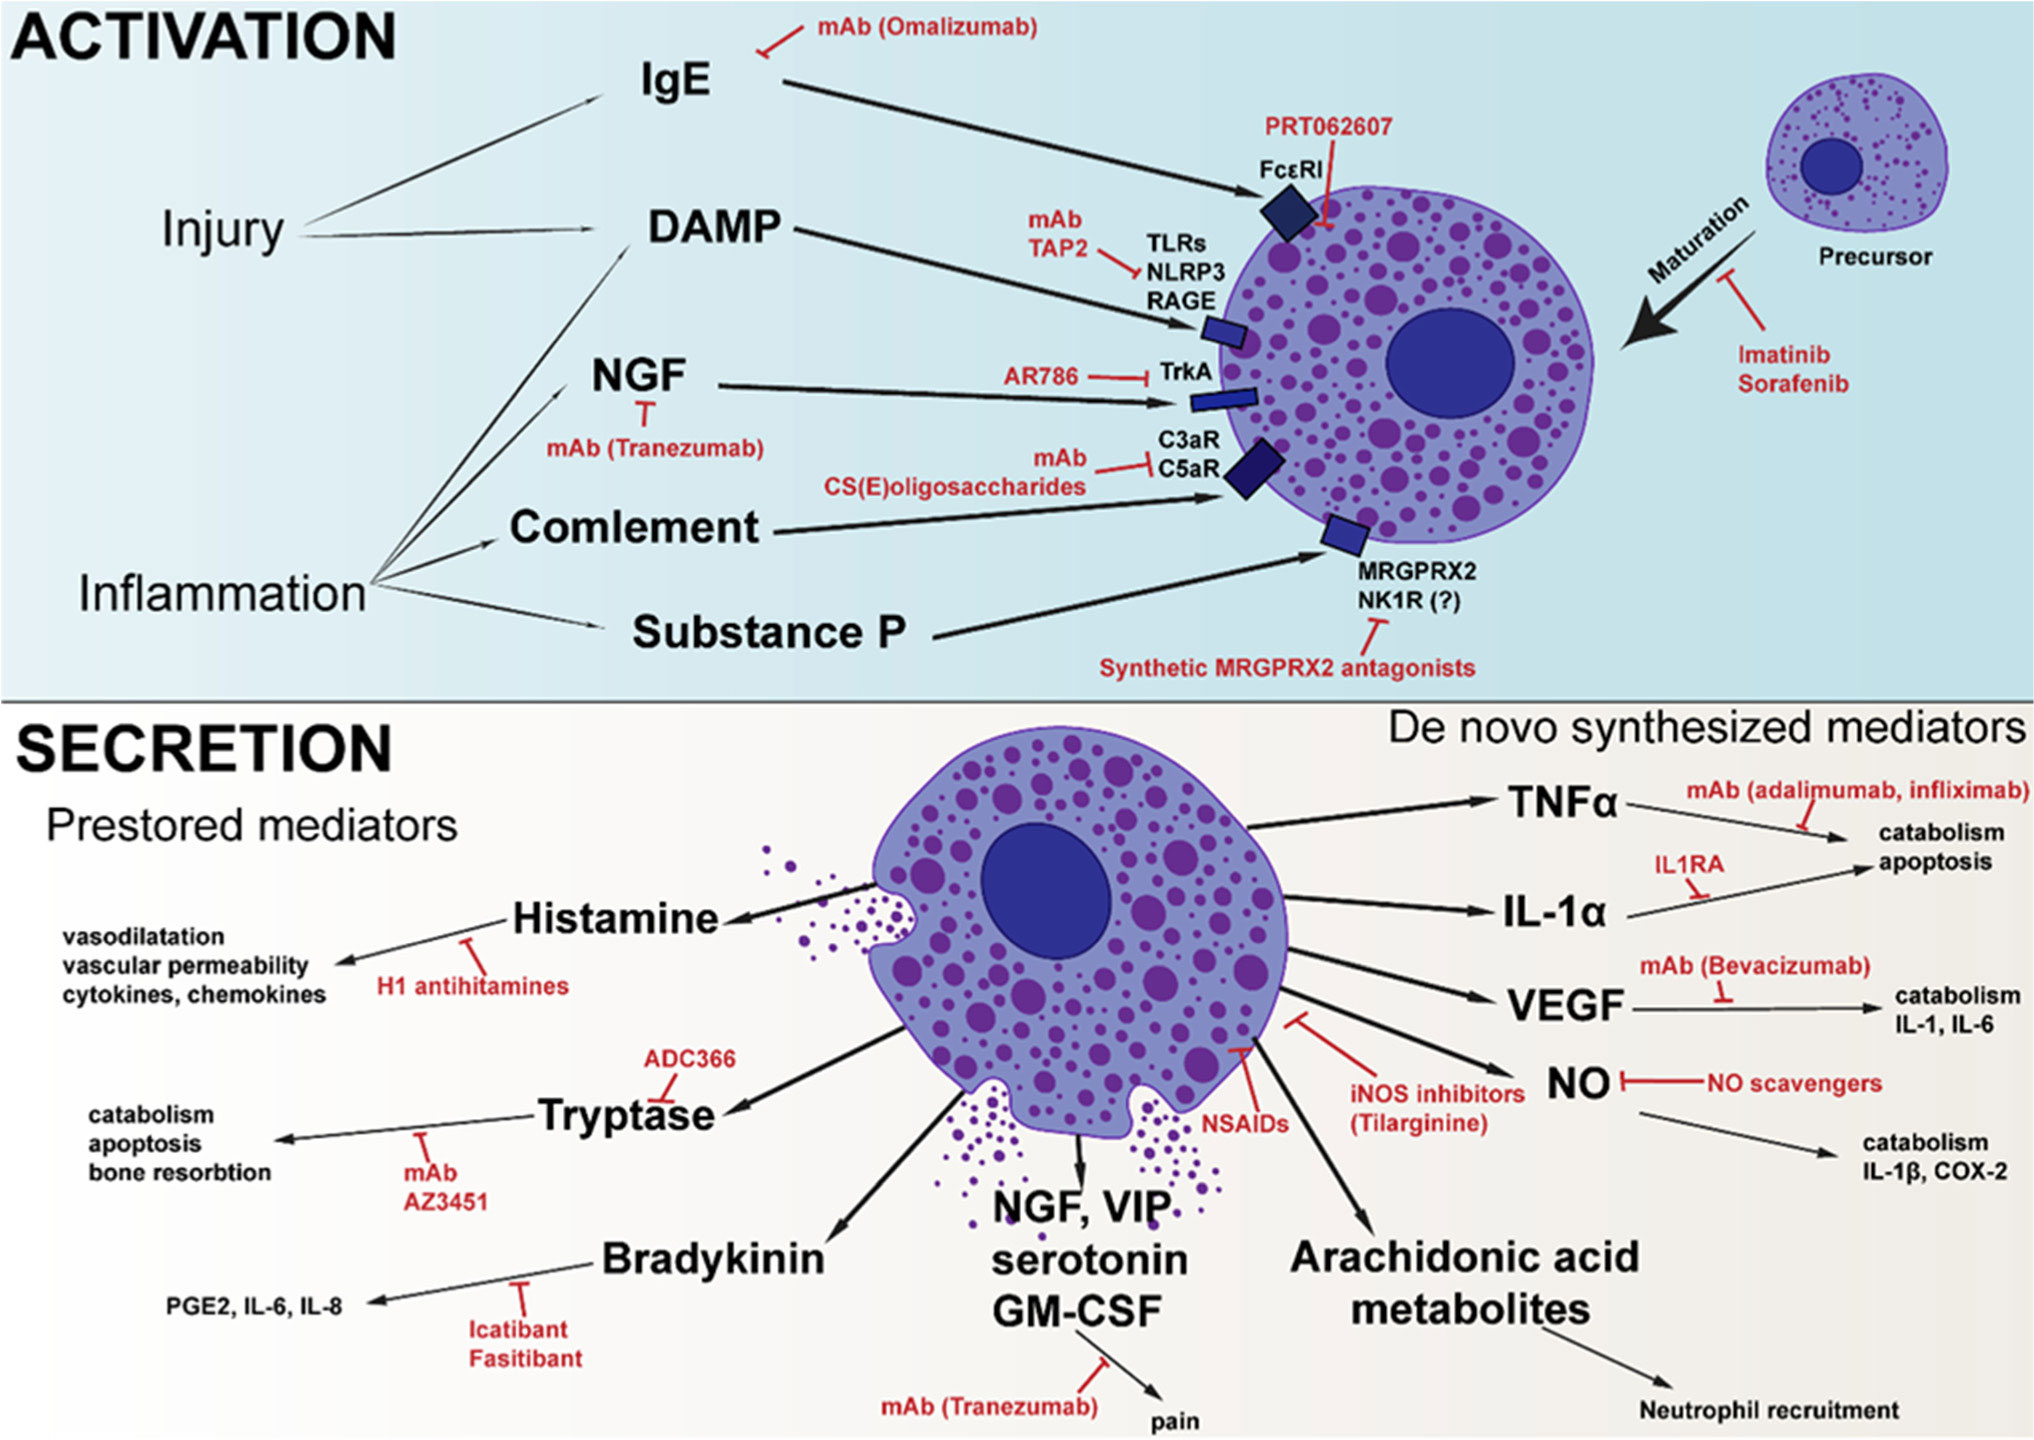
Mast cells are best known for their involvement in the pathogenesis of allergic reactions and inflammation. Due to the wide variety of activation methods and the various mediators that mast cells can synthesize and store, they can regulate all stages of the inflammatory process. There are a large amount of data describing the role of mast cells in the development of autoimmune rheumatoid arthritis, but their role in the development of inflammatory traumatic osteoarthritis remains poorly described. However, non-autoimmune cartilage damage is the main reason for joint replacement surgeries. As important regulators of the inflammatory process, mast cells could be an interesting target for the treatment of osteoarthritis. Herein, we summarize the knowledge about the role of mast cells in the pathogenesis of osteoarthritis and outline various approaches that, to varying degrees, seem promising for the correction of the disease.
Citation: Anastasiia D. Kurenkova, Peter S. Timashev. Mast cells: A dark horse in osteoarthritis treatment[J]. AIMS Allergy and Immunology, 2022, 6(4): 228-247. doi: 10.3934/Allergy.2022017
Mast cells are best known for their involvement in the pathogenesis of allergic reactions and inflammation. Due to the wide variety of activation methods and the various mediators that mast cells can synthesize and store, they can regulate all stages of the inflammatory process. There are a large amount of data describing the role of mast cells in the development of autoimmune rheumatoid arthritis, but their role in the development of inflammatory traumatic osteoarthritis remains poorly described. However, non-autoimmune cartilage damage is the main reason for joint replacement surgeries. As important regulators of the inflammatory process, mast cells could be an interesting target for the treatment of osteoarthritis. Herein, we summarize the knowledge about the role of mast cells in the pathogenesis of osteoarthritis and outline various approaches that, to varying degrees, seem promising for the correction of the disease.

| [1] | Moon TC, Befus AD, Kulka M (2014) Mast cell mediators: Their differential release and the secretory pathways involved. Front Immunol 5: 569. https://doi.org/10.3389/fimmu.2014.00569 |
| [2] |
Theoharides TC, Kempuraj D, Tagen M, et al. (2007) Differential release of mast cell mediators and the pathogenesis of inflammation. Immunol Rev 217: 65-78. https://doi.org/10.1111/j.1600-065X.2007.00519.x 
|
| [3] |
Abraham SN, St John AL (2010) Mast cell-orchestrated immunity to pathogens. Nat Rev Immunol 10: 440-452. https://doi.org/10.1038/nri2782
|
| [4] | He Y, Li Z, Alexander PG, et al. (2020) Pathogenesis of osteoarthritis: Risk factors, regulatory pathways in chondrocytes, and experimental models. Biology (Basel) 9: 1-32. https://doi.org/10.3390/biology9080194 |
| [5] | Chow YY, Chin KY (2020) The role of inflammation in the pathogenesis of osteoarthritis. Mediators Inflamm 2020: 8293921. https://doi.org/10.1155/2020/8293921 |
| [6] |
Sokolove J, Lepus CM (2013) Role of inflammation in the pathogenesis of osteoarthritis: Latest findings and interpretations. Ther Adv Musculoskelet Dis 5: 77-94. https://doi.org/10.1177/1759720X12467868
|
| [7] |
Dean G, Hoyland JA, Denton J, et al. (1993) Mast cells in the synovium and synovial fluid in osteoarthrhis. Rheumatology 32: 671-675. https://doi.org/10.1093/rheumatology/32.8.671
|
| [8] |
Wang Q, Lepus CM, Raghu H, et al. (2019) IgE-mediated mast cell activation promotes inflammation and cartilage destruction in osteoarthritis. Elife 8: e39905. https://doi.org/10.7554/eLife.39905
|
| [9] |
Dan J, Izumi M, Habuchi H, et al. (2021) A novel mice model of acute flares in osteoarthritis elicited by intra-articular injection of cultured mast cells. J Exp Orthop 8: 75. https://doi.org/10.1186/s40634-021-00391-6
|
| [10] |
Sellam J, Berenbaum F (2013) Is osteoarthritis a metabolic disease?. Joint Bone Spine 80: 568-573. https://doi.org/10.1016/j.jbspin.2013.09.007
|
| [11] |
de Lange-Brokaar BJE, Kloppenburg M, Andersen SN, et al. (2016) Characterization of synovial mast cells in knee osteoarthritis: Association with clinical parameters. Osteoarthr Cartilage 24: 664-671. https://doi.org/10.1016/j.joca.2015.11.011
|
| [12] |
Farinelli L, Aquili A, Mattioli-Belmonte M, et al. (2022) Synovial mast cells from knee and hip osteoarthritis: histological study and clinical correlations. J Exp Orthop 9: 13. https://doi.org/10.1186/s40634-022-00446-2
|
| [13] | Ceponis A, Konttinen YT, Takagi M, et al. (1998) Expression of stem cell factor (SCF) and SCF receptor (c-kit) in synovial membrane in arthritis: correlation with synovial mast cell hyperplasia and inflammation. J Rheumatol 25: 2304-2314. |
| [14] |
Dahlin JS, Hallgren J (2015) Mast cell progenitors: Origin, development and migration to tissues. Mol Immunol 63: 9-17. https://doi.org/10.1016/j.molimm.2014.01.018
|
| [15] |
Gözel N, Çakirer M, Karataş A, et al. (2018) Sorafenib reveals anti-arthritic potentials in collagen induced experimental arthritis model. Arch Rheumatol 33: 309. https://doi.org/10.5606/ArchRheumatol.2018.6652
|
| [16] |
Kulkarni P, Harsulkar A, Märtson AG, et al. (2022) Mast cells differentiated in synovial fluid and resident in osteophytes exalt the inflammatory pathology of osteoarthritis. Int J Mol Sci 2022: 541. https://doi.org/10.3390/ijms23010541
|
| [17] | Aquili A, Farinelli L, Bottegoni C, et al. (2017) The effect of anti-IgE therapy in knee osteoarthritis: a pilot observational study. J Biol Regul Homeost Agents 31: 1-5. |
| [18] |
Theoharides TC, Alysandratos KD, Angelidou A, et al. (2012) Mast cells and inflammation. Biochim Biophys Acta Mol Cell Res 1822: 21-33. https://doi.org/10.1016/j.bbadis.2010.12.014
|
| [19] | Bax HJ, Keeble AH, Gould HJ (2012) Cytokinergic IgE action in mast cell activation. Front Immunol 3: 229. https://doi.org/10.3389/fimmu.2012.00229 |
| [20] |
Park S, Choi NK (2020) Association between serum immunoglobulin E levels and knee osteoarthritis in Korean adults. Osteoarthr Cartilage 28: 462-467. https://doi.org/10.1016/j.joca.2020.02.830
|
| [21] |
Nishioka M, Ioi H, Matsumoto R, et al. (2008) TMJ osteoarthritis/osteoarthrosis and immune system factors in a Japanese sample. Angle Orthod 78: 793-798. https://doi.org/10.2319/091407-438
|
| [22] |
Riegger J, Brenner RE (2020) Pathomechanisms of posttraumatic osteoarthritis: chondrocyte behavior and fate in a precarious environment. Int J Mol Sci 21: 1560. https://doi.org/10.3390/ijms21051560
|
| [23] |
Foell D, Wittkowski H, Roth J (2007) Mechanisms of disease: A ‘DAMP’ view of inflammatory arthritis. Nat Clin Pract Rheumatol 3: 382-390. https://doi.org/10.1038/ncprheum0531
|
| [24] |
Sandig H, Bulfone-Paus S (2012) TLR signaling in mast cells: common and unique features. Front Immunol 3: 185. https://doi.org/10.3389/fimmu.2012.00185
|
| [25] |
Gondokaryono SP, Ushio H, Niyonsaba F, et al. (2007) The extra domain A of fibronectin stimulates murine mast cells via Toll-like receptor 4. J Leukocyte Biol 82: 657-665. https://doi.org/10.1189/jlb.1206730
|
| [26] |
Park H, Hong J, Yin Y, et al. (2020) TAP2, a peptide antagonist of Toll-like receptor 4, attenuates pain and cartilage degradation in a monoiodoacetate-induced arthritis rat model. Sci Rep 10: 1-13. https://doi.org/10.1038/s41598-020-74544-5
|
| [27] |
Flannery CR, Zollner R, Corcoran C, et al. (2009) Prevention of cartilage degeneration in a rat model of osteoarthritis by intraarticular treatment with recombinant lubricin. Arthritis Rheum 60: 840-847. https://doi.org/10.1002/art.24304
|
| [28] |
Alquraini A, Garguilo S, D'Souza G, et al. (2015) The interaction of lubricin/proteoglycan 4 (PRG4) with Toll-like receptors 2 and 4: an anti-inflammatory role of PRG4 in synovial fluid. Arthritis Res Ther 17: 1-12. https://doi.org/10.1186/s13075-015-0877-x
|
| [29] |
Sick E, Brehin S, André P, et al. (2010) Advanced glycation end products (AGEs) activate mast cells. Brit J Pharmacol 161: 442-455. https://doi.org/10.1111/j.1476-5381.2010.00905.x
|
| [30] |
Swanson KV, Deng M, Ting JPY (2019) The NLRP3 inflammasome: molecular activation and regulation to therapeutics. Nat Rev Immunol 2019 198 19: 477-489. https://doi.org/10.1038/s41577-019-0165-0
|
| [31] |
McAllister MJ, Chemaly M, Eakin AJ, et al. (2018) NLRP3 as a potentially novel biomarker for the management of osteoarthritis. Osteoarthr Cartilage 26: 612-619. https://doi.org/10.1016/j.joca.2018.02.901
|
| [32] | Guo X, Xu X, Li T, et al. (2021) NLRP3 inflammasome activation of mast cells by estrogen via the nuclear-initiated signaling pathway contributes to the development of endometriosis. Front Immunol 12: 3909. https://doi.org/10.3389/fimmu.2021.749979 |
| [33] |
Wang Q, Rozelle AL, Lepus CM, et al. (2011) Identification of a central role for complement in osteoarthritis. Nat Med 17: 1674. https://doi.org/10.1038/nm.2543
|
| [34] |
Gaudenzio N, Sibilano R, Marichal T, et al. (2016) Different activation signals induce distinct mast cell degranulation strategies. J Clin Invest 126: 3981. https://doi.org/10.1172/JCI85538
|
| [35] |
Elieh Ali Komi D, Shafaghat F, Kovanen PT, et al. (2020) Mast cells and complement system: Ancient interactions between components of innate immunity. Allergy 75: 2818-2828. https://doi.org/10.1111/all.14413
|
| [36] |
Schäfer B, Piliponsky AM, Oka T, et al. (2013) Mast cell anaphylatoxin receptor expression can enhance IgE-dependent skin inflammation in mice. J Allergy Clin Immunol 131: 541-548. https://doi.org/10.1016/j.jaci.2012.05.009
|
| [37] |
Lubbers R, van Essen MF, van Kooten C, et al. (2017) Production of complement components by cells of the immune system. Clin Exp Immunol 188: 183-194. https://doi.org/10.1111/cei.12952
|
| [38] |
Bollmann M, Colombo F, Marco P, et al. (2018) Inhibition of the complement system component C5 as possible treatment in OA. Osteoarthr Cartilage 26: S108. https://doi.org/10.1016/j.joca.2018.02.236
|
| [39] |
Yu C, Zang H, Yang C, et al. (2021) Study of chondroitin sulfate E oligosaccharide as a promising complement C5 inhibitor for osteoarthritis alleviation. Mat Sci Eng C-Bio S 127: 112234. https://doi.org/10.1016/j.msec.2021.112234
|
| [40] |
Sousa-Valente J, Calvo L, Vacca V, et al. (2018) Role of TrkA signalling and mast cells in the initiation of osteoarthritis pain in the monoiodoacetate model. Osteoarthr Cartilage 26: 84-94. https://doi.org/10.1016/j.joca.2017.08.006
|
| [41] |
Obara I, Telezhkin V, Alrashdi I, et al. (2020) Histamine, histamine receptors, and neuropathic pain relief. Brit J Pharmacol 177: 580. https://doi.org/10.1111/bph.14696
|
| [42] |
Miller RE, Block JA, Malfait AM (2017) Nerve growth factor blockade for the management of osteoarthritis pain: what can we learn from clinical trials and preclinical models?. Curr Opin Rheumatol 29: 110-118. https://doi.org/10.1097/BOR.0000000000000354
|
| [43] |
Nwosu LN, Mapp PI, Chapman V, et al. (2016) Extended report: Blocking the tropomyosin receptor kinase A (TrkA) receptor inhibits pain behaviour in two rat models of osteoarthritis. Ann Rheum Dis 75: 1246. https://doi.org/10.1136/annrheumdis-2014-207203
|
| [44] |
Okamura Y, Mishima S, Kashiwakura J, et al. (2017) The dual regulation of substance P-mediated inflammation via human synovial mast cells in rheumatoid arthritis. Allergol Int 66: S9-S20. https://doi.org/10.1016/j.alit.2017.03.002
|
| [45] |
Henry CH, Wolford LM (2001) Substance P and mast cells: Preliminary histologic analysis of the human temporomandibular joint. Oral Surg Oral Med O 92: 384-389. https://doi.org/10.1067/moe.2001.117811
|
| [46] |
Green DP, Limjunyawong N, Gour N, et al. (2019) A mast-cell-specific receptor mediates neurogenic inflammation and pain. Neuron 101: 412-420. https://doi.org/10.1016/j.neuron.2019.01.012
|
| [47] |
Ko KR, Lee H, Han SH, et al. (2022) Substance P, a promising therapeutic target in musculoskeletal disorders. Int J Mol Sci 23: 2583. https://doi.org/10.3390/ijms23052583
|
| [48] |
Ogasawara H, Noguchi M (2021) Therapeutic potential of MRGPRX2 inhibitors on mast cells. Cells 10: 2096. https://doi.org/10.3390/cells10112906
|
| [49] |
Thangam EB, Jemima EA, Singh H, et al. (2018) The role of histamine and histamine receptors in mast cell-mediated allergy and inflammation: The hunt for new therapeutic targets. Front Immunol 9: 1873. https://doi.org/10.3389/fimmu.2018.01873
|
| [50] |
Shirinsky I, Shirinsky V (2018) H1-antihistamines are associated with lower prevalence of radiographic knee osteoarthritis: a cross-sectional analysis of the Osteoarthritis Initiative data. Arthritis Res Ther 20: 1-6. https://doi.org/10.1186/s13075-018-1619-7
|
| [51] |
Bihlet AR, Miller CP, Byrjalsen I, et al. (2022) OP0230 antihistamine use and structural progression of knee OA: a post-hoc analysis of two phase III clinical trials. Ann Rheum Dis 81: 152. https://doi.org/10.1136/annrheumdis-2022-eular.4425
|
| [52] |
Sommer C (2010) Serotonin in pain and pain control. Handbook of Behavioral Neuroscience . Amsterdam: Elsevier 457-471. https://doi.org/10.1016/S1569-7339(10)70096-5
|
| [53] |
Harbuz MS, Perveen-Gill Z, Lalies MD, et al. (1996) The role of endogenous serotonin in adjuvant-induced arthritis in the rat. Rheumatology 35: 112-116. https://doi.org/10.1093/rheumatology/35.2.112
|
| [54] |
Kopp S, Alstergren P (2002) Blood serotonin and joint pain in seropositive versus seronegative rheumatoid arthritis. Mediators Inflamm 11: 211. https://doi.org/10.1080/09629350290000069
|
| [55] |
Wan M, Ding L, Wang D, et al. (2020) Serotonin: A potent immune cell modulator in autoimmune diseases. Front Immunol 11: 186. https://doi.org/10.3389/fimmu.2020.00186
|
| [56] |
Seidel MF, Fiebich BL, Ulrich-Merzenich G, et al. (2008) Serotonin mediates PGE2 overexpression through 5-HT2A and 5-HT3 receptor subtypes in serum-free tissue culture of macrophage-like synovial cells. Rheumatol Int 28: 1017-1022. https://doi.org/10.1007/s00296-008-0564-1
|
| [57] |
Stevens RL, Adachi R (2007) Protease-proteoglycan complexes of mouse and human mast cells and importance of their β-tryptase-heparin complexes in inflammation and innate immunity. Immunol Rev 217: 155-167. https://doi.org/10.1111/j.1600-065X.2007.00525.x
|
| [58] |
So AK, Varisco PA, Kemkes-Matthes B, et al. (2003) Arthritis is linked to local and systemic activation of coagulation and fibrinolysis pathways. J Thromb Haemost 1: 2510-2515. https://doi.org/10.1111/j.1538-7836.2003.00462.x
|
| [59] | Chou PY, Su CM, Huang CY, et al. (2014) The characteristics of thrombin in osteoarthritic pathogenesis and treatment. Biomed Res Int 2014: 1-9. https://doi.org/10.1155/2014/407518 |
| [60] | Migliore A, Procopio S (2015) Effectiveness and utility of hyaluronic acid in osteoarthritis. Clin Cases Miner Bone Metab 12: 31. https://doi.org/10.11138/ccmbm/2015.12.1.031 |
| [61] |
Bishnoi M, Jain A, Hurkat P, et al. (2016) Chondroitin sulphate: a focus on osteoarthritis. Glycoconj J 33: 693-705. https://doi.org/10.1007/s10719-016-9665-3
|
| [62] |
Takano H, Furuta K, Yamashita K, et al. (2012) Restriction of mast cell proliferation through hyaluronan synthesis by co-cultured fibroblasts. Biol Pharm Bull 35: 408-412. https://doi.org/10.1248/bpb.35.408
|
| [63] |
Theoharides TC, Patra P, Boucher W, et al. (2000) Chondroitin sulphate inhibits connective tissue mast cells. Brit J Pharmacol 131: 1039. https://doi.org/10.1038/sj.bjp.0703672
|
| [64] | Crivellato E, Beltrami CA, Mallardi F, et al. (2004) The mast cell: an active participant or an innocent bystander?. Histol Histopathol 19: 259-270. |
| [65] |
Buckley MG, Gallagher PJ, Walls AF (1998) Mast cell subpopulations in the synovial tissue of patients with osteoarthritis: selective increase in numbers of tryptase-positive, chymase-negative mast cells. J Pathol 186: 67-74. https://doi.org/10.1002/(SICI)1096-9896(199809)186:1<67::AID-PATH132>3.0.CO;2-D
|
| [66] |
Takata K, Uchida K, Mukai M, et al. (2020) Increase in tryptase and its role in the synovial membrane of overweight and obese patients with osteoarthritis of the knee. Diabetes Metab Syndr Obes 13: 1491-1497. https://doi.org/10.2147/DMSO.S253147
|
| [67] |
Marquardt U, Zettl F, Huber R, et al. (2002) The crystal structure of human α1-tryptase reveals a blocked substrate-binding region. J Mol Biol 321: 491-502. https://doi.org/10.1016/S0022-2836(02)00625-3
|
| [68] |
Buckley MG, Walters C, Wong WM, et al. (1997) Mast cell activation in arthritis: Detection of α- and β-tryptase, histamine and eosinophil cationic protein in synovial fluid. Clin Sci 93: 363-370. https://doi.org/10.1042/cs0930363
|
| [69] |
Nakano S, Mishiro T, Takahara S, et al. (2007) Distinct expression of mast cell tryptase and protease activated receptor-2 in synovia of rheumatoid arthritis and osteoarthritis. Clin Rheumatol 26: 1284-1292. https://doi.org/10.1007/s10067-006-0495-8
|
| [70] |
Xiang Y, Masuko-Hongo K, Sekine T, et al. (2006) Expression of proteinase-activated receptors (PAR)-2 in articular chondrocytes is modulated by IL-1β, TNF-α and TGF-β. Osteoarthr Cartilage 14: 1163-1173. https://doi.org/10.1016/j.joca.2006.04.015
|
| [71] |
Huang X, Ni B, Xi Y, et al. (2019) Protease-activated receptor 2 (PAR-2) antagonist AZ3451 as a novel therapeutic agent for osteoarthritis. Aging 11: 12532. https://doi.org/10.18632/aging.102586
|
| [72] |
Ferrell WR, Kelso EB, Lockhart JC, et al. (2010) Protease-activated receptor 2: a novel pathogenic pathway in a murine model of osteoarthritis. Ann Rheum Dis 69: 2051-2054. https://doi.org/10.1136/ard.2010.130336
|
| [73] |
Lucena F, McDougall JJ (2021) Protease activated receptors and arthritis. Int J Mol Sci 22: 9352. https://doi.org/10.3390/ijms22179352
|
| [74] |
Smith RL (1999) Degradative enzymes in osteoarthritis. Front Biosci 4: 704-712. https://doi.org/10.2741/A388
|
| [75] |
Meszaros E, Malemud CJ (2012) Prospects for treating osteoarthritis: enzyme–protein interactions regulating matrix metalloproteinase activity. Ther Adv Chronic Dis 3: 219. https://doi.org/10.1177/2040622312454157
|
| [76] | Crofford LJ, Sano H, Karalis K, et al. (1993) Corticotropin-releasing hormone in synovial fluids and tissues of patients with rheumatoid arthritis and osteoarthritis. J Immunol 151: 1587-1596. |
| [77] |
Zhao Z, Li E, Cao Q, et al. (2016) Endothelin-1 concentrations are correlated with the severity of knee osteoarthritis. J Invest Med 64: 872-874. https://doi.org/10.1136/jim-2015-000030
|
| [78] |
De Falco L, Fioravanti A, Galeazzi M, et al. (2013) Bradykinin and its role in osteoarthritis. Reumatismo 65: 97-104. https://doi.org/10.4081/reumatismo.2013.97
|
| [79] |
Roy-Beaudry M, Martel-Pelletier J, Pelletier JP, et al. (2003) Endothelin 1 promotes osteoarthritic cartilage degradation via matrix metalloprotease 1 and matrix metalloprotease 13 induction. Arthritis Rheum 48: 2855-2864. https://doi.org/10.1002/art.11247
|
| [80] |
Sin A, Tang W, Wen CY, et al. (2015) The emerging role of endothelin-1 in the pathogenesis of subchondral bone disturbance and osteoarthritis. Osteoarthr Cartilage 23: 516-524. https://doi.org/10.1016/j.joca.2014.11.002
|
| [81] |
Khatib AM, Siegfried G, Messai H, et al. (2002) Mechanism of inhibition of endothelin-1-stimulated proteoglycan and collagen synthesis in rat articular chondrocytes. Cytokine 17: 254-261. https://doi.org/10.1006/cyto.2001.1001
|
| [82] |
Au M, Liu Z, Rong L, et al. (2020) Endothelin-1 induces chondrocyte senescence and cartilage damage via endothelin receptor type B in a post-traumatic osteoarthritis mouse model. Osteoarthr Cartilage 28: 1559-1571. https://doi.org/10.1016/j.joca.2020.08.006
|
| [83] |
Tenti S, Pascarelli NA, Cheleschi S, et al. (2016) The emerging role of bradykinin in the pathogenesis of osteoarthritis and its possible clinical implications. Curr Rheumatol Rev 12: 177-184. https://doi.org/10.2174/1573397112666160331143305
|
| [84] |
Montjean R, Escaich S, Carelli C, et al. (2019) Chimeric peptide combining both growth hormone and somatostatin sequences (REG-O3) improves function and prevents cartilage degradation in rat model of osteoarthritis. Osteoarthr Cartilage 27: S428. https://doi.org/10.1016/j.joca.2019.02.449
|
| [85] | Silveri F, Morosini P, Brecciaroli D, et al. (1994) Intra-articular injection of somatostatin in knee osteoarthritis: clinical results and IGF-1 serum levels. Int J Clin Pharmacol Res 14: 79-85. |
| [86] |
Intekhab-Alam NY, White OB, Getting SJ, et al. (2013) Urocortin protects chondrocytes from NO-induced apoptosis: a future therapy for osteoarthritis?. Cell Death Discov 4: e717. https://doi.org/10.1038/cddis.2013.231
|
| [87] |
Lawrence KM, Jones RC, Jackson TR, et al. (2017) Chondroprotection by urocortin involves blockade of the mechanosensitive ion channel Piezo1. Sci Rep 7: 1-12. https://doi.org/10.1038/s41598-017-04367-4
|
| [88] |
Jiang W, Wang H, Li YS, et al. (2016) Role of vasoactive intestinal peptide in osteoarthritis. J Biomed Sci 23: 1-6. https://doi.org/10.1186/s12929-016-0280-1
|
| [89] | Caughey GH, Leidig F, Viro NF, et al. (1988) Substance P and vasoactive intestinal peptide degradation by mast cell tryptase and chymase. J Pharmacol Exp Ther 244: 133-137. |
| [90] |
Vincent TL (2019) IL-1 in osteoarthritis: Time for a critical review of the literature. F1000Research 8: 1-8. https://doi.org/10.12688/f1000research.18831.1
|
| [91] | Florián AM (2011) IL-1 and its role in osteoarthritis. Open J Med 1: 1-6. |
| [92] | Li H, Xie S, Qi Y, et al. (2018) TNF-αincreases the expression of inflammatory factors in synovial fibroblasts by inhibiting the PI3K/AKT pathway in a rat model of monosodium iodoacetate-induced osteoarthritis. Exp Ther Med 16: 4737-4744. https://doi.org/10.3892/etm.2018.6770 |
| [93] |
Hu G, Zhao X, Wang C, et al. (2017) MicroRNA-145 attenuates TNF-α-driven cartilage matrix degradation in osteoarthritis via direct suppression of MKK4. Cell Death Discov 8: e3140-e3140. https://doi.org/10.1038/cddis.2017.522
|
| [94] |
Chisari E, Yaghmour KM, Khan WS (2020) The effects of TNF-alpha inhibition on cartilage: a systematic review of preclinical studies. Osteoarthr Cartilage 28: 708-718. https://doi.org/10.1016/j.joca.2019.09.008
|
| [95] |
Suurmond J, Dorjée AL, Boon MR, et al. (2011) Mast cells are the main interleukin 17-positive cells in anticitrullinated protein antibody-positive and -negative rheumatoid arthritis and osteoarthritis synovium. Arthritis Res Ther 13: R150. https://doi.org/10.1186/ar3466
|
| [96] |
Mohamed SA, Neseem NO, Metwally SS, et al. (2018) IL-17 in primary knee osteoarthritis and its relation with severity of the disease. Int J Clin Rheumtol 13: 364-369. https://doi.org/10.4172/1758-4272.1000212
|
| [97] |
Na HS, Park JS, Cho KH, et al. (2020) Interleukin-1-interleukin-17 signaling axis induces cartilage destruction and promotes experimental osteoarthritis. Front Immunol 11: 730. https://doi.org/10.3389/fimmu.2020.00730
|
| [98] |
Liao Y, Ren Y, Luo X, et al. (2022) Interleukin-6 signaling mediates cartilage degradation and pain in posttraumatic osteoarthritis in a sex-specific manner. Sci Signal 15: eabn7082. https://doi.org/10.1126/scisignal.abn7082
|
| [99] |
Wiegertjes R, van de Loo FAJ, Davidson ENB (2020) A roadmap to target interleukin-6 in osteoarthritis. Rheumatology 59: 2681-2694. https://doi.org/10.1093/rheumatology/keaa248
|
| [100] |
Ahmad R, El Mabrouk M, Sylvester J, et al. (2009) Human osteoarthritic chondrocytes are impaired in matrix metalloproteinase-13 inhibition by IFN-γ due to reduced IFN-γ receptor levels. Osteoarthr Cartilage 17: 1049-1055. https://doi.org/10.1016/j.joca.2009.02.008
|
| [101] |
Henrotin YE, Zheng SX, Labasse AH, et al. (2000) Modulation of human chondrocyte metabolism by recombinant human interferon. Osteoarthr Cartilage 8: 474-482. https://doi.org/10.1053/joca.1999.0323
|
| [102] |
Kour S, Garimella MG, Shiroor DA, et al. (2016) IL-3 decreases cartilage degeneration by downregulating matrix metalloproteinases and reduces joint destruction in osteoarthritic mice. J Immunol 196: 5024-5035. https://doi.org/10.4049/jimmunol.1500907
|
| [103] |
van Helvoort EM, van der Heijden E, van Roon JAG, et al. (2022) The role of interleukin-4 and interleukin-10 in osteoarthritic joint disease: A systematic narrative review. Cartilage 13: 194760352210981. https://doi.org/10.1177/19476035221098167
|
| [104] |
Jovanovic D, Pelletier JP, Alaaeddine N, et al. (1998) Effect of IL-13 on cytokines, cytokine receptors and inhibitors on human osteoarthritis synovium and synovial fibroblasts. Osteoarthr Cartilage 6: 40-49. https://doi.org/10.1053/joca.1997.0091
|
| [105] |
Yang CY, Chanalaris A, Bonelli S, et al. (2020) Interleukin 13 (IL-13)-regulated expression of the chondroprotective metalloproteinase ADAM15 is reduced in aging cartilage. Osteoarthr Cartil Open 2: 100128. https://doi.org/10.1016/j.ocarto.2020.100128
|
| [106] | Cook AD, Pobjoy J, Steidl S, et al. (2012) Granulocyte-macrophage colony-stimulating factor is a key mediator in experimental osteoarthritis pain and disease development. Arthritis Res Ther 14: 1-9. https://doi.org/10.1186/ar4037 |
| [107] |
Lee KMC, Prasad V, Achuthan A, et al. (2020) Targeting GM-CSF for collagenase-induced osteoarthritis pain and disease in mice. Osteoarthr Cartilage 28: 486-491. https://doi.org/10.1016/j.joca.2020.01.012
|
| [108] |
Tewari D, Cook AD, Lee MC, et al. (2020) Granulocyte-macrophage colony stimulating factor as an indirect mediator of nociceptor activation and pain. J Neurosci 40: 2189-2199. https://doi.org/10.1523/JNEUROSCI.2268-19.2020
|
| [109] |
Honsawek S, Yuktanandana P, Tanavalee A, et al. (2012) Correlation between plasma and synovial fluid basic fibroblast growth factor with radiographic severity in primary knee osteoarthritis. Int Orthop 36: 981. https://doi.org/10.1007/s00264-011-1435-z
|
| [110] |
Takata K, Uchida K, Takano S, et al. (2021) Possible regulation of bFGF expression by mast cells in osteoarthritis patients with obesity: A cross-sectional study. Diabetes Metab Syndr Obes 14: 3291-3297. https://doi.org/10.2147/DMSO.S319537
|
| [111] |
El-Fetiany AE, Kassem EM, El-Barbary AM, et al. (2017) Evaluation of plasma basic fibroblast growth factor (bFGF) in primary knee osteoarthritis patients. Egypt Rheumatol 39: 33-37. https://doi.org/10.1016/j.ejr.2016.03.006
|
| [112] | Im HJ, Sharrocks AD, Lin X, et al. (2009) Basic fibroblast growth factor induces matrix metalloproteinase-13 via eRK MAP kinase-altered phosphorylation and sumoylation of Elk-1 in human adult articular chondrocytes. Open Access Rheumatol Res Rev 1: 151-161. https://doi.org/10.2147/OARRR.S7527 |
| [113] |
Li X, Su G, Wang J, et al. (2013) Exogenous bFGF promotes articular cartilage repair via up-regulation of multiple growth factors. Osteoarthr Cartilage 21: 1567-1575. https://doi.org/10.1016/j.joca.2013.06.006
|
| [114] |
Chuma H, Mizuta H, Kudo S, et al. (2004) One day exposure to FGF-2 was sufficient for the regenerative repair of full-thickness defects of articular cartilage in rabbits. Osteoarthr Cartilage 12: 834-842. https://doi.org/10.1016/j.joca.2004.07.003
|
| [115] |
Khan SN, Muhammad H, Scammahorn JJ, et al. (2018) Fibroblast growth factor 2 promotes regeneration of cartilage by attracting mesenchymal stem cells to the site of cartilage injury. Osteoarthr Cartilage 26: S37. https://doi.org/10.1016/j.joca.2018.02.090
|
| [116] |
Vincent TL (2011) Fibroblast growth factor 2: Good or bad guy in the joint?. Arthritis Res Ther 13: 1-2. https://doi.org/10.1186/ar3447
|
| [117] |
Murata M, Yudoh K, Masuko K (2008) The potential role of vascular endothelial growth factor (VEGF) in cartilage: How the angiogenic factor could be involved in the pathogenesis of osteoarthritis?. Osteoarthr Cartilage 16: 279-286. https://doi.org/10.1016/j.joca.2007.09.003
|
| [118] |
Hamilton JL, Nagao M, Levine BR, et al. (2016) Targeting VEGF and its receptors for the treatment of osteoarthritis and associated pain. J Bone Miner Res 31: 911-924. https://doi.org/10.1002/jbmr.2828
|
| [119] |
Wang B, Wu L, Chen J, et al. (2021) Metabolism pathways of arachidonic acids: mechanisms and potential therapeutic targets. Signal Transduct Target Ther 6: 1-30. https://doi.org/10.1038/s41392-020-00443-w
|
| [120] |
Theoharides TC, Kalogeromitros D (2006) The critical role of mast cells in allergy and inflammation. Ann NY Acad Sci 1088: 78-99. https://doi.org/10.1196/annals.1366.025
|
| [121] |
Miyabe Y, Miyabe C, Luster AD (2017) LTB4 and BLT1 in inflammatory arthritis. Semin Immunol 33: 52-57. https://doi.org/10.1016/j.smim.2017.09.009
|
| [122] |
Wittenberg RH, Willburger RE, Kleemeyer KS, et al. (1993) In vitro release of prostaglandins and leukotrienes from synovial tissue, cartilage, and bone in degenerative joint diseases. Arthritis Rheum 36: 1444-1450. https://doi.org/10.1002/art.1780361017
|
| [123] |
Hansen AK, Indrevik JT, Figenschau Y, et al. (2015) Human articular chondrocytes express functional leukotriene B4 receptors. J Anat 226: 268-277. https://doi.org/10.1111/joa.12275
|
| [124] | He W, Pelletier JP, Martel-Pelletier J, et al. (2002) Synthesis of interleukin 1beta, tumor necrosis factor-alpha, and interstitial collagenase (MMP-1) is eicosanoid dependent in human osteoarthritis synovial membrane explants: interactions with antiinflammatory cytokines. J Rheumatol 29: 546-553. |
| [125] |
Mishima S, Kashiwakura J, Toyoshima S, et al. (2021) Higher PGD2 production by synovial mast cells from rheumatoid arthritis patients compared with osteoarthritis patients via miR-199a-3p/prostaglandin synthetase 2 axis. Sci Rep 11: 1-14. https://doi.org/10.1038/s41598-021-84963-7
|
| [126] | Zayed N, Chabane N, Elmansouri FE, et al. (2010) Prostaglandin D2 enhances interleukin-1β-induced cyclooxygenase-2 expression in osteoarthritic cartilage. J Transl Med 25: 945. https://doi.org/10.1096/fasebj.25.1_supplement.945.15 |
| [127] |
Zayed N, Afif H, Chabane N, et al. (2008) Prostaglandin D2 inhibits interleukin-1β-induced matrix metalloproteinase-1 and -13 production by human osteoarthritic chondrocytes. Arthritis Rheum 58: 3530. https://doi.org/10.1002/art.23958
|
| [128] |
Dave M, Amin AR (2013) Yin-Yang regulation of prostaglandins and nitric oxide by PGD2 in human arthritis: Reversal by celecoxib. Immunol Lett 152: 47-54. https://doi.org/10.1016/j.imlet.2013.04.002
|
| [129] |
Fahmi H, Ouhaddi Y (2017) Deletion of the prostaglandin D2 receptor DP1 exacerbates aging-associated and instability-induced osteoarthritis. Osteoarthr Cartilage 25: S153-S154. https://doi.org/10.1016/j.joca.2017.02.255
|
| [130] |
Timur UT, Caron MMJ, Jeuken RM, et al. (2020) Chondroprotective actions of selective COX-2 inhibitors in vivo: A systematic review. Int J Mol Sci 21: 1-15. https://doi.org/10.3390/ijms21186962
|
| [131] |
McCabe PS, Maricar N, Parkes MJ, et al. (2016) The efficacy of intra-articular steroids in hip osteoarthritis: a systematic review. Osteoarthr Cartilage 24: 1509-1517. https://doi.org/10.1016/j.joca.2016.04.018
|
| [132] | Pelletier JP, Lascau-Coman V, Jovanovic D, et al. (1999) Selective inhibition of inducible nitric oxide synthase in experimental osteoarthritis is associated with reduction in tissue levels of catabolic factors. J Rheumatol 26: 2002-2014. |
| [133] |
Abramson SB (2008) Osteoarthritis and nitric oxide. Osteoarthr Cartilage 16: S15-S20. https://doi.org/10.1016/S1063-4584(08)60008-4
|
| [134] | Shang X, Wang Y, Cai D, et al. (2022) An inducible nitric oxide synthase dimerization inhibitor prevents the progression of osteoarthritis. Front Pharmacol 13: 2627. https://doi.org/10.3389/fphar.2022.861183 |
| [135] |
Han Y, Yang J, Zhao W, et al. (2021) Biomimetic injectable hydrogel microspheres with enhanced lubrication and controllable drug release for the treatment of osteoarthritis. Bioact Mater 6: 3596-3607. https://doi.org/10.1016/j.bioactmat.2021.03.022
|
| [136] |
Huang H, Lou Z, Zheng S, et al. (2022) Intra-articular drug delivery systems for osteoarthritis therapy: shifting from sustained release to enhancing penetration into cartilage. Drug Deliv 29: 767. https://doi.org/10.1080/10717544.2022.2048130
|
Figures(1)

Anastasiia D. Kurenkova, Peter S. Timashev. Mast cells: A dark horse in osteoarthritis treatment[J]. AIMS Allergy and Immunology, 2022, 6(4): 228-247. doi: 10.3934/Allergy.2022017


 DownLoad: