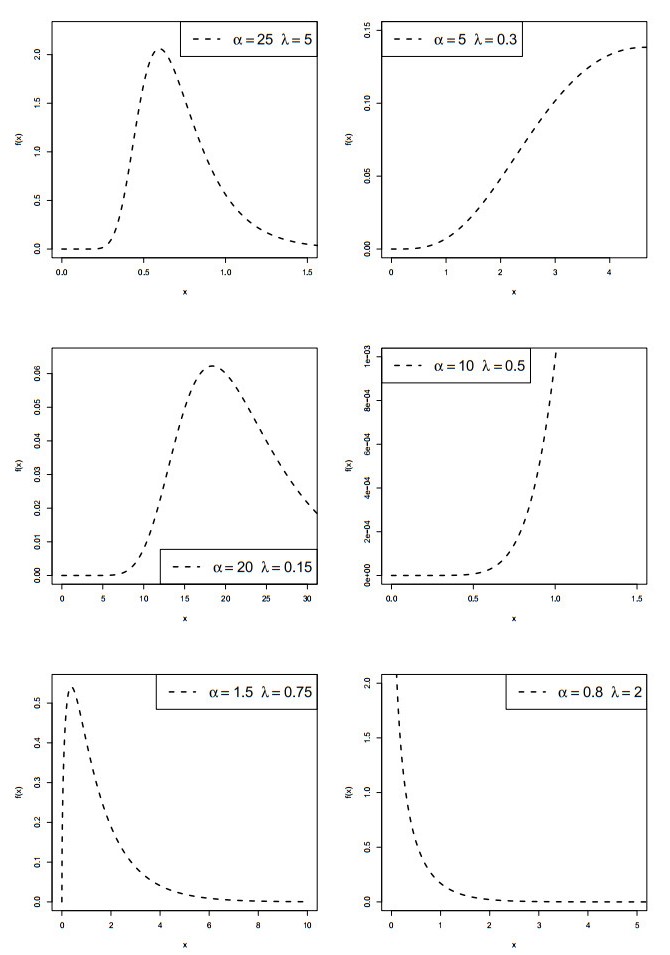
This paper addresses asymmetric flexible two-parameter exponential model called the weighted exponential (WDEx) distribution. Some of its basic mathematical features are evaluated. Its hazard rate accommodates upside-down bathtub, decreasing, decreasing-constant, increasing, and increasing-constant shapes. Five actuarial indicators are studied. We utilize nine classical and Bayesian approaches of estimation for estimating the WDEx parameters. We provide a detailed simulation study to explore and assess the asymptotic behaviors of these estimators. Two approximation methods called the Markov chain Mont Carlo and Tierney and Kadane are applied to obtain the Bayesian estimates. The efficiency and applicability of the WDEx distribution are explored by modeling a lifetime data set from insurance field, showing that the WDEx distribution provides a superior fit over its competing exponential models such as the beta-exponential, Harris extend-exponential, Marshall–Olkin exponential, Marshall–Olkin alpha-power exponential, gamma Weibull, and exponentiated-Weibull distributions.
Citation: Fathy H. Riad, Eslam Hussam, Ahmed M. Gemeay, Ramy A. Aldallal, Ahmed Z.Afify. Classical and Bayesian inference of the weighted-exponential distribution with an application to insurance data[J]. Mathematical Biosciences and Engineering, 2022, 19(7): 6551-6581. doi: 10.3934/mbe.2022309
This paper addresses asymmetric flexible two-parameter exponential model called the weighted exponential (WDEx) distribution. Some of its basic mathematical features are evaluated. Its hazard rate accommodates upside-down bathtub, decreasing, decreasing-constant, increasing, and increasing-constant shapes. Five actuarial indicators are studied. We utilize nine classical and Bayesian approaches of estimation for estimating the WDEx parameters. We provide a detailed simulation study to explore and assess the asymptotic behaviors of these estimators. Two approximation methods called the Markov chain Mont Carlo and Tierney and Kadane are applied to obtain the Bayesian estimates. The efficiency and applicability of the WDEx distribution are explored by modeling a lifetime data set from insurance field, showing that the WDEx distribution provides a superior fit over its competing exponential models such as the beta-exponential, Harris extend-exponential, Marshall–Olkin exponential, Marshall–Olkin alpha-power exponential, gamma Weibull, and exponentiated-Weibull distributions.

| [1] | A. A. Al-Babtain, I. Elbatal, H. Al-Mofleh, A. M. Gemeay, A. Z. Afify, A. M. Sarg, The flexible burr xg family: Properties, inference, and applications in engineering science, Symmetry, 13 (2021), 474. |
| [2] | H. M. Alshanbari, A. H. Abd El-Bagoury, A. M. Gemeay, E. H. Hafez, A. S. Eldeeb, A flexible extension of pareto distribution: Properties and applications, Comput. Intell. Neurosci., (2021), 1–17. https://doi.org/10.1155/2021/9819200 |
| [3] | H. M. Alshanbari, A. M. Gemeay, A. H. El-Bagoury, S. K. Khosa, E. H. Hafez, A. H. Muse, A novel extension of fréchet distribution: Application on real data and simulation, Alexandria Eng. J., 61 (2022), 7917–7938. |
| [4] | M. Dehghani, Z. Montazeri, A. Dehghani, R. A. Ramirez-Mendoza, H. Samet, J. M, Guerrero, et al., Mlo: Multi leader optimizer, Int. J. Intell. Eng. Syst, 13 (2020), 364–373. https://doi.org/10.22266/ijies2020.1231.32 |
| [5] |
M. Dehghani, Z. Montazeri, G. Dhiman, O. P. Malik, R. Morales-Menendez, R. A. Ramirez-Mendoza, et al., A spring search algorithm applied to engineering optimization problems, Appl. Sci., 10 (2020), 6173. https://doi.org/10.3390/app10186173 doi: 10.3390/app10186173

|
| [6] |
M. Dehghani, Z. Montazeri, H. Givi, J. M. Guerrero, G. Dhiman, Darts game optimizer: A new optimization technique based on darts game, Int. J. Intell. Eng. Syst, 13 (2020), 286–294. https://doi.org/10.22266/ijies2020.1031.26 doi: 10.22266/ijies2020.1031.26
|
| [7] |
M. Dehghani, Z. Montazeri, O. P. Malik, G. Dhiman, V. Kumar, Bosa: Binary orientation search algorithm, Int. J. Innovative Technol. Explor. Eng., 9 (2019), 5306–5310. https://doi.org/10.35940/ijitee.A4215.119119 doi: 10.35940/ijitee.A4215.119119
|
| [8] |
G. Dhiman, Esa: A hybrid bio-inspired metaheuristic optimization approach for engineering problems, Eng. Comput., 37 (2021), 323–353. https://doi.org/10.1007/s00366-019-00826-w doi: 10.1007/s00366-019-00826-w
|
| [9] |
G. Dhiman, M. Garg, A. Nagar, V. Kumar, M. Dehghani, A novel algorithm for global optimization: Rat swarm optimizer, J. Ambient Intell. Hum. Comput., 12 (2021), 8457–8482. https://doi.org/10.1007/s12652-020-02580-0 doi: 10.1007/s12652-020-02580-0
|
| [10] |
G. Dhiman, A. Kaur, Stoa: A bio-inspired based optimization algorithm for industrial engineering problems, Eng. Appl. Artif. Intell., 82 (2019), 148–174. https://doi.org/10.1016/j.engappai.2019.03.021 doi: 10.1016/j.engappai.2019.03.021
|
| [11] |
G. Dhiman, V. Kumar, Spotted hyena optimizer: A novel bio-inspired based metaheuristic technique for engineering applications, Adv. Eng. Software, 114 (2017), 48–70. https://doi.org/10.1016/j.advengsoft.2017.05.014 doi: 10.1016/j.advengsoft.2017.05.014
|
| [12] |
G. Dhiman, V. Kumar, Emperor penguin optimizer: A bio-inspired algorithm for engineering problems, Knowledge Based Syst., 159 (2018), 20–50. https://doi.org/10.1016/j.knosys.2018.06.001 doi: 10.1016/j.knosys.2018.06.001
|
| [13] |
G. Dhiman, V. Kumar, Seagull optimization algorithm: Theory and its applications for large-scale industrial engineering problems, Knowledge Based Syst., 165 (2019), 169–196. https://doi.org/10.1016/j.knosys.2018.11.024 doi: 10.1016/j.knosys.2018.11.024
|
| [14] | G. Dhiman, D. Oliva, A. Kaur, K. K. Singh, S. Vimal, A. Sharma, et al., Bepo: A novel binary emperor penguin optimizer for automatic feature selection, Knowledge Based Syst., 211 (2021), 106560. |
| [15] |
S. Kaur, L. K. Awasthi, A. L. Sangal, G. Dhiman, Tunicate swarm algorithm: A new bio-inspired based metaheuristic paradigm for global optimization, Eng. Appl. Artif. Intell., 90 (2020), 103541. https://doi.org/10.1016/j.engappai.2020.103541 doi: 10.1016/j.engappai.2020.103541
|
| [16] | H. Bakouch, C. Chesneau, M. Enany, A weighted general family of distributions: Theory and practice, Comput. Math. Methods, (2020), e1135. |
| [17] | Z. Ahmad, E. Mahmoudi, M. Alizadeh, R. Roozegar, A. Z. Afify, The exponential tx family of distributions: Properties and an application to insurance data, J. Math., (2021), 1–18. https://doi.org/10.1155/2021/3058170 |
| [18] |
N. M. Alfaer, A. M. Gemeay, H. M. Aljohani, A. Z. Afify, The extended log-logistic distribution: Inference and actuarial applications, Mathematics, 9 (2021), 1386. https://doi.org/10.3390/math9121386 doi: 10.3390/math9121386
|
| [19] |
A. A. Al-Babtain, A. M. Gemeay, A. Z. Afify, Estimation methods for the discrete Poisson-Lindley and discrete Lindley distributions with actuarial measures and applications in medicine, J. King Saud Univ. Sci., 33 (2021), 101224. https://doi.org/10.1016/j.jksus.2020.10.021 doi: 10.1016/j.jksus.2020.10.021
|
| [20] |
A. A. M. Teamah, A. A. Elbanna, A. M. Gemeay, Heavy-tailed log-logistic distribution: Properties, risk measures and applications, Stat. Optim. Inf. Comput., 9 (2021), 910–941. https://doi.org/10.19139/soic-2310-5070-1220 doi: 10.19139/soic-2310-5070-1220
|
| [21] | J. Zhao, Z. Ahmad, E. Mahmoudi, E. H. Hafez, M. M. Mohie El-Din, A new class of heavy-tailed distributions: Modeling and simulating actuarial measures, Complexity, (2021), 1–18. https://doi.org/10.1155/2021/5580228 |
| [22] |
P. Artzner, Application of coherent risk measures to capital requirements in insurance, North Am. Actuar. J., 3 (1999), 11–25. https://doi.org/10.1016/S1365-6937(99)90555-5 doi: 10.1016/S1365-6937(99)90555-5
|
| [23] |
Z. Landsman, On the tail mean variance optimal portfolio selection, Insur. Math. Econ., 46 (2010), 547–553. https://doi.org/10.1016/j.insmatheco.2010.02.001 doi: 10.1016/j.insmatheco.2010.02.001
|
| [24] |
L. Tierney, J. B. Kadane, Accurate approximations for posterior moments and marginal densities, J. Am. Stat. Assoc., 81 (1986), 82–86. https://doi.org/10.1007/BF01456272 doi: 10.1007/BF01456272
|
| [25] |
S. Nadarajah, S. Kotz, The beta exponential distribution, Reliab. Eng. Syst. Saf., 91 (2006), 689–697. https://doi.org/10.1016/j.ress.2005.05.008 doi: 10.1016/j.ress.2005.05.008
|
| [26] |
G. S. Mudholkar, D. K. Srivastava, Exponentiated Weibull family for analyzing bathtub failure-rate data, IEEE Trans. Reliab., 42 (1993), 299–302. https://doi.org/10.1109/24.229504 doi: 10.1109/24.229504
|
| [27] |
L. G. B. Pinho, G. M. Cordeiro, J. S. Nobre, The Harris extended exponential distribution, Comm. Stat. Theory Methods, 44 (2015), 3486–3502. https://doi.org/10.1080/03610926.2013.851221 doi: 10.1080/03610926.2013.851221
|
| [28] |
A. Z. Afify, A. M. Gemeay, N. A. Ibrahim, The heavy-tailed exponential distribution: Risk measures, estimation, and application to actuarial data, Mathematics, 8 (2020), 1276. https://doi.org/10.3390/math8081276 doi: 10.3390/math8081276
|
| [29] | A. A. M. Teamah, A. A. Elbanna, A. M. Gemeay, Fréchet-Weibull mixture distribution: Properties and applications, Appl. Math. Sci., 14 (2020), 75–86. |
| [30] |
M. Nassar, D. Kumar, S. Dey, G. M. Cordeiro, A. Z. Afify, The Marshall–Olkin alpha power family of distributions with applications, J. Comput. Appl. Math., 351 (2019), 41–53. https://doi.org/10.1016/j.cam.2018.10.052 doi: 10.1016/j.cam.2018.10.052
|
| [31] |
A. W. Marshall, I. Olkin, A new method for adding a parameter to a family of distributions with application to the exponential and Weibull families, Biometrika, 84 (1997), 641–652. https://doi.org/10.1093/biomet/84.3.641 doi: 10.1093/biomet/84.3.641
|
| [32] | A. A. M. Teamah, A. A. Elbanna, A. M. Gemeay. Fréchet-Weibull distribution with applications to earthquakes data sets, Pak. J. Stat., 36 (2020), 135–147. |
| [33] |
A. Mahdavi, D. Kundu, A new method for generating distributions with an application to exponential distribution, Comm. Stat. Theory Methods, 46 (2017), 6543–6557. https://doi.org/10.1080/03610926.2015.1130839 doi: 10.1080/03610926.2015.1130839
|
| [34] |
Y. Tian, M. Tian, Q. Zhu, Transmuted linear exponential distribution: A new generalization of the linear exponential distribution, Comm. Stat. Simul. Comput., 43 (2014), 2661–2677. https://doi.org/10.1080/03610918.2013.763978 doi: 10.1080/03610918.2013.763978
|


Figures(9) / Tables(7)

Fathy H. Riad, Eslam Hussam, Ahmed M. Gemeay, Ramy A. Aldallal, Ahmed Z.Afify. Classical and Bayesian inference of the weighted-exponential distribution with an application to insurance data[J]. Mathematical Biosciences and Engineering, 2022, 19(7): 6551-6581. doi: 10.3934/mbe.2022309


 DownLoad: