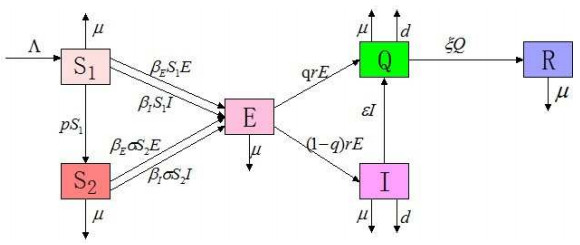
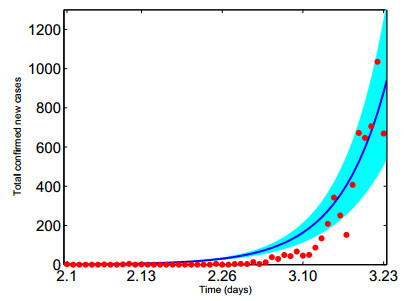
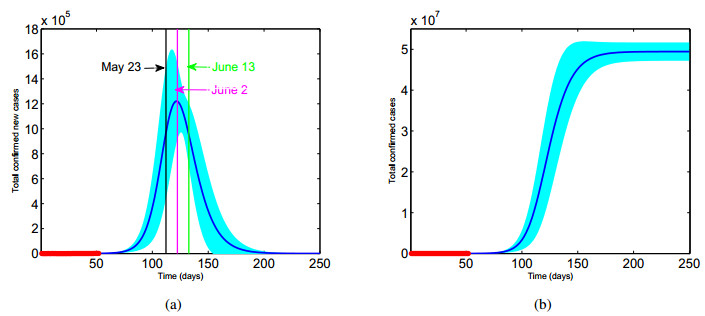
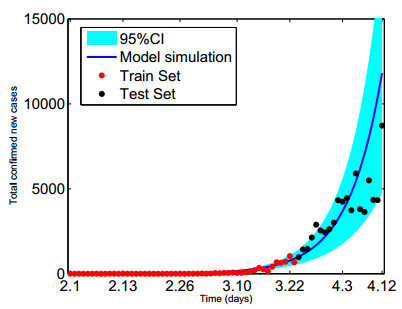
A new COVID-19 epidemic model with media coverage and quarantine is constructed. The model allows for the susceptibles to the unconscious and conscious susceptible compartment. First, mathematical analyses establish that the global dynamics of the spread of the COVID-19 infectious disease are completely determined by the basic reproduction number R0. If R0 ≤ 1, then the disease free equilibrium is globally asymptotically stable. If R0 > 1, the endemic equilibrium is globally asymptotically stable. Second, the unknown parameters of model are estimated by the MCMC algorithm on the basis of the total confirmed new cases from February 1, 2020 to March 23, 2020 in the UK. We also estimate that the basic reproduction number is R0 = 4.2816(95%CI: (3.8882, 4.6750)). Without the most restrictive measures, we forecast that the COVID-19 epidemic will peak on June 2 (95%CI: (May 23, June 13)) (
Citation: Li-Xiang Feng, Shuang-Lin Jing, Shi-Ke Hu, De-Fen Wang, Hai-Feng Huo. Modelling the effects of media coverage and quarantine on the COVID-19 infections in the UK[J]. Mathematical Biosciences and Engineering, 2020, 17(4): 3618-3636. doi: 10.3934/mbe.2020204
A new COVID-19 epidemic model with media coverage and quarantine is constructed. The model allows for the susceptibles to the unconscious and conscious susceptible compartment. First, mathematical analyses establish that the global dynamics of the spread of the COVID-19 infectious disease are completely determined by the basic reproduction number R0. If R0 ≤ 1, then the disease free equilibrium is globally asymptotically stable. If R0 > 1, the endemic equilibrium is globally asymptotically stable. Second, the unknown parameters of model are estimated by the MCMC algorithm on the basis of the total confirmed new cases from February 1, 2020 to March 23, 2020 in the UK. We also estimate that the basic reproduction number is R0 = 4.2816(95%CI: (3.8882, 4.6750)). Without the most restrictive measures, we forecast that the COVID-19 epidemic will peak on June 2 (95%CI: (May 23, June 13)) (

| [1] |
P. Zhou, X. L. Yang, X. G. Wang, B. Hu, L. Zhang, W. Zhang, et al., A pneumonia outbreak associated with a new coronavirus of probable bat origin, Nature, 579 (2020), 270-273. doi: 10.1038/s41586-020-2012-7

|
| [2] |
Q. Li, X. Guan, P. Wu, X. Wang, L. Zhou, Y. Tong, et al., Early transmission dynamics in Wuhan, China, of Noval Coronavirus-infected Pneumonia, N. Engl. J. Med., 382 (2020), 1199-1207. doi: 10.1056/NEJMoa2001316
|
| [3] | P. Wu, X. Hao, E. H. Y. Lau, J. Y. Wong, K. S. M. Leung, J. T. Wu, et al., Real-time tentative assessment of the epidemiological characteristics of novel coronavirus infections in Wuhan, China, as at 22 January 2020, Euro. Surveill., 25 (2020), 2000044. |
| [4] |
T. Chen, J. Rui, Q. Wang, Z. Zhao, J. Cui, L. Yin, A mathematical model for simulating the transmission of Wuhan novel Coronavirus, Infect. Dis. Poverty, 9 (2020), 1-8. doi: 10.1186/s40249-019-0617-6
|
| [5] | M. W. Shen, Z. H. Peng, Y. N. Xiao, L. Zhang, Modelling the epidemic trend of the 2019 novel coronavirus outbreak in China, bioRxiv, (2020), 2020.01.23.916726. |
| [6] |
Q. Y. Lin, S. Zhao, D. Z. Gao, Y. J. Lou, S. Yang, S. S. Musa, et al., A conceptual model for the outbreak of Coronavirus disease 2019 (COVID-19) in Wuhan, China with individual reaction and governmental action, Int. J. Infect. Dis., 93 (2020), 211-216. doi: 10.1016/j.ijid.2020.02.058
|
| [7] | L. L. Wang, Y. W. Zhou, J. He, B. Zhu, F. Wang, L. Tang, et al., An epidemiological forecast model and software assessing interventions on COVID-19 epidemic in China, medRxiv, (2020). |
| [8] | S. Y. Tang, B. Tang, N. L. Bragazzi, F. Xia, T. J. Li, S. He, et al., Stochastic discrete epidemic modeling of COVID-19 transmission in the Province of Shaanxi incorporating public health intervention and case importation, medRxiv, (2020). |
| [9] | X. F. Luo, S. S. Feng, J. Y. Yang, X. L. Peng, X. C. Cao, J. P. Zhang, et al., Analysis of potential risk of COVID-19 infections in China based on a pairwise epidemic model, (2020). doi: 10.20944/preprints202002.0398.v1. |
| [10] | H. Nishiura, N. M. Linton, A. R. Akhmetzhanov, Serial interval of novel coronavirus (2019-nCoV) infections, medRxiv, (2020). doi: 10.1101/2020.02.03.20019497. |
| [11] | Z. W. Du, X. K. Xu, Y. Wu, L. Wang, B. J. Cowling, L. A. Meyers, The serial interval of COVID-19 among publicly reported confirmed cases, medRxiv, (2020). doi: 10.1101/2020.02.19.20025452. |
| [12] | H. F. Huo, S. J. Dang, Y. N. Li, Stability of a Two-Strain Tuberculosis Model with General Contact Rate, Abstr. Appl. Anal., 2010 (2010), 1-31. |
| [13] |
H. F. Huo, L. X. Feng, Global stability for an HIV/AIDS epidemic Model with different latent stages and treatment, Appl. Math. Model., 37 (2013), 1480-1489. doi: 10.1016/j.apm.2012.04.013
|
| [14] | P. Shao, Y. G. Shan, Beware of asymptomatic transmission: Study on 2019-nCov preventtion and control measures based on SEIR model, BioRxiv, (2020). doi: 10.1101/2020.01.28.923169. |
| [15] |
W. K. Zhou, A. L. Wang, F. Xia, Y. N. Xiao, S. Y. Tang, Effects of media reporting on mitigating spread of COVID-19 in the early phase of the outbreak, Math. Biosci. Eng., 17 (2020), 2693-2707. doi: 10.3934/mbe.2020147
|
| [16] |
J. Amador, A. Gomez-Corral, A stochastic epidemic model with two quarantine states and limited carrying capacity for quarantine, Physica A, 544 (2020), 121899. doi: 10.1016/j.physa.2019.121899
|
| [17] | Q. W. Gao, J. Zhuang, Stability analysis and control strategies for worm attack in mobile networks via a VEIQS propagation model, Appl. Math. Comput., 368 (2020), 124584. |
| [18] |
P. Van den Driessche, J. Watmough, Reproduction numbers and sub-threshold endemic equilibria for compartmental models of disease transmission, Math. Biosci., 180 (2002), 29-48. doi: 10.1016/S0025-5564(02)00108-6
|
| [19] | J. P. LaSalle, The stability of dynamical systems, Society for Industrial and Applied Mathematics, Philadelphia, Pa., 1976. |
| [20] |
H. Haario, E. Saksman, J. Tamminen, An adaptive metropolis algorithm, Bernoulli, 7 (2001), 223-242. doi: 10.2307/3318737
|
| [21] |
H. Haario, M. Laine, A. Mira, E. Saksman, DRAM: efficient adaptive MCMC, Stat. Comput., 16 (2006), 339-354. doi: 10.1007/s11222-006-9438-0
|
| [22] | D. Gamerman, H. F. Lopes, Markov chain Monte Carlo: stochastic simulation for Bayesian inference, Technometrics, 50 (2008), 97. |
| [23] |
W. J. Guan, Z. Y. Ni, Y. Hu, W. H. Liang, C. Q. Ou, J. X. He, et al., Clinical Characteristics of Coronavirus Disease 2019 in China, New Engl. J. Med., 382 (2020), 1708-1720. doi: 10.1056/NEJMoa2002032
|
| [24] |
B. Tang, X. Wang, Q. Li, N. L. Bragazzi, S. Y. Tang, Y. N. Xiao, et al., Estimation of the transmission risk of 2019-nCov and its implication for public health interventions, J. Clin. Med., 9 (2020), 462. doi: 10.3390/jcm9020462
|
| [25] | World Health Organization, Coronavirus disease (COVID-2019) situation reports, 2020. Available from: https://www.who.int/emergencies/diseases/novel-coronavirus-2019/situation-reports/. |
| [26] | World Health Organization, Statistics of United Kingdom. Available from: https://www.who.int/countries/gbr/en/. |
Figures(8) / Tables(3)

Li-Xiang Feng, Shuang-Lin Jing, Shi-Ke Hu, De-Fen Wang, Hai-Feng Huo. Modelling the effects of media coverage and quarantine on the COVID-19 infections in the UK[J]. Mathematical Biosciences and Engineering, 2020, 17(4): 3618-3636. doi: 10.3934/mbe.2020204


 DownLoad: