
Citation: Joek Peuchen, Bart M.L. Meijninger, Daniël Brouwer. North Sea as geo database[J]. AIMS Geosciences, 2019, 5(2): 66-81. doi: 10.3934/geosci.2019.2.66
[1] | Leszek J. Kaszubowski . Seismic profiling of the sea-bottom in recognition of geotechnical conditions. AIMS Geosciences, 2020, 6(2): 199-230. doi: 10.3934/geosci.2020013 |
[2] | Santiago Quinteros, Aleksander Gundersen, Jean-Sebastien L'Heureux, J. Antonio H. Carraro, Richard Jardine . Øysand research site: Geotechnical characterisation of deltaic sandy-silty soils. AIMS Geosciences, 2019, 5(4): 750-783. doi: 10.3934/geosci.2019.4.750 |
[3] | Elvis Ishimwe, Richard A. Coffman, Kyle M. Rollins . Predicting blast-induced liquefaction within the New Madrid Seismic Zone. AIMS Geosciences, 2020, 6(1): 71-91. doi: 10.3934/geosci.2020006 |
[4] | Aleksander S. Gundersen, Pasquale Carotenuto, Tom Lunne, Axel Walta, Per M. Sparrevik . Field verification tests of the newly developed flow cone tool—In-situ measurements of hydraulic soil properties. AIMS Geosciences, 2019, 5(4): 784-803. doi: 10.3934/geosci.2019.4.784 |
[5] | Aleksander S. Gundersen, Ragnhild C. Hansen, Tom Lunne, Jean-Sebastien L’Heureux, Stein O. Strandvik . Characterization and engineering properties of the NGTS Onsøy soft clay site. AIMS Geosciences, 2019, 5(3): 665-703. doi: 10.3934/geosci.2019.3.665 |
[6] | Richard W. Stoffle, Kathleen A. Van Vlack, Heather H. Lim, Alannah Bell, Landon Yarrington . Breaking the Clovis glass ceiling: Native American oral history of the Pleistocene. AIMS Geosciences, 2024, 10(3): 436-459. doi: 10.3934/geosci.2024023 |
[7] | Annika Bihs, Mike Long, Steinar Nordal, Priscilla Paniagua . Consolidation parameters in silts from varied rate CPTU tests. AIMS Geosciences, 2021, 7(4): 637-668. doi: 10.3934/geosci.2021039 |
[8] | Øyvind Blaker, Roselyn Carroll, Priscilla Paniagua, Don J. DeGroot, Jean-Sebastien L'Heureux . Halden research site: geotechnical characterization of a post glacial silt. AIMS Geosciences, 2019, 5(2): 184-234. doi: 10.3934/geosci.2019.2.184 |
[9] | Vadim Khomich, Svyatoslav Shcheka, Natalia Boriskina . Geodynamic factors in the formation of large gold-bearing provinces with Carlin-type deposits on continental margins in the North Pacific. AIMS Geosciences, 2023, 9(4): 672-696. doi: 10.3934/geosci.2023036 |
[10] | Elmar Buchner, Volker J Sach, Martin Schmieder . Ries impact deposits in the North Alpine Foreland Basin of Germany as a terrestrial analog site for impact-produced seismites and sand spikes on planet Mars. AIMS Geosciences, 2025, 11(1): 68-90. doi: 10.3934/geosci.2025005 |
Abbreviations: 1D: One dimensional; 2D: Two dimensional; 3D: Three dimensional; ANN: Artificial neural network; BRO: Subsurface key register (basis registratie ondergrond in Dutch); BSF: Below seafloor; CPT: Cone penetration test; DGM: Digital geological model; MBES: Multibeam echosounder; T-CPT: Temperature cone penetration test; UHR: Ultra high resolution
The activity level for the Dutch sector of the North Sea (Figure 1) is high and changing. Assets for wind energy are rapidly expanding. In contrast, existing facilities for oil and gas will gradually be decommissioned. Re-use of some of these facilities is being considered for production of hydrogen, CO2 capture/storage in depleted gas fields, geothermal applications [1,2]. In addition, demand for agammaegates extraction from the seabed will increase in the coming decades. Specifically, increasing volumes of sands are needed for coastal defence and maintenance, preventing erosion and flooding driven by predicted climate change and associated sea level rise [3].
These ongoing and future activities require geodata, defined as information for geotechnical assessment of the seabed (ground below the seafloor, where seafloor is the interface between seawater and seabed) to about 100 m below seafloor (BSF), including assessment of geohazards.
Public-domain geodata are increasingly available in an easily accessible form, fuelled in part by a licensing approach in which the Dutch government legislated as mandatory the use of geotechnical and geological data provided by the government. These data are made available to tenderers for licenses to design and operate offshore wind farms (Figure 2).
A recently adopted Dutch law [4] sets requirements for improved open (digital) access to geodata concerning the onshore part of the country as well as the Dutch sector of the North Sea.
The increasing availability of high-quality geodata generates new interests and opportunities, not only for exploiting the geodata for geotechnical applications but also for applications not covered by this paper, such as monitoring of impact of climate change, CO2 and H2 storage, archaeology and marine biology.
The Dutch sector of the North Sea covers an area of about 57,000 km2. Water depths are up to 70 m. The stratigraphy to 100 m BSF reflects the Holocene and Late Pleistocene geological history (last 126,000 years), except in the south where units may be up to 50 million years old. The geological map of Figure 3 gives an impression of (buried) geomorphological features (such as barrier islands and infilled channels), various soil types, their depositional extent and interpreted depositional environment. Particularly, the colours of Figure 3 represent geological units of clastic sediments deposited in marine, coastal, tidal, fluvial, aeolian or glacial environments; yellow and green colours typically represent Holocene units of coastal and tidal deposits; brown represents Holocene peat; olive-green represents Pleistocene coastal and marine deposits; red and pink colours represent Pleistocene glacial deposits. Pleistocene sediments either outcrop at seafloor or are overlain by a thin layer of Holocene sediments.
The relatively recent geology is complex because it represents a number of episodes of relatively rapid climatic changes and glaciations that had a profound effect on sea levels, soil depositional processes, geomorphology and vegetation.
During glacial periods, sea level fell (up to about 100 m) and ice sheets advanced from the north (Britain and Scandinavia), covering much of the dry North Sea basin. The advancing ice sheets deformed, eroded and reworked sediments that were deposited earlier, creating deeply incised valleys and ice-pushed ridges. Where ice sheets were absent, sediments were transported by wind and by braided river systems of the Rhine and the Meuse in tundras and polar deserts. The shallow subsurface was subjected to permafrost conditions [7,8].
At present, geodata for the Dutch sector of the North Sea are mainly held by:
a) Owners and suppliers of offshore and coastal facilities-various types of geological and geotechnical data;
b) TNO (www.tno.nl), with the Dutch government as one of the principal stakeholders—borehole sample descriptions, geo-acoustic data from seismic reflection and side-scan sonar surveys, particle size analyses, micropalaeontology, age analyses, subsurface models (DINOloket [10] and NLOG [11]);
c) Hydrographic Service of the Royal Netherlands Navy (www.hydro.nl)—bathymetry;
d) North Sea Directorate, Rijkswaterstaat (www.noordzeeloket.nl, www.informatiehuismarien.nl)—bathymetry, abiotic seafloor data related to ecological monitoring;
e) Deltares (www.deltares.nl)—seafloor sample descriptions and shallow seismic reflection data;
f) Wageningen Marine Research (www.wur.nl)—abiotic seafloor data related to ecological monitoring;
g) NIOZ (www.nioz.nl)—abiotic seafloor data primarily related to ecological monitoring;
h) 4TU.Centre for Research Data (https://data.4tu.nl/)—a repository for project-based academic datasets including those on large-scale coastal erosion management.
The resulting fragmentation of data, including partial overlap, complicates accessibility and therefore usage:
a) No access or uncertain access, i.e. it may not be clear which party holds the geodata and if the data are classified as proprietary or as intellectual property;
b) Difficult access, i.e. geodata that are accessible to persons within the owner organisation and to external parties that know how to get access;
c) Paid access, for example through licensing fees;
d) Open access, through web-based portals such as DINOloket, NLOG, offshorewind.rvo.nl, and 4TU.
Traditionally, exploration surveys performed by commercial parties in search for hydrocarbons in the North Sea are subject to the Mining Act, which stipulates a single-client moratorium of five years and a multi-client moratorium of 10 years. Initially confidential results are generally not published.
Significantly more re-use value of geodata has been generated for planned and existing offshore facilities, infrastructure, and dredging areas. Part of these geodata is included in web-based portals with open access.
In the course of 50 years, a large collection of geodata of the seafloor and seabed have been acquired as part of 1:100,000 to 1:250,000 mapping by the Geological Survey of the Netherlands. The geodata collected during numerous reconnaissance surveys include geological/geotechnical sample descriptions and test results, single beam echosounder data and seismic reflection data. On the basis of these geodata, the Geological Survey of the Netherlands produced maps of surficial sediment, Quaternary geology and solid (pre-Quaternary) geology [12,13]. Some of these maps present basic geotechnical information, with relevant properties of various geological units. They summarise the underlying field data and provide a regional overview, facilitating the use of subsurface information by end users and decision makers.
The RVO database was initiated around 2015, primarily in support of a novel licensing approach providing public geotechnical and geological data to tenderers for contracts for wind farm development and operation (Figure 2). The high-quality geodata include detailed 2D data and 1D ground investigation data. The 2D data mostly comprise interpreted results of high-resolution seismic reflection surveys. The ground investigation data typically comprise cone penetration test (CPT) results, S-wave velocity derived from seismic downhole tests, soil sample descriptions, soil sample classifications and results of geotechnical laboratory tests. It can be noted here that a combination of 2D geophysical data + 1D ground investigation data is much more common for the marine environment than for an onshore setting. The RVO website allows access to these datasets as far as can be handled online. More voluminous data are provided upon request on hard disk drives.
The DINO (Data and Information on the Dutch Subsurface) and NLOG (Netherlands Oil and Gas) repositories include onshore and offshore data. The available geodata have enabled the development of a number of digital layer and voxel models of the deep and shallow subsurface [14]. Further details are given in Table 1.
BRO Subsurface Key Register | ||
Databases/repositories | Data type and description | Remarks |
DINOloket—Data and information on the Dutch subsurface www.dinoloket.nl [ |
-Geological borehole data, including borehole log profiles, sample descriptions, soil classifications, sample photographs, results of chemical analyses, particle size distributions and geophysical well logging profiles. Typical depth range to about 12 m below ground surface (seafloor). Geodata for > 500,000 locations onshore and offshore, acquired from as early as 1605 to present | High data density for onshore; low density offshore |
-Archaeological borehole data, including borehole log profiles and sample photographs. Typical depth range to about 2.5 m below ground surface. Information for > 10 000 locations acquired from 1980 | Only onshore | |
-Pedological borehole data, i.e. soil information. Depth range to about 15 m below ground surface. Information acquired from about 1950 to the present. | Only onshore | |
-Seafloor sediment data, including sample descriptions, results of chemical analyses and particle size distributions -Information for > 4 400 locations acquired from 1934 | Only offshore | |
-Geotechnical cone penetration test (CPT) data. Typical depth range to about 20 m below ground surface. Geodata for > 175,000 locations onshore and offshore, acquired from 1937 | High density for onshore; low density offshore | |
-Soil resistivity measurements along survey lines, including interpreted stratigraphic models. Depth range to about 1000 m below ground surface. Geodata acquired from about 1900 to the present | Only onshore | |
-Groundwater monitoring data, including groundwater levels and results of chemical analyses. Information from > 84 000 ground water monitoring wells acquired from 1852 | Only onshore | |
-Shallow seismic reflection data | Planned | |
-Stratigraphic models: 3D voxel model GeoTOP, Digital Geological Model DGM, hydrogeological model REGIS II, Digital Geological Model DGM-deep | Currently only onshore | |
NLOG—Information about oil, gas, geothermal energy exploration and production in the Netherlands and the Dutch sector of the North Sea, acquired under the Mining Act www.nlog.nl [11] | -Borehole data, including borehole log profiles, lithostratigraphy, core and other sample measurements and geophysical well logging profiles | Onshore and offshore |
-Seismic reflection data (2D and 3D) | ||
-Hydrocarbon production data and reservoir injection data | ||
-Information on field and production licenses of developed fields | ||
-Models, maps and spatial datasets | ||
BIS—Soil information system (pedology) maps.bodemdata.nl/bodemdatanl/index.jsp [15] | - Pedological borehole data, i.e. soil | Only onshore |
information | ||
-Groundwater information | ||
-Thematic soil information maps |
A recently adopted (2018) Dutch law sets requirements for improved open (digital) access to geodata in which the Dutch government is stakeholder. The law includes requirements for a so-called Subsurface Key Register ("Basis Registratie Ondergrond" or "BRO" in Dutch). The law also describes the roles and responsibilities of the primary stakeholders in the BRO database.
The BRO database [4] combines, harmonises, unifies and builds on existing databases, as illustrated in Table 1. The BRO database will assimilate the databases of DINOloket [10], NLOG [11] and BIS [15]. No incorporation of geodata from other databases is currently planned. The BRO database meets the requirements and standards set by the European INSPIRE (Infrastructure for Spatial Information in Europe) directive [4,16]. INSPIRE seeks to make good quality geo-information which is findable, accessible, inter-operable and re-usable. Database content should be harmonised across national boundaries, e.g. align with similar initiatives by The Crown Estate (UK) and Fraunhofer (Germany).
The purpose of the BRO database, which assembles and disseminates data and data products collected by and for the government, is efficient exchange and re-use of geodata as input for (national) policy, planning and feasibility decisions for future activities regarding (a) infrastructure, (b) natural resources (e.g. ground water, minerals/agammaegates, oil and gas, geothermal energy) and (c) subsurface storage (e.g. CO2, hydrogen).
The BRO database includes or will include (a) information acquired during surveys or site investigations commissioned by governmental organisations, (b) data related to the utilization of natural resources in the subsurface (such as oil and gas, geothermal energy), underground constructions, and (c) user rights, where applicable. The BRO database contains public as well as private input, and excludes information held by the Hydrographic Service.
As the BRO database will still be under development well into the 2020s, its development and implementation follows a phased approach for the various datatypes to be incorporated. The usual "big data" challenges apply to its assembly and distribution via a web-based portal. CPT profiles, borehole descriptions and groundwater-monitoring data are the first fully operable registration objects. As of January 2019, they are actively updated by data owners and other source holders.
All information and models in the BRO database will be open access, with the exception of data designated to be (temporarily) confidential under the Mining Act [4].
The BLUE PILOT joint industry project [17] included a major offshore trial of the innovative BLUE 25M pile driving hammer, specifically developed for the installation of monopiles for wind turbine generators (Figure 4). The trial comprised the installation and retrieval of a 6.5 m diameter monopile at CPT location HKZ3-CPT07 (Figure 5). This test location was selected from a large number of publicly available high-quality CPTs [6]. Particularly, the selection process focused on identifying a test site showing (very) high cone resistance and expected high resistance to pile installation by impact driving. Figure 6 shows the soil profile, where qc is CPT cone resistance and Ic is soil behaviour type index. Ic values are typically less than 2, indicating sand.
The prediction of migration rates for sand banks and sand waves is important for decisions on topics such as optimisation of dredging strategies for shipping. Toodesh and Verhagen [18] report on trials of predictive algorithms, using a long time series of multibeam echosounder (MBES) data (Figure 7).
The power cable network in the Dutch sector of the North Sea is rapidly expanding, reflecting an increasing need of (1) long-distance interconnector cables for efficiencies in (international) balancing of electricity demand and supply, (2) wind farm connections to shore and (3) local connections to wind turbine generators. Input on soil thermal characteristics is required for cable design and monitoring. Vardon et al. [19] reported on a novel test method for in situ thermal characteristics of soils (Figure 8). The method is based on temperature cone penetration testing (T-CPT). Validation of the test method included the use of detailed in situ test data and laboratory test data available in the RVO database, www.rvo.nl [6].
The detailed and high-quality geodata for the Borssele wind farm provide opportunities for optimising and advancing the integration of geophysical and geotechnical data in a three-dimensional seabed model.
The Borssele site is near the southern border of the Dutch sector of the North Sea (Figure 2). It shows well-developed, relatively uniform, tilted Palaeogene and Neogene strata overlain by Quaternary glacial and Holocene marine sediments. Figure 9 illustrates the Borssele setting, noting that the horizontal scale is distance in metres and the vertical scale is in metres relative to lowest astronomical tide. Units A through F represent combined seismo-stratigraphic and geotechnical units. CPT cone resistance data (red line) are within a grey box, where the width of box represents 0 to 50 MPa.
Graaf [20] used geodata of the Borssele wind farm for optimising the selection of interpolation methods for the calculation of gridded depth and thickness (isopach) maps of geological/ geotechnical units. The optimisation study focused on the acquisition geometry (survey track lines) of the geophysical survey. It was concluded that optimum results with minimum effects of acquisition geometry could be accomplished by using the natural neighbour kriging method. In addition, uncertainties in interpolated results could be visualized with adaptable grid cell size using a quad tree decomposition, an image processing technique. Figure 10 illustrates that depth information of the geological/geotechnical units (i.e. the marker points of the interpreted horizons) is located along the survey track lines, having the lowest uncertainty and therefore the smallest grid cell size along the survey track lines. The grid cell size and uncertainty increase with increasing distance from the survey track lines. The overlying raster of varying grid cell sizes (Figure 10) illustrates the degree of interpolation uncertainty/data density.
Minorenti et al. [21] investigated 3D modelling of geotechnical parameters. The Borssele 1D cone resistance CPT data and gridded 2D ultra high resolution (UHR) seismic reflection data were modelled in three dimensions using a kriging variogram. The Quaternary strata of the Borssele area are oriented horizontally while the pre-Quaternary strata are slightly tilted to the north east. The two strata are separated by an angular unconformity at base Unit B (see Figure 9). The angular unconformity is incorporated using unit B as a cut-off grid for two separate models: one horizonal Quaternary model and one slightly tilted pre-Quaternary model. The tilting of the pre-Quaternary strata was modelled using weighted kriging formulas along the tilted strata. Figure 11 illustrates the resulting voxel model for ranges of CPT cone resistance data in the Borssele 3 & 4 wind farm zone. This figure shows cone resistance values using 1D CPT, with input positions displayed as vertical lines and with output voxel colour coded and masked in (about) 9 MPa ranges for CPT cone resistance qc. Seismic reflectors are displayed as 3D surfaces in greyscale. The model projection is along strike of the slightly dipping strata. Minorenti et al. [21] found that removing about 20% of the input data did not lead to a significant change of the model. This suggests a relatively homogenous site and a reliable model.
Sauvin et al. [22] considered the Borssele CPTs, seismic downhole test results and 2D UHR seismic data for 3D predictive models. The use of an Artificial Neural Network (ANN) allowed prediction of "synthetic" CPT results at any point of the Borssele site. This approach may be complementary to ANNs adopted by Van Maanen et al. [23], who developed automated geological interpretation of CPT data as input for large-scale 3D geological models of the onshore Dutch subsurface. The ANN method transforms CPT measurements into lithological classes. A nation-wide training set of 169 paired CPTs and high-resolution borehole data with detailed soil descriptions and classifications was used. To ensure broad coverage, locations with differing geological architecture, composition and history were chosen. The study indicated that the best performing ANN was more sensitive to changes in CPT values and more accurate than the widely applied classification chart of Robertson [24]. The ANN method resulted in better classification performance for the lithoclasses, as well as better detection of small-scale alterations of different lithoclasses. It is expected that this method can be successfully applied in offshore areas having a high density of CPT data, e.g. windfarms and coastal port extensions.
The North Sea geo database offers high-value opportunities for (national) policy, planning and feasibility decisions on future activities regarding (1) marine (energy) infrastructure, (2) natural resources (e.g. ground water, minerals/agammaegates, oil and gas, geothermal energy) and (3) subsurface storage (e.g. CO2, hydrogen). Open and easy access will stimulate the development of add-on capabilities (such as apps) by third parties, increasing the value of what can be considered to be big data of the seabed, and facilitating their integration with other types of information in decision making [25].
The management of marine seismic reflection data, including seismic cubes from 3D surveys, presents particular data science challenges, with digital information typically amounting to multiples of terabytes. Furthermore, the expected increase in 3D UHR seismic reflection data may increase the typical big-data difficulties regarding use of energy (kWh), required efficiency (time) and reliable extraction of value [14]. Simplified "expert" modelling may be necessary for some time to come.
The geo database includes high-quality geophysical and geotechnical data. This allows testing and validation of new methods for site investigation and integration of geophysical data, CPT results and sample data for mapping and ground modelling purposes.
The authors would like to thank Dr Sytze van Heteren (TNO-GDN) for valuable comments on earlier versions of the paper.
The author declares that there is no conflict of interest associated with this research.
[1] | North Sea Energy, North Sea energy atlas-story map, 2018. Available from: https://www.north-sea-energy.eu/atlas.html . |
[2] | Nexstep National Platform For Re-Use & Decommissioning, Re-use & decommissioning report 2018, 2018. Available from: https://nexstep.nl/re-use-decommissioning-report-2018. |
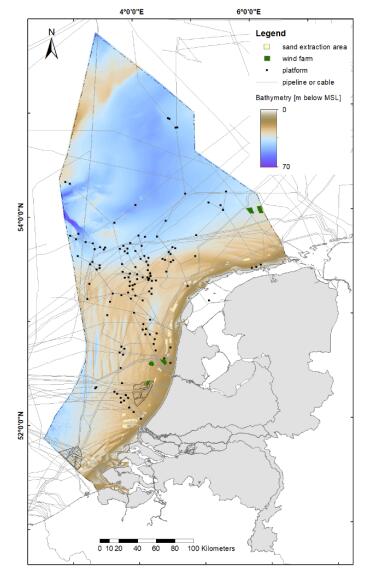
[3] | Noordzeeloket, Surface mineral extraction, 2018. Available from: https://www.noordzeeloket.nl/en/functions-and-use/artikel-baseline. |
[4] | BZK Ministerie van Binnenlandse Zaken en Koninkrijk Relaties-Programmabureau BRO, Ketenontwerp BRO, De Basisregistratie Ondergrond nader verklaard, 2018. Available from: https://www.digitaleoverheid.nl/voorzieningen/gegevens/inhoud-basisregistraties/bro/. |
[5] | Rijkswaterstaat, Data portal, 2018. Available from: https://geoservices.rijkswaterstaat.nl/apps/geonetwork/srv/dut/catalog.search#/home. |
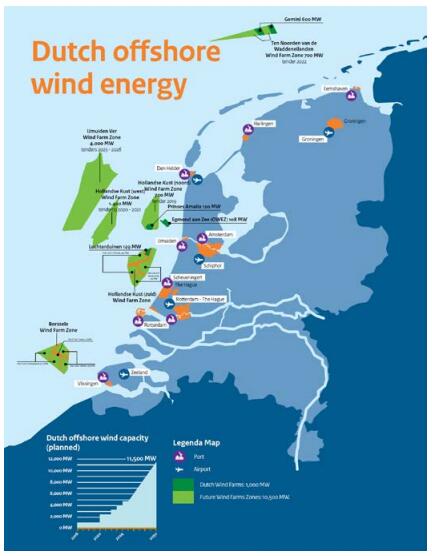
[6] | RVO Rijksdienst voor Ondernemend Nederland, Offshore wind energy, 2018. Available from: https://english.rvo.nl/subsidies-programmes/sde/offshore-wind-energy. |
[7] | Laban C (1995) The Pleistocene Glaciations in the Dutch Sector of the North Sea: A Synthesis of Sedimentary and Seismic Data, University of Amsterdam. |
[8] | De Gans W (2007) Quaternary. In Wong TE, Batjes DAJ, de Jager J, Eds., Geology of the Netherlands, Royal Netherlands Academy of Arts and Sciences, 173–195. |
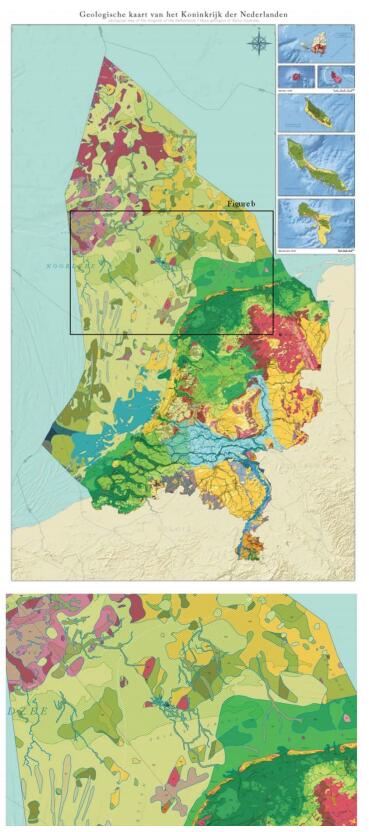
[9] | GDN (2018). Geological Overview Map of the Kingdom of the Netherlands 1:600,000 (centennial edition), Utrecht: TNO-Geological Survey of the Netherlands, 1 map sheet. |
[10] | DINOloket Data and Information of the Dutch Subsurface, 2018. Available from: https://www.dinoloket.nl/. |
[11] | NLOG information about oil, gas and geothermal energy exploration and production in the Netherlands and the Dutch sector of the North Sea continental shelf, 2018. Available from: https://www.nlog.nl/. |
[12] | Stolk A, Laban C (2002) The Dutch Sector of the North Sea, a geological introduction. Hydro International, December. |
[13] | Laban C, Geschiedenis geologisch kartering Noordzeebodem, 2011. Available from: http://www.historie-oceanografie.nl/hocdocs/methoden/geschiedenisgeologischekartering noordzeebodem. |
[14] | Van der Meulen MJ, Doornenbal JC, Gunnink JL, et al. (2013) 3-D geology in a 2D country: perspectives for geological surveying in the Netherlands. Neth J Geosci 92: 217–241. |
[15] | Dutch Soil Information System, 2018. Available from: https://www.wur.nl/en/Research-Results/Research-Institutes/Environmental-Research/Fac ilities-Products/Dutch-Soil-Information-System-SIS.htm. |
[16] | INSPIRE Infrastructure for Spatial Information in Europe, 2018. Available from: https://inspire.ec.europa.eu/. |
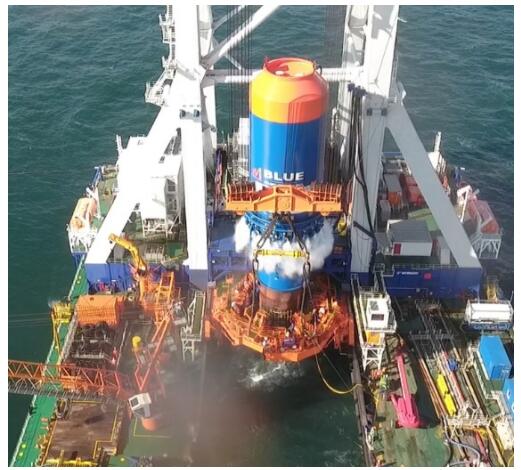
[17] | Carbon Trust, Blue pilot; a new joint industry project targeted at reducing the costs of offshore wind installation and reducing underwater noise during construction, 2018. Available from: https://www.carbontrust.com/offshore-wind/owa/demonstration/blue-pilot/. |
[18] |
Toodesh R, Verhagen S (2018) Adaptive, variable resolution grids for bathymetric applications using a quadtree approach. J Appl Geodesy 12: 311–322. doi: 10.1515/jag-2017-0043
![]() |
[19] | Vardon PJ, Baltoukas D, Peuchen J (2018) Interpreting and validating the thermal cone penetration test (T-CPT). Géotechnique, 1–13. |
[20] | Graaf van der SC, Natural neighbour kriging and its potential for quality mapping and grid design, TU Delft, 2016. Available from: http://resolver.tudelft.nl/uuid:631281d0-e77c-465b-9562-b7ce788dd9cc. |
[21] | Minorenti V, Brouwer DRH, Van Kesteren W (2017) 3D ground model using geophysical and geotechnical data-a case study from the Netherlands. In Near Surface Geoscience 3–7 September, Malmö, Sweden, We 23 A08. |
[22] | Sauvin G, Vanneste M, Madshus C (2018) High-resolution quantitative ground-model for shallow subsurface. In Near Surface Geoscience Conference & Exhibition 2018, 9–12 September 2018, Porto, Portugal, Mo3 ASM 03. |
[23] | Van Maanen PP, Harting R, Schokker J, et al. (2018) Geological interpretation of cone penetration test data by artificial neural networks to model the subsurface of the Netherlands in 3D. Comput Geosci, In press. |
[24] | Robertson PK (2009) Performance based earthquake design using the CPT. In Kokusho T, Tsukamoto Y , Yoshimine M, Eds., Performance-based design in Earthquake Geotechnical Engineering-from Case History to Practice: Proceedings of the International Conference on Performance-based design in Earthquake Geotechnical Engineering (IS-Tokyo 2009), 15–18 June 2009, Boca Raton: CRC Press, 3–20. |
[25] | EMODnet, Data ingestion portal, 2018. Available from: https://www.emodnet-ingestion.eu. |
1. | Jean-Sebastien L’Heureux, Tom Lunne, Characterization and Engineering properties of Natural Soils used for Geotesting, 2020, 6, 2471-2132, 35, 10.3934/geosci.2020004 | |
2. | Tiago M. Alves, Nathalia H. Mattos, Sarah Newnes, Sinéad Goodall, Analysis of a basement fault zone with geothermal potential in the Southern North Sea, 2022, 102, 03756505, 102398, 10.1016/j.geothermics.2022.102398 | |
3. | Nikolaos-Kimon Chtouris, Thomas Hasiotis, Marine Geotechnical Research in Greece: A Review of the Current Knowledge, Challenges and Prospects, 2024, 12, 2077-1312, 1708, 10.3390/jmse12101708 |
BRO Subsurface Key Register | ||
Databases/repositories | Data type and description | Remarks |
DINOloket—Data and information on the Dutch subsurface www.dinoloket.nl [ |
-Geological borehole data, including borehole log profiles, sample descriptions, soil classifications, sample photographs, results of chemical analyses, particle size distributions and geophysical well logging profiles. Typical depth range to about 12 m below ground surface (seafloor). Geodata for > 500,000 locations onshore and offshore, acquired from as early as 1605 to present | High data density for onshore; low density offshore |
-Archaeological borehole data, including borehole log profiles and sample photographs. Typical depth range to about 2.5 m below ground surface. Information for > 10 000 locations acquired from 1980 | Only onshore | |
-Pedological borehole data, i.e. soil information. Depth range to about 15 m below ground surface. Information acquired from about 1950 to the present. | Only onshore | |
-Seafloor sediment data, including sample descriptions, results of chemical analyses and particle size distributions -Information for > 4 400 locations acquired from 1934 | Only offshore | |
-Geotechnical cone penetration test (CPT) data. Typical depth range to about 20 m below ground surface. Geodata for > 175,000 locations onshore and offshore, acquired from 1937 | High density for onshore; low density offshore | |
-Soil resistivity measurements along survey lines, including interpreted stratigraphic models. Depth range to about 1000 m below ground surface. Geodata acquired from about 1900 to the present | Only onshore | |
-Groundwater monitoring data, including groundwater levels and results of chemical analyses. Information from > 84 000 ground water monitoring wells acquired from 1852 | Only onshore | |
-Shallow seismic reflection data | Planned | |
-Stratigraphic models: 3D voxel model GeoTOP, Digital Geological Model DGM, hydrogeological model REGIS II, Digital Geological Model DGM-deep | Currently only onshore | |
NLOG—Information about oil, gas, geothermal energy exploration and production in the Netherlands and the Dutch sector of the North Sea, acquired under the Mining Act www.nlog.nl [11] | -Borehole data, including borehole log profiles, lithostratigraphy, core and other sample measurements and geophysical well logging profiles | Onshore and offshore |
-Seismic reflection data (2D and 3D) | ||
-Hydrocarbon production data and reservoir injection data | ||
-Information on field and production licenses of developed fields | ||
-Models, maps and spatial datasets | ||
BIS—Soil information system (pedology) maps.bodemdata.nl/bodemdatanl/index.jsp [15] | - Pedological borehole data, i.e. soil | Only onshore |
information | ||
-Groundwater information | ||
-Thematic soil information maps |