Nd | 1 | 2 | 3 | 4 | 5 | 6 | 7 |
ε | 0.83 | 0.83 | 0.85 | 0.84 | 0.82 | 0.80 | 0.81 |
δm [μm] | 8.0 | 11.9 | 18.1 | 20.9 | 22.3 | 24.0 | 28.0 |
Citation: Margarethe Draga, Martin Scaal, Felicitas Pröls. Signaling filopodia in avian embryogenesis: formation and function[J]. AIMS Molecular Science, 2016, 3(4): 683-691. doi: 10.3934/molsci.2016.4.683
[1] | Maurizio Verri, Giovanna Guidoboni, Lorena Bociu, Riccardo Sacco . The role of structural viscoelasticity in deformable porous media with incompressible constituents: Applications in biomechanics. Mathematical Biosciences and Engineering, 2018, 15(4): 933-959. doi: 10.3934/mbe.2018042 |
[2] | Aftab Ahmed, Javed I. Siddique . The effect of magnetic field on flow induced-deformation in absorbing porous tissues. Mathematical Biosciences and Engineering, 2019, 16(2): 603-618. doi: 10.3934/mbe.2019029 |
[3] | Hatim Machrafi . Nanomedicine by extended non-equilibrium thermodynamics: cell membrane diffusion and scaffold medication release. Mathematical Biosciences and Engineering, 2019, 16(4): 1949-1965. doi: 10.3934/mbe.2019095 |
[4] | Ching-Han Huang, Yu-Min Wang, Shana Smith . Using high-dimensional features for high-accuracy pulse diagnosis. Mathematical Biosciences and Engineering, 2020, 17(6): 6775-6790. doi: 10.3934/mbe.2020353 |
[5] | Marya L. Poterek, Mauricio Santos-Vega, T. Alex Perkins . Equilibrium properties of a coupled contagion model of mosquito-borne disease and mosquito preventive behaviors. Mathematical Biosciences and Engineering, 2025, 22(8): 1875-1897. doi: 10.3934/mbe.2025068 |
[6] | Nilay Mondal, Koyel Chakravarty, D. C. Dalal . A mathematical model of drug dynamics in an electroporated tissue. Mathematical Biosciences and Engineering, 2021, 18(6): 8641-8660. doi: 10.3934/mbe.2021428 |
[7] | Jianguo Xu, Cheng Wan, Weihua Yang, Bo Zheng, Zhipeng Yan, Jianxin Shen . A novel multi-modal fundus image fusion method for guiding the laser surgery of central serous chorioretinopathy. Mathematical Biosciences and Engineering, 2021, 18(4): 4797-4816. doi: 10.3934/mbe.2021244 |
[8] | Yafei Liu, Linqiang Yang, Hongmei Ma, Shuli Mei . Adaptive filter method in Bendlet domain for biological slice images. Mathematical Biosciences and Engineering, 2023, 20(6): 11116-11138. doi: 10.3934/mbe.2023492 |
[9] | Panagiotes A. Voltairas, Antonios Charalambopoulos, Dimitrios I. Fotiadis, Lambros K. Michalis . A quasi-lumped model for the peripheral distortion of the arterial pulse. Mathematical Biosciences and Engineering, 2012, 9(1): 175-198. doi: 10.3934/mbe.2012.9.175 |
[10] | Yi Ren, Guolei Zhang, Longbin Yang, Yanwei Hu, Xiaojing Nie, Zhibin Jiang, Dawei Wang, Zhifan Wu . Study on seafloor hydrothermal systems circulation flow and heat transfer characteristics. Mathematical Biosciences and Engineering, 2022, 19(6): 6186-6203. doi: 10.3934/mbe.2022289 |
In the medical field, it is of interest in measuring the uptake of certain fluids that are indicators of corresponding complications. One way to do so is placing a scaffold on the spot where those biological fluids may be present. Such scaffolds are typically of porous nature and may contain also nanoparticles for structure reinforcement. The porous scaffolds have their own properties depending on the porosity and nanoparticle content, besides the scaffold itself. The properties in question may be of thermal, electrical or mass diffusional nature. When the scaffold absorps some biological fluid, it is natural to say that this changes the aforementioned properties. We are interested here by the thermal properties. By introducing thermal pulses of high frequency on one side of such a porous scaffold and measuring the response on the other side, one is able to deduce from the response whether some biological fluid has been taken up. Since many factors may play a role in such an analysis, modelling can provide for useful tools that can be used to compose such sensors. It is well known that Fourier's law is not valid for high pulse responses. For information from biosensors in case of continuous monitoring, other models should be proposed. We propose a model that can be used for such purposes concerning a porous medium, in which nanoparticles are dispersed. Besides the model representing the evolution of the heat flux and the temperature, we need also a model that describes how the thermal diffusion through the porous medium is affected by the biological fluid uptake. We propose to do this by using an effective thermal conductivity, adapted from [1,2]. This effective thermal conductivity is valid at the condition that the thermal conductivity of the scaffold is much higher than that of air and the nanoparticles. This is justified since we use as scaffold a medium self-assembled from carbon nanotubes (CNT), wherein silica (SiO2) nanoparticles are embedded for reinforcement and alignment of the CNTs for a better conductivity [3]. The fabrication process and characterisation of this scaffold has been presented in previous work [3]. Since it is important to use a correct effective thermal conductivity, we validate this against experiments of self-assembled CNT-SiO2 porous nanocomposites.
The self-assembly procedure is applied in various forms in many fields [4,5,6,7,8,9,10,11,12]. The one against which we validate the effective thermal conductivity is explained in details in [3]. Essentially it resumes to the following. By using drop-by-drop evaporation of aqueous solutions of CNT and SiO2, we deposit multiple self-assembled layers of CNTs and SiO2 on a substrate. The obtained dry residu is a porous structure that, depending on the initial parametric conditions, can have different properties. As mentioned before, the focus is on the thermal conductivity. The porosity of the scaffolds and the volume fraction of the nanoparticles are also determined from those experiments. The data are imported in our model, leading to a heat flux and temperature evolution depending on the porosity and volume fraction of the scaffold medium. Since in the model used for the effective thermal conductivity, the thermal conductivity of air and the nanoparticles are considered to be negligible with respect to that of CNT, it is solely dependent on the porosity and nanoparticles. The biological fluid that is being taken up in the scaffold has also a thermal conductivity negligible to that of CNT, so that it can be treated on the same level as the nanoparticles. So, an uptake of the biological fluid is equivalent to an increase of the volume fraction of nanoparticles in the scaffold. The idea is to impose high-frequency temperature pulses and calculating their response at the other side. By varying the volume fraction, one is able to calculate the response to a fixed heat pulse, being indicative of measuring biological fluid intake. Our model is developed in section 2 and the experimental data needed for the model in section 3. Section 4 discusses the results and section 5 concludes.
A previously developed model from Extended Thermodynamics proposes constitutive equations for the thermal transport taking into account non-localities [13]. In case the system size is much larger than the mean free path of the thermal carriers, a one-dimensional version of the constitutive equation for the heat flux, q can be given by
τr∂tq+q=−λeff∂xT | (1) |
where τr,t,x,λeff and T are the relaxation time of the heat flux, the time and space coordinates, the effective thermal conductivity and the temperature, respectively. The one-dimensional balance equation for energy is
ρcp∂tT=−∂xq | (2) |
with ρ and cp the density and heat capacity, respectively. In (1)-(2), the thermal conductivity for a porous structure is given by [2,14].
λp=λ02−2ε2+ε. | (3) |
where λ0 denotes the thermal conductivity for the bulk material, and ε stands for its porosity. If nanoparticles are homogeneously inserted in such a porous matrix (for instance, by depositing a droplet containing a mixture of CNTs and nanoparticles) then, for the thermal conductivity, (3) should be adapted:
λeff=λp2−2φ2+φ=λ02−2ε2+ε2−2φ2+φ, | (4) |
where λp=λ02−2ε2+ε is the volume fraction of the nanoparticles. Note that in (3)-(4), simplifications are introduced with respect to [2,14], because of the much higher thermal conductivity of CNT with respect to air and even with respect to the silica nanoparticles. The difference in the phonon relaxation times of CNTs, SiO2 and biological fluids being less important here than the difference in thermal conductivity, we will assume that its dependence on the volume fraction is negligible, so that:
τr=τr0 | (5) |
with τr0 the relaxation time of the bulk material. For computational purposes, our model is rendered dimensionless. We choose for the time scale τr0, for the spatial scale the system's size δ, for the heat flux λ0ΔTδ, and for the temperature T→T−T0ΔT. Herein, ΔT=Ti−T0, where the subscripts i and 0 indicate a maximum and minimum temperature to which the material is exposed to. In case there is an imposed oscillatory boundary temperature, Ti would stand for the peak maximum temperature and T0 for the peak minimum temperature, which is also chosen to be the initial one. This gives for heat transport, writing the same symbols for the dimensionless quantities, the following set of equations
∂tq+q=−2−2ε2+ε2−2φ2+φ∂xT | (6) |
∂tT=−αth∂xq | (7) |
with αth=τr0τth, the thermal diffusion characteristic time being defined by τth=δ2κth, with κth=λ0ρcp the thermal diffusivity. The boundary conditions are given by a zero-heat-flux condition, i.e. q = 0 (which means a zero-temperature-gradient in virtue of (1)) at the measuring point (x = 0) and an imposed oscillatory temperature at the other side (x = 1), with frequency ω=P/τr0, where P is a value determining the periodicity of the oscillations with respect to the relaxation time. The dimensionless versions are
∂xT|x=0=0 | (8) |
T|x=1=12(1−cos(2Pπt)) | (9) |
For convenience, the form of boundary condition (9) has been chosen as such to assure a positive value of T for all t.
This section presents experimental data, which will serve in section 4 to validate the model for the effective thermal conductivity as a function of the porosity for a certain determined fixed volume fraction of dispersed nanoparticles.
The process of the drop-deposition experiment is described by the deposition of droplets that contain nanomaterial, letting them evaporate at room temperature and ambient humidity (60% humidity) for seven hours. The duration of the process was needed not so much to evaporate the droplets as such, but rather to evacuate the water that is held back in the pores due to the capillary pressure, since the deposited nanomaterial creates a nano-porous network. The droplets, used for the depositions, contain a mixture of CNTs and SiO2 nanoparticles. The 3 g/L aqueous 5 nm multi-walled CNT dispersion has been supplied by Nanocyl and the 0.3 g/L aqueous 175 nm SiO2 has been supplied by Bangs-Laboratories. The CNT solutions are kept in homogeneous dispersion by the presence of anionic surfactants, which guarantee a long-lasting stable homogeneous aqueous dispersion of the CNTs. As for the SiO2 solutions, they are found to remain in a stable homogeneous aqueous dispersion due to Si-OH surface groups. As recommended by the fabricants, the aqueous solutions are sonicated before depositing the droplets. The position of the droplet is controlled by a motor with a precision of 0.01 mm. Each droplet is deposited by a syringe on a spot that is delimited by a groove, which creates pinning conditions. This results into 40 µL droplets with a diameter of 12 mm. The drop deposition setup has been developed in the lab (Physical Chemistry Group) and is made of a bi-dimensional translation stage (Moons STM17S-1AE) and a home-made double syringe pump using the same motorized stages. The software drives automatically the setup and acquires images of the drop after each deposition (camera JAI BM-500GE) to control the volume of the drop. As soon as the droplets are deposited, the start to evaporate, which induces convectional instabilities. The CNTs and SiO2 nanoparticles move along the flow lines. After the fluid has evaporated, the nanoparticles and CNTs settle on the substrate, forming a porous nanostructure.
The porosity of the matrix is defined as
ε=VpVt−Vnp=1−VmVt−Vnp=1−(Nd+1)cmVdρmπr2mδm−NdCnpVdρnp | (10) |
where Vp, Vm and Vnp are the pore volume (air in our case), the volume occupied by the matrix (CNT) and the volume occupied by the nanoparticles (SiO2), respectively (note that the total volume is Vt = Vp+Vm+Vnp). Moreover, Cm is the matrix material concentration in the deposited droplet (Cm = 3 g/L), Cnp is the silica concentration in the deposited droplet (Cnp = 0.3 g/L), ρm the CNT "tap" density (ρm = 1.6 kg/L), ρnp the silica density (ρnp = 2.65 kg/L) and Vd the volume of each deposited droplet (Vd = 40 µL). The term Nd+1 in (10) stands for the fact that before depositing the CNT-SiO2 mixtures, one layer of pure CNT is deposited [3]. The calculated porosity presents an error of less than 0.5% and is presented in Table 1 as a function of the number of deposited droplets. Furthermore, in (10), δm and rm are the thickness of the deposited material and the radius, respectively. The radius is measured to be rm = 6 mm and δm is measured by means of a confocal probe [3] and also given in Table 1.
Nd | 1 | 2 | 3 | 4 | 5 | 6 | 7 |
ε | 0.83 | 0.83 | 0.85 | 0.84 | 0.82 | 0.80 | 0.81 |
δm [μm] | 8.0 | 11.9 | 18.1 | 20.9 | 22.3 | 24.0 | 28.0 |
The volume fraction of the nanoparticles used in the aforementioned material can be calculated via
φ=CnpρnpρmCm+Cnp | (11) |
which gives φ = 0.057.
Since it is quite difficult to find the exact values for λ0, they will be taken from experimental findings from [3] of pure CNT depositions. It is found that for a pure monolayer nanoporous CNT, λp = 0.88 kW/Km. With a porosity (calculated from data from [3], with a droplet volume of 45 µL and using Eq (10) with Nd = 2 and δm = 20 µm) of ε = 0.85, we find easily from Eq (3) as approximation that λ0 = 8.4 kW/Km (which is, taking into account experimental uncertainty, not far from the 6600 W/Km found in the literature [14].
The deposited nanostructures, for several number of deposited droplets (see Table 1), are measured for their effective thermal conductivity, λexp. The results are presented in Table 2.
Nd | 1 | 2 | 3 | 4 | 5 | 6 | 7 |
ε | 0.83 | 0.83 | 0.85 | 0.84 | 0.82 | 0.80 | 0.81 |
λ|| [kW/Km] | 0.88 | 0.89 | 0.93 | 0.89 | 0.96 | 1.00 | 0.98 |
Table 2 shows that, in overall, the thermal conductivities increase, with an overall decreasing porosity, which suggests indeed that a denser structure is obtained, which can be explained by a better alignment of CNTs. In general, a composite structure that becomes denser than the CNT structure, would lead to a relative increase of the thermal conductivity with respect to its initial value. As for the alignment of the CNTs, this is confirmed by SEM images in [3] and is not the subject of the present work. In general, as the degree of alignment of CNTs is higher, the thermal conductivity should increase in the axial direction of the nanotubes.
For practical purposes (applications as biosensors, batteries, rather than insulators, semi-conductors), the interest lies more into the conductivities in the longitudinal direction of the CNTs. For a preferred substrate direction, even though the CNTs are not perfectly aligned, the longitudinal axis of the majority of the CNTs will still be in that preferred direction. The experimental data used for this purpose are taken from section 4.1. Nevertheless, for the sake of completeness, important details are represented next. With our model, the effective thermal conductivities are calculated from the model in section 2 and compared to the experimental values. The results are presented in Figure 1.
Figure 1 shows a good agreement between the model and the experiments, showing that a lower porosity corresponds to higher thermal conductivities. The results confirm the validity of the model for the effective thermal conductivities for the purposes of this work.
In the expression of the thermal characteristic time, the thermal conductivity is that of the bulk material (i.e. λ0 = 6600 W/(Km)), whilst the density and heat capacity are those of the porous medium. Taking a volume-fraction-based weighted average (the densities of CNT and air are 1600 and 1.2 kg/m3, respectively, whilst the heat capacities of CNT and air are 620 [16] and 1005 J/(kgK), respectively), noting that the porosity is defined on volume basis and that ε = O(0.85), we find ρ = 241 kg/m3 and cp = 947 J/(kgK). The relaxation time for a CNT-SiO2 system is given in [17] to be τr0 = 85 ps. Taking for the thickness a value of the same order of magnitude as Table 1, let us say δ = O(10) µm, we find a thermal characteristic time of τth = 31 ns. This gives αth≈2.5*10-2. For this value, our model is used for the calculations by means of the programme Mathematica. Figure 2 shows a 3D example for φ = 0.057.
Figure 2 shows that the oscillations at x = 1 (not clearly visible, because the period of the temperature oscillations is equivalent to 2t on a scale of 400t in the Figure) are quickly damped. This is due to the relaxation time being much smaller than the thermal diffusion time. Furthermore, this damping also results into a delayed response, due to the presence of a relaxation time in se. The temperature at the other side increases to a value equal to the mean value of the oscillatory temperature, i.e. T = 0.5. In order to visualize this more, it is more convenient to plot the response temperature (i.e. T at x = 0) as a function of time. We do this for four values of φ = 0.057, 0.1, 0.2 and 0.5. The results are presented in Figure 3.
Note that the volume fraction for the biological uptake is given by φb = φ-0.057. So, φ = 0.057 is the reference state (the value corresponding to the silica nanoparticles), where no biological fluid has been taken up yet. We can see indeed that no oscillations are present (fully damped) and that the uptake of the biological fluid (φ > 0.057) results into a decrease of the temperature response, which is attributed to the decrease in the effective thermal conductivity. A way to measure the evolution of the uptake of biological fluid would be following the gradient of the temperature evolution, indicative for the time needed to attain the final value of T = 0.5. For illustrative purposes, we perform the same calculations also for δ = O(3.5), δ = O(1.5) and δ = O(1) µm, so that αth = O(0.2), αth = O(1) and αth = O(2.5), respectively. These results are presented in Figures 4 to 6, respectively.
Figure 4 shows that a higher value of αth (the thermal diffusion time becomes smaller than in the previous case, which could be due to another material or another thickness of the same material) results into a small "left-over" of the imposed oscillations, but keeping approximately the same incremental tendency.
Figure 5 shows that, for a relaxation time of the order of magnitude of a thermal diffusion time, the incremental behaviour is only slightly visible, but rather the oscillatory behaviour of the temperature response becomes more important. As such, for higher values of φ (higher uptake of the biological fluid), the measurement could be indicated by a phase lag of the oscillations. This phase lag becomes even more important when augmenting αth in Figure 6. There, the incremental behaviour has completely vanished and only the phase lag is observable as an indication of biological fluid uptake.
Figures 4 to 6 show that, depending on the ratio of the thermal relaxation time and the thermal diffusion characteristic time, the detection of the biological fluid uptake can be monitored by two distinctive ways. If the thermal diffusion time is smaller for a certain relaxation time, the fluid uptake can be monitored by a gradient of the temperature response, whilst for larger thermal diffusion times the uptake can be followed by measuring the phase lag of an oscillatory temperature response. This can open ways to several types of biosensors.
In this work, a study on the response of an imposed temperature oscillation at high frequency is performed, using as material a porous carbon nanotube-silica nanocomposite. The purpose is to measure the uptake of biological fluids by noting that the temperature response can be altered by the thermal properties of the material, which depends also on the uptake of the biological fluids. For this study, a heat flux from Extended Thermodynamics has been employed, combined with an energy balance and an equation for the effective thermal conductivity. It is important to note that the evolution equation for the heat flux, although taken from developments from Extended Thermodynamics and neglecting thereby non-local effects [1], corresponds also to Cattaneo's equation for heat transport [18]. The model for the effective thermal conductivity has been satisfactorily validated against experiments of a porous CNT-SiO2 nanocomposite. The experiments concern a procedure of self-assembled porous nanocomposite structures, of which the thermal conductivities have been measured.
Subsequently, the temperature response (induced by the imposed oscillatory temperature) is calculated using the heat transport equations. The ratio of the relaxation time and the thermal diffusion time is also varied in order to appreciate the effect the thickness of a material could have on the response. The uptake of the biological fluid has an influence on the effective thermal conductivity, which will change the temperature response. Although, for a final application, such methodology should be implemented in electrical circuits (implying indirectly induced temperature pulses), the source of the temperature pulses is not the subject of this study. Rather, it provides the mathematical and conceptual tools allowing such possible implementations. It appeared indeed that the uptake of biological fluid, simulated here by an increase of the volume fraction, alters clearly the temperature response, and this even in two distinct ways. It appeared that this response was of oscillatory nature with a phase lag when the thermal diffusion time was much lower than the relaxation time. On the other hand, when the thermal diffusion time was much higher than the relaxation time, the response was rather of exponential growing nature towards an asymptotic value.
Financial support from BelSPo is acknowledged.
All authors declare no conflicts of interest in this paper.
[1] |
Gustafson T, Wolpert L (1967) Cellular movement and contact in sea urchin morphogenesis. Biol Rev Camb Philos Soc 42: 442-498. doi: 10.1111/j.1469-185X.1967.tb01482.x
![]() |
[2] | Miller J, Fraser SE, McClay D (1995) Dynamics of thin filopodia during sea urchin gastrulation. Development 121: 2501-2511. |
[3] |
Ramirez-Weber FA, Kornberg TB (1999) Cytonemes: cellular processes that project to the principal signaling center in Drosophila imaginal discs. Cell 97: 599-607. doi: 10.1016/S0092-8674(00)80771-0
![]() |
[4] |
Roy S, Huang H, Liu S, et al. (2014) Cytoneme-mediated contact-dependent transport of the Drosophila decapentaplegic signaling protein. Science 343: 1244624. doi: 10.1126/science.1244624
![]() |
[5] |
Kornberg TB (2014) Cytonemes and the dispersion of morphogens. Wiley Interdiscip Rev Dev Biol 3: 445-463. doi: 10.1002/wdev.151
![]() |
[6] |
Prols F, Sagar, Scaal M (2016) Signaling filopodia in vertebrate embryonic development. Cell Mol Life Sci 73: 961-974. doi: 10.1007/s00018-015-2097-6
![]() |
[7] |
Sanders TA, Llagostera E, Barna M (2013) Specialized filopodia direct long-range transport of SHH during vertebrate tissue patterning. Nature 497: 628-632. doi: 10.1038/nature12157
![]() |
[8] | Yang Y, Drossopoulou G, Chuang PT, et al. (1997) Relationship between dose, distance and time in Sonic Hedgehog-mediated regulation of anteroposterior polarity in the chick limb. Development 124: 4393-4404. |
[9] |
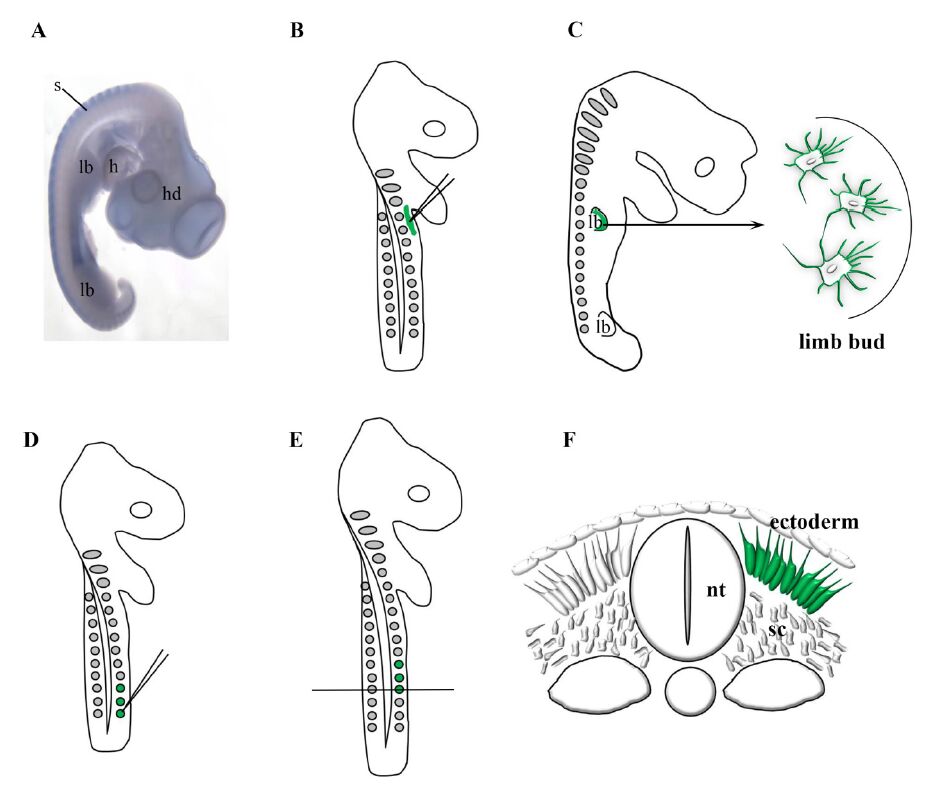
Sagar, Prols F, Wiegreffe C, et al. (2015) Communication between distant epithelial cells by filopodia-like protrusions during embryonic development. Development 142: 665-671. doi: 10.1242/dev.115964
![]() |
[10] |
Holzer T, Liffers K, Rahm K, et al. (2012) Live imaging of active fluorophore labelled Wnt proteins. FEBS Lett 586: 1638-1644. doi: 10.1016/j.febslet.2012.04.035
![]() |
[11] |
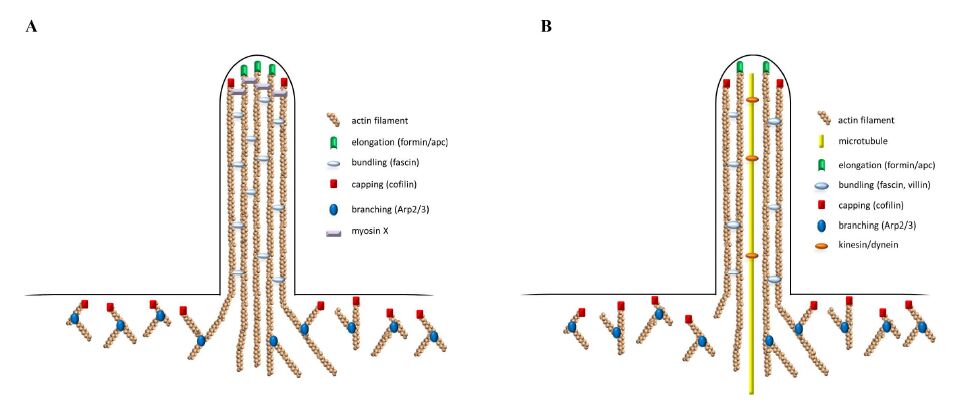
Chhabra ES, Higgs HN (2007) The many faces of actin: matching assembly factors with cellular structures. Nat Cell Biol 9: 1110-1121. doi: 10.1038/ncb1007-1110
![]() |
[12] | Rengan R, Ochs HD (2000) Molecular biology of the Wiskott-Aldrich syndrome. Rev Immunogenet 2: 243-255. |
[13] |
Pruyne D, Evangelista M, Yang C, et al. (2002) Role of formins in actin assembly: nucleation and barbed-end association. Science 297: 612-615. doi: 10.1126/science.1072309
![]() |
[14] | Sagot I, Rodal AA, Moseley J, et al. (2002) An actin nucleation mechanism mediated by Bni1 and profilin. Nat Cell Biol 4: 626-631. |
[15] |
Goode BL, Eck MJ (2007) Mechanism and function of formins in the control of actin assembly. Annu Rev Biochem 76: 593-627. doi: 10.1146/annurev.biochem.75.103004.142647
![]() |
[16] |
Yang C, Czech L, Gerboth S, et al. (2007) Novel roles of formin mDia2 in lamellipodia and filopodia formation in motile cells. PLoS Biol 5: e317. doi: 10.1371/journal.pbio.0050317
![]() |
[17] |
Bravo-Cordero JJ, Magalhaes MA, Eddy RJ, et al. (2013) Functions of cofilin in cell locomotion and invasion. Nat Rev Mol Cell Biol 14: 405-415. doi: 10.1038/nrm3609
![]() |
[18] | Yamashiro-Matsumura S, Matsumura F (1985) Purification and characterization of an F-actin-bundling 55-kilodalton protein from HeLa cells. J Biol Chem 260: 5087-5097. |
[19] |
Yang S, Huang FK, Huang J, et al. (2013) Molecular mechanism of fascin function in filopodial formation. J Biol Chem 288: 274-284. doi: 10.1074/jbc.M112.427971
![]() |
[20] |
Mattila PK, Lappalainen P (2008) Filopodia: molecular architecture and cellular functions. Nat Rev Mol Cell Biol 9: 446-454. doi: 10.1038/nrm2406
![]() |
[21] |
Vignjevic D, Kojima S, Aratyn Y, et al. (2006) Role of fascin in filopodial protrusion. J Cell Biol 174: 863-875. doi: 10.1083/jcb.200603013
![]() |
[22] |
Huang FK, Han S, Xing B, et al. (2015) Targeted inhibition of fascin function blocks tumour invasion and metastatic colonization. Nat Commun 6: 7465. doi: 10.1038/ncomms8465
![]() |
[23] |
George SP, Chen H, Conrad JC, et al. (2013) Regulation of directional cell migration by membrane-induced actin bundling. J Cell Sci 126: 312-326. doi: 10.1242/jcs.116244
![]() |
[24] |
Khurana S, George SP (2011) The role of actin bundling proteins in the assembly of filopodia in epithelial cells. Cell Adh Migr 5: 409-420. doi: 10.4161/cam.5.5.17644
![]() |
[25] |
Kerber ML, Cheney RE (2011) Myosin-X: a MyTH-FERM myosin at the tips of filopodia. J Cell Sci 124: 3733-3741. doi: 10.1242/jcs.023549
![]() |
[26] |
Ohi R, Zanic M (2016) Ahead of the Curve: New Insights into Microtubule Dynamics. F1000Res 5: 314. doi: 10.12688/f1000research.7439.1
![]() |
[27] |
Bhabha G, Johnson GT, Schroeder CM, et al. (2016) How Dynein Moves Along Microtubules. Trends Biochem Sci 41: 94-105. doi: 10.1016/j.tibs.2015.11.004
![]() |
[28] |
Francou A, Saint-Michel E, Mesbah K, et al. (2014) TBX1 regulates epithelial polarity and dynamic basal filopodia in the second heart field. Development 141: 4320-4331. doi: 10.1242/dev.115022
![]() |
[29] |
Salas-Vidal E, Lomeli H (2004) Imaging filopodia dynamics in the mouse blastocyst. Dev Biol 265: 75-89. doi: 10.1016/j.ydbio.2003.09.012
![]() |
[30] |
Koizumi K, Takano K, Kaneyasu A, et al. (2012) RhoD activated by fibroblast growth factor induces cytoneme-like cellular protrusions through mDia3C. Mol Biol Cell 23: 4647-4661. doi: 10.1091/mbc.E12-04-0315
![]() |
[31] |
Ketschek A, Jones S, Spillane M, et al. (2015) Nerve growth factor promotes reorganization of the axonal microtubule array at sites of axon collateral branching. Dev Neurobiol 75: 1441-1461. doi: 10.1002/dneu.22294
![]() |
[32] |
Eira J, Silva CS, Sousa MM, et al. (2016) The cytoskeleton as a novel therapeutic target for old neurodegenerative disorders. Prog Neurobiol 141: 61-82. doi: 10.1016/j.pneurobio.2016.04.007
![]() |
[33] |
Lin C, Schuster M, Guimaraes SC, et al. (2016) Active diffusion and microtubule-based transport oppose myosin forces to position organelles in cells. Nat Commun 7: 11814. doi: 10.1038/ncomms11814
![]() |
[34] |
Roy S, Hsiung F, Kornberg TB (2011) Specificity of Drosophila cytonemes for distinct signaling pathways. Science 332: 354-358. doi: 10.1126/science.1198949
![]() |
[35] | Ridley AJ, Hall A (1994) Signal transduction pathways regulating Rho-mediated stress fibre formation: requirement for a tyrosine kinase. EMBO J 13: 2600-2610. |
[36] |
Ridley AJ, Hall A (1992) The small GTP-binding protein rho regulates the assembly of focal adhesions and actin stress fibers in response to growth factors. Cell 70: 389-399. doi: 10.1016/0092-8674(92)90163-7
![]() |
[37] |
Hall A (1998) Rho GTPases and the actin cytoskeleton. Science 279: 509-514. doi: 10.1126/science.279.5350.509
![]() |
[38] |
Ridley AJ (1995) Rho-related proteins: actin cytoskeleton and cell cycle. Curr Opin Genet Dev 5: 24-30. doi: 10.1016/S0959-437X(95)90049-7
![]() |
[39] |
Machesky LM, Hall A (1996) Rho: a connection between membrane receptor signalling and the cytoskeleton. Trends Cell Biol 6: 304-310. doi: 10.1016/0962-8924(96)10026-X
![]() |
[40] | Boureux A, Vignal E, Faure S, et al. (2007) Evolution of the Rho family of ras-like GTPases in eukaryotes. Mol Biol Evol 24: 203-216. |
[41] |
Van Aelst L, D'Souza-Schorey C (1997) Rho GTPases and signaling networks. Genes Dev 11: 2295-2322. doi: 10.1101/gad.11.18.2295
![]() |
[42] |
Saarikangas J, Zhao H, Lappalainen P (2010) Regulation of the actin cytoskeleton-plasma membrane interplay by phosphoinositides. Physiol Rev 90: 259-289. doi: 10.1152/physrev.00036.2009
![]() |
[43] |
Habas R, Dawid IB, He X (2003) Coactivation of Rac and Rho by Wnt/Frizzled signaling is required for vertebrate gastrulation. Genes Dev 17: 295-309. doi: 10.1101/gad.1022203
![]() |
[44] |
Habas R, Kato Y, He X (2001) Wnt/Frizzled activation of Rho regulates vertebrate gastrulation and requires a novel Formin homology protein Daam1. Cell 107: 843-854. doi: 10.1016/S0092-8674(01)00614-6
![]() |
[45] |
Schiller MR (2006) Coupling receptor tyrosine kinases to Rho GTPases--GEFs what's the link. Cell Signal 18: 1834-1843. doi: 10.1016/j.cellsig.2006.01.022
![]() |
[46] |
Stanganello E, Hagemann AI, Mattes B, et al. (2015) Filopodia-based Wnt transport during vertebrate tissue patterning. Nat Commun 6: 5846. doi: 10.1038/ncomms6846
![]() |
1. | Mahendra Saini, Hemant K.S. Yadav, Priya Sen, Manish Gupta, Nidhi Chauhan, 2025, 9780443216589, 109, 10.1016/B978-0-443-21658-9.00011-5 |
Nd | 1 | 2 | 3 | 4 | 5 | 6 | 7 |
ε | 0.83 | 0.83 | 0.85 | 0.84 | 0.82 | 0.80 | 0.81 |
δm [μm] | 8.0 | 11.9 | 18.1 | 20.9 | 22.3 | 24.0 | 28.0 |
Nd | 1 | 2 | 3 | 4 | 5 | 6 | 7 |
ε | 0.83 | 0.83 | 0.85 | 0.84 | 0.82 | 0.80 | 0.81 |
λ|| [kW/Km] | 0.88 | 0.89 | 0.93 | 0.89 | 0.96 | 1.00 | 0.98 |