Research article

Investigating the Surface and Subsurface in Karstic Regions – Terrestrial Laser Scanning versus Low-Altitude Airborne Imaging and the Combination with Geophysical Prospecting

  • Received: 12 May 2017 Accepted: 04 August 2017 Published: 10 August 2017
  • Combining measurements of the surface and subsurface is a promising approach to understand the origin and current changes of karstic forms since subterraneous processes are often the initial driving force. A karst depression in south-west Germany was investigated in a comprehensive campaign with remote sensing and geophysical prospecting. This contribution has two objectives: firstly, comparing terrestrial laser scanning (TLS) and low-altitude airborne imaging from an unmanned aerial vehicle (UAV) regarding their performance in capturing the surface. Secondly, establishing a suitable way of combining this 3D surface data with data from the subsurface, derived by geophysical prospecting. Both remote sensing approaches performed satisfying and the established digital elevation models (DEMs) differ only slightly. These minor discrepancies result essentially from the different viewing geometries and post-processing concepts, for example whether the vegetation was removed or not. Validation analyses against high-accurate DGPS-derived point data sets revealed slightly better results for the DEMTLS with a mean absolute difference of 0.03 m to 0.05 m and a standard deviation of 0.03 m to 0.07 m (DEMUAV: mean absolute difference: 0.11 m to 0.13 m; standard deviation: 0.09 m to 0.11 m). The 3D surface data and 2D image of the vertical cross section through the subsurface along a geophysical profile were combined in block diagrams. The data sets fit very well and give a first impression of the connection between surface and subsurface structures. Since capturing the subsurface with this method is limited to 2D and the data acquisition is quite time consuming, further investigations are necessary for reliable statements about subterraneous structures, how these may induce surface changes, and the origin of this karst depression. Moreover, geophysical prospecting can only produce a suspected image of the subsurface since the apparent resistivity is measured. Thus, further measurements, such as borehole drillings or ground-penetrating radar are necessary for a closer analysis of the subsurface. In summary, satisfying results were achieved, which however pave the way for further studies.

    Citation: Nora Tilly, Daniel Kelterbaum. Investigating the Surface and Subsurface in Karstic Regions – Terrestrial Laser Scanning versus Low-Altitude Airborne Imaging and the Combination with Geophysical Prospecting[J]. AIMS Geosciences, 2017, 3(3): 352-374. doi: 10.3934/geosci.2017.3.352

    Related Papers:

    [1] Christoph Nick, Helmut F. Schlaak, Christiane Thielemann . Simulation and Measurement of Neuroelectrodes Characteristics with Integrated High Aspect Ratio Nano Structures. AIMS Materials Science, 2015, 2(3): 189-202. doi: 10.3934/matersci.2015.3.189
    [2] Sumaiya F. Begum, Hai-Feng Ji . Biochemistry tuned by nanopillars. AIMS Materials Science, 2021, 8(5): 748-759. doi: 10.3934/matersci.2021045
    [3] Hai-Feng Ji, Morasae Samadi, Hao Gu, Veronica Tomchak, Zhen Qiao . Fabrication and applications of self-assembled nanopillars. AIMS Materials Science, 2017, 4(4): 905-919. doi: 10.3934/matersci.2017.4.905
    [4] Christian M Julien, Alain Mauger, Ashraf E Abdel-Ghany, Ahmed M Hashem, Karim Zaghib . Smart materials for energy storage in Li-ion batteries. AIMS Materials Science, 2016, 3(1): 137-148. doi: 10.3934/matersci.2016.1.137
    [5] Alexandre Lavrov, Kamila Gawel, Malin Torsæter . Manipulating cement-steel interface by means of electric field: Experiment and potential applications. AIMS Materials Science, 2016, 3(3): 1199-1207. doi: 10.3934/matersci.2016.3.1199
    [6] Claas Hüter, Shuo Fu, Martin Finsterbusch, Egbert Figgemeier, Luke Wells, Robert Spatschek . Electrode–electrolyte interface stability in solid state electrolyte systems: influence of coating thickness under varying residual stresses. AIMS Materials Science, 2017, 4(4): 867-877. doi: 10.3934/matersci.2017.4.867
    [7] Christian M. Julien, Alain Mauger . In situ Raman analyses of electrode materials for Li-ion batteries. AIMS Materials Science, 2018, 5(4): 650-698. doi: 10.3934/matersci.2018.4.650
    [8] Stephanie Flores Zopf, Matthew J. Panzer . Integration of UV-cured Ionogel Electrolyte with Carbon Paper Electrodes. AIMS Materials Science, 2014, 1(1): 59-69. doi: 10.3934/matersci.2014.1.59
    [9] Serguei Chiriaev, Nis Dam Madsen, Horst-Günter Rubahn, Shuang Ma Andersen . Helium Ion Microscopy of proton exchange membrane fuel cell electrode structures. AIMS Materials Science, 2017, 4(6): 1289-1304. doi: 10.3934/matersci.2017.6.1289
    [10] R.A. Silva, C.O. Soares, R. Afonso, M.D. Carvalho, A.C. Tavares, M.E. Melo Jorge, A. Gomes, M.I. da Silva Pereira, C.M. Rangel . Synthesis and electrocatalytic properties of La0.8Sr0.2FeO3−δ perovskite oxide for oxygen reactions. AIMS Materials Science, 2017, 4(4): 991-1009. doi: 10.3934/matersci.2017.4.991
  • Combining measurements of the surface and subsurface is a promising approach to understand the origin and current changes of karstic forms since subterraneous processes are often the initial driving force. A karst depression in south-west Germany was investigated in a comprehensive campaign with remote sensing and geophysical prospecting. This contribution has two objectives: firstly, comparing terrestrial laser scanning (TLS) and low-altitude airborne imaging from an unmanned aerial vehicle (UAV) regarding their performance in capturing the surface. Secondly, establishing a suitable way of combining this 3D surface data with data from the subsurface, derived by geophysical prospecting. Both remote sensing approaches performed satisfying and the established digital elevation models (DEMs) differ only slightly. These minor discrepancies result essentially from the different viewing geometries and post-processing concepts, for example whether the vegetation was removed or not. Validation analyses against high-accurate DGPS-derived point data sets revealed slightly better results for the DEMTLS with a mean absolute difference of 0.03 m to 0.05 m and a standard deviation of 0.03 m to 0.07 m (DEMUAV: mean absolute difference: 0.11 m to 0.13 m; standard deviation: 0.09 m to 0.11 m). The 3D surface data and 2D image of the vertical cross section through the subsurface along a geophysical profile were combined in block diagrams. The data sets fit very well and give a first impression of the connection between surface and subsurface structures. Since capturing the subsurface with this method is limited to 2D and the data acquisition is quite time consuming, further investigations are necessary for reliable statements about subterraneous structures, how these may induce surface changes, and the origin of this karst depression. Moreover, geophysical prospecting can only produce a suspected image of the subsurface since the apparent resistivity is measured. Thus, further measurements, such as borehole drillings or ground-penetrating radar are necessary for a closer analysis of the subsurface. In summary, satisfying results were achieved, which however pave the way for further studies.


    [1] Zepp H (2014) Geomorphologie. 6th ed. UTB, Stuttgart.
    [2] Tilly N, Kelterbaum D, Zeese R (2016) Geomorphological mapping with terrestrial laser scanning and uav-based imaging. Int Arch Photogramm, Remote Sens Spat Inf Sci–ISPRS Arch 41: 591-597.
    [3] Large ARG, Heritage GL (2009) Laser Scanning – Evolution of the Discipline. In: Heritage GL, and Large ARG, editors. Laser Scanning for the Environmental Sciences, Wiley-Blackwell, West Sussex, UK. 1-20.
    [4] Buckley SJ, Howell JA, Enge HD, et al (2008) Terrestrial laser scanning in geology: data acquisition, processing and accuracy considerations. J Geol Soc 165: 625-638. doi: 10.1144/0016-76492007-100
    [5] Tarolli P (2014) High-resolution topography for understanding Earth surface processes: Opportunities and challenges. Geomorphol 216: 295-312. doi: 10.1016/j.geomorph.2014.03.008
    [6] Schaefer M, Inkpen R (2010) Towards a protocol for laser scanning of rock surfaces. Earth Surf Processes Landforms 35: 417-423.
    [7] Colomina I, Molina P (2014) Unmanned aerial systems for photogrammetry and remote sensing: A review. ISPRS J Photogramm Remote Sens 92: 79-97. doi: 10.1016/j.isprsjprs.2014.02.013
    [8] Shahbazi M, Sohn G, Théau J, et al. (2015) Development and Evaluation of a UAV-Photogrammetry System for Precise 3D Environmental Modeling. Sensors 15: 27493-27524. doi: 10.3390/s151127493
    [9] Turner D, Lucieer A, Watson C (2012) An automated technique for generating georectified mosaics from ultra-high resolution Unmanned Aerial Vehicle (UAV) imagery, based on Structure from Motion (SFM) point clouds. Remote Sens 4: 1392-1410. doi: 10.3390/rs4051392
    [10] Westoby MJ, Brasington J, Glasser NF, et al. (2012) Structure-from-Motion photogrammetry: A low-cost, effective tool for geoscience applications. Geomorphol 179: 300-314. doi: 10.1016/j.geomorph.2012.08.021
    [11] Tong X, Liu X, Chen P, et al. (2015) Integration of UAV-Based Photogrammetry and Terrestrial Laser Scanning for the Three-Dimensional Mapping and Monitoring of Open-Pit Mine Areas. Remote Sens 7: 6635-6662. doi: 10.3390/rs70606635
    [12] Smith MW, Carrivick JL, Quincey DJ (2015) Structure from motion photogrammetry in physical geography. Prog Phys Geogr 1-29.
    [13] Ouédraogo MM, Degré A, Debouche C, et al. (2014) The evaluation of unmanned aerial system-based photogrammetry and terrestrial laser scanning to generate DEMs of agricultural watersheds. Geomorphol 214: 339-355. doi: 10.1016/j.geomorph.2014.02.016
    [14] Butler DK (2005) Near-Surface Geophysics. Society of Exploration Geophysicists. https://doi.org/http://dx.doi.org/10.1190/1.9781560801719.
    [15] Kidanu ST, Torgashov EV, Varnavina AV, et al. (2016) ERT-based Investigation of a Sinkhole in Greene County, Missouri. AIMS Geosci 2: 99-115. doi: 10.3934/geosci.2016.2.99
    [16] Berglund JL, Mickus K, Gouzie D (2014) Determining a relationship between a newly forming sinkhole and a former dry stream using electric resistivity tomography and very low-frequency electromagnetics in an urban karst setting. Interpret 2: 17-27.
    [17] Siart C, Hecht S, Holzhauer I, et al. (2010) Karst depressions as geoarchaeological archives: The palaeoenvironmental reconstruction of Zominthos (Central Crete), based on geophysical prospection, sedimentological investigations and GIS. QuatInt 216: 75-92.
    [18] Siart C, Ghilardi M, Forbriger M, et al. (2012) Terrestrial laser scanning and electrical resistivity tomography as combined tools for the geoarchaeological study of the Kritsa-Latô dolines (Mirambello, Crete, Greece). Géomorphol: Relief, Process, Environ 18: 59-74. doi: 10.4000/geomorphologie.9743
    [19] Siart C, Forbriger M, Nowaczinski E, et al. (2013) Fusion of multi-resolution surface (terrestrial laser scanning) and subsurface geodata (ERT, SRT) for karst landform investigation and geomorphometric quantification. Earth Surf Processes Landforms 38: 1135-1147. doi: 10.1002/esp.3394
    [20] Vlahovic T, Munda B (2012) Karst aquifers on small islands-the island of Olib, Croatia. Environ Monit Assess 184: 6211-6228. doi: 10.1007/s10661-011-2414-y
    [21] Ahnert F (2009) Einführung in die Geomorphologie. 4th ed. UTB, Stuttgart.
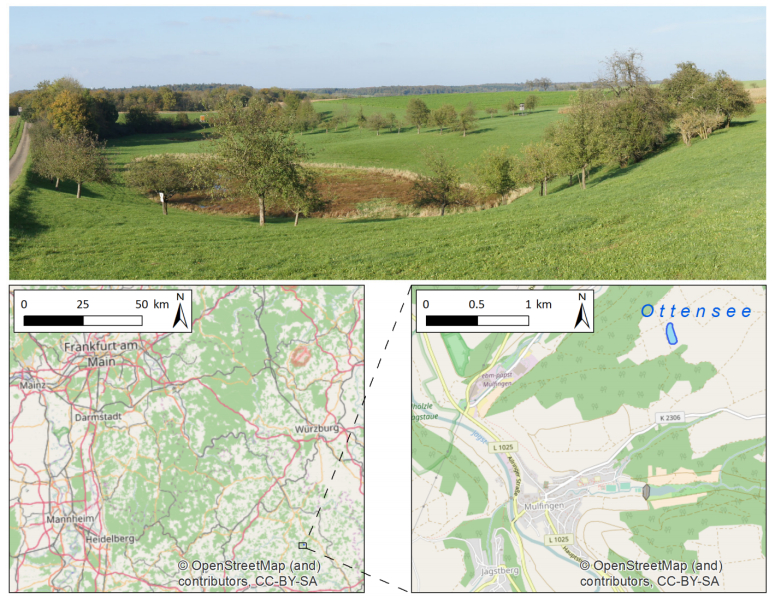
    [22] Regierungspräsidium Freiburg (2017) Steckbrief Geotope–Ottensee NE von Mulfingen. Available from: http://www4.lgrb.uni-freiburg.de/serverbase/umn/etc/resources/link/gtk/gtk_1812.pdf.
    [23] Topcon Positioning Systems I (2006) HiPer Pro Operator's Manual. Available from: http://www.top-survey.com/top-survey/downloads/HiPerPro_om.pdf.
    [24] Riegl LMS GmbH (2010) Datasheet Riegl LMS-Z420i. Available from: http://www.riegl.com/uploads/tx_pxpriegldownloads/10_DataSheet_Z420i_03-05-2010.pdf.
    [25] DJI (2016) Datasheet Phantom 3. Available from: http://www.dji.com/de/product/phantom-3-adv.
    [26] DJI (2017) DJI GO app. Available from: http://www.dji.com/goapp.
    [27] GEO LOG (2017) Multi electrode system GeoTomMK8E1000 RES/IP/SP. Available from: http://geolog2000.de/EN/Geoelektrik/index.htm.
    [28] Stummer P, Maurer H, Green AG (2004) Experimental design: Electrical resistivity data sets that provide optimum subsurface information. Geophys 69: 120-139. doi: 10.1190/1.1649381
    [29] Samouëlian A, Cousin I, Tabbagh A, et al. (2005) Electrical resistivity survey in soil science: A review. Soil Tillage Res 83: 173-193. doi: 10.1016/j.still.2004.10.004
    [30] Smith RC, Sjogren DB (2006) An evaluation of electrical resistivity imaging (ERI) in quaternary sediments, Southern Alberta, Canada. Geosph 2: 287-298. doi: 10.1130/GES00048.1
    [31] Winters G, Ryvkin I, Rudkov T, et al. (2015) Mapping underground layers in the super arid Gidron Wadi using electrical resistivity tomography (ERT). J Arid Environ Elsevier Ltd 121: 79-83. doi: 10.1016/j.jaridenv.2015.05.008
    [32] Johnston K, Ver Hoef JM, Krivoruchko K, et al. (2001) Using ArcGIS Geostatistical Analyst. ESRI, USA.
    [33] Geotomo (2017) RES2DINVx64. Available from: http://www.geotomosoft.com.
    [34] Loke MH, Barker RD (1996) Rapid least-squares inversion of apparent reistivity pseudosections by a quasi-Newton method. Geophys Prospect 44: 131-152. doi: 10.1111/j.1365-2478.1996.tb00142.x
    [35] Eltner A, Baumgart P (2015) Accuracy constraints of terrestrial Lidar data for soil erosion measurement: Application to a Mediterranean field plot. Geomorphol 245: 243-254. doi: 10.1016/j.geomorph.2015.06.008
    [36] Favalli M, Fornaciai A, Isola I, et al. (2012) Multiview 3D reconstruction in geosciences. Comput Geosci 44: 168-176. doi: 10.1016/j.cageo.2011.09.012
    [37] Riegl LMS GmbH (2015) Datasheet Riegl VZ-2000. Available from: http://www.riegl.com/uploads/tx_pxpriegldownloads/DataSheet_VZ-2000_2015-03-24.pdf.
    [38] Leica Geoystems (2015) Datasheet Leica ScanStation P40. Available from: http://www.leica-geosystems.com/downloads123/hds/hds/general/brochures-datasheet/Leica_ScanStation_P30-P40_Plant_DS_en.pdf.
    [39] Velodyne (2014) Velodyne HDL-64E User's Manual. Available from: http://www.velodynelidar.com/lidar/products/manual/63-HDL64E S2 Manual_Rev D_2011_web.pdf.
    [40] Liang X, Kukko A, Kaartinen H, et al. (2013) Possibilities of a personal laser scanning system for forest mapping and ecosystem services. Sens 14: 1228-1248.
    [41] Ryding J, Williams E, Smith M, et al. (2015) Assessing Handheld Mobile Laser Scanners for Forest Surveys. Remote Sens 7: 1095-1111. doi: 10.3390/rs70101095
    [42] Bates KT, Rarity F, Manning PL, et al. (2008) High-resolution LiDAR and photogrammetric survey of the Fumanya dinosaur tracksites (Catalonia): implications for the conservation and interpretation of geological heritage sites. J Geol Soc 165: 115-127. doi: 10.1144/0016-76492007-033
    [43] Nex F, Rinaudo F (2011) LiDAR or Photogrammetry? Integration is the answer. Italian J Remote Sens 43: 107-121.
    [44] Fabris M, Baldi P, Anzidei M, et al. (2010) High resolution topographic model of Panarea Island by fusion of photogrammetric, lidar and bathymetric digital terrain models. Photogramm Rec 25: 382-401. doi: 10.1111/j.1477-9730.2010.00600.x
    [45] Ahmed S, Carpenter PJ (2003) Geophysical response of filled sinkholes, soil pipes and associated bedrock fractures in thinly mantled karst, east-central Illinois. Environ Geol 44: 705-716. doi: 10.1007/s00254-003-0812-3
    [46] Mauriello P, Monna D, Patella D (1998) 3D geoelectric tomography and archaeological applications. Geophys Prospect 46: 543-570. doi: 10.1046/j.1365-2478.1998.00102.x
    [47] Alaia R, Patella D, Mauriello P (2008) Application of geoelectrical 3D probability tomography in a test-site of the archaeological park of Pompei (Naples, Italy). J Geophys Eng 5: 67-76. doi: 10.1088/1742-2132/5/1/007
  • This article has been cited by:

    1. George Tsekenis, Marianneza Chatzipetrou, Maria Massaouti, Ioanna Zergioti, Comparative Assessment of Affinity-Based Techniques for Oriented Antibody Immobilization towards Immunosensor Performance Optimization, 2019, 2019, 1687-725X, 1, 10.1155/2019/6754398
    2. Dana Mackey, Eilís Kelly, Robert Nooney, Richard O'Kennedy, Direct immunoassays and their performance – theoretical modelling of the effects of antibody orientation and associated kinetics, 2018, 10, 1757-9694, 598, 10.1039/C8IB00077H
    3. Dana Mackey, Eilis Kelly, Robert Nooney, 2017, Chapter 103, 978-3-319-63081-6, 687, 10.1007/978-3-319-63082-3_103
    4. Lewis Roberts, Thom Griffith, Alan Champneys, Martina Piano, Janice Kiely, Richard Luxton, Mathematical modelling of a magnetic immunoassay, 2017, 82, 0272-4960, 1253, 10.1093/imamat/hxx034
    5. Elizabeth A. Campbell, Katily Ramirez, Meghana Holegadde, Nayana Yeshlur, Akram Khaja, Todd A. Sulchek, Tuning Antibody Presentation to Enhance T-Cell Activation for Downstream Cytotoxicity, 2021, 0743-7463, 10.1021/acs.langmuir.0c03203
    6. Tamás Pfeil, Blanka Herbály, A linear model for polyclonal antibody–antigen reactions, 2022, 198, 03784754, 20, 10.1016/j.matcom.2022.02.004
    7. Jianguo Chang, Nailong Gao, Peng Dai, Ziming Zhu, Hui You, Wei Han, Lu Li, Facile engineered polymeric microdevice via co-coupling of phenylboronic acid and Protein A for oriented antibody immobilization enables substantial signal enhancement for an enhanced fluorescence immunoassay, 2021, 346, 09254005, 130444, 10.1016/j.snb.2021.130444
    8. Hamid Aghamohammadi, Seied Ali Hosseini, Sanjana Srikant, Alexander Wong, Mahla Poudineh, Computational and Experimental Model to Study Immunobead-Based Assays in Microfluidic Mixing Platforms, 2022, 94, 0003-2700, 2087, 10.1021/acs.analchem.1c04228
    9. Jiewen Chen, Guangshuai Yao, Chundong Huang, Qidong Shen, Jian Miao, Lingyun Jia, Biparatopic Nanobody-Based Immunosorbent for the Highly Selective Elimination of Tumor Necrosis Factor-α, 2024, 2373-9878, 10.1021/acsbiomaterials.3c01765
    10. Song Liu, Xiaolu Li, Huyang Gao, Jing Chen, Hongfeng Jiang, Progress in Aptamer Research and Future Applications, 2025, 2191-1363, 10.1002/open.202400463
  • Reader Comments
  • © 2017 the Author(s), licensee AIMS Press. This is an open access article distributed under the terms of the Creative Commons Attribution License (http://creativecommons.org/licenses/by/4.0)
通讯作者: 陈斌, bchen63@163.com
  • 1. 

    沈阳化工大学材料科学与工程学院 沈阳 110142

  1. 本站搜索
  2. 百度学术搜索
  3. 万方数据库搜索
  4. CNKI搜索

Metrics

Article views(5714) PDF downloads(1028) Cited by(0)

Article outline

Figures and Tables

Figures(6)  /  Tables(1)

Other Articles By Authors

/

DownLoad:  Full-Size Img  PowerPoint
Return
Return

Catalog