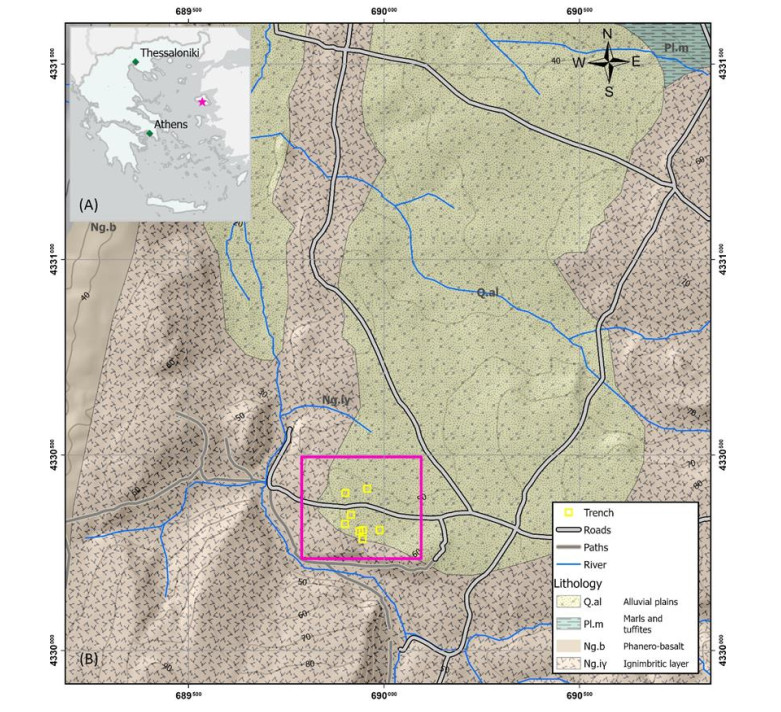
The study area of Rodafnidia on the island of Lesbos (Greece) is considered of archaeological interest, as Paleolithic stone tools have been recovered through excavation and collected from the ground surface in recent years. Geologically, the area is mostly covered by Quaternary post-alpine deposits and volcanic rocks. This paper presents the application of a local geophysical survey to determine the volume of the upper Quaternary deposits in which the Paleolithic artefacts can be found and the identification of their ignimbrite substrates. For this reason, the geoelectrical method was selected as the most appropriate for determining the lithostratigraphic subsurface layers. More specifically, a grid of twenty-one (21) Vertical Electrical Soundings (VES) along with an Electrical Resistivity Tomography (ERT) was carried out. The interpretation of the results of these surveys, in conjunction with the results of older excavation trenches, revealed that the Quaternary deposits have been investigated at depths ranging from 0.5 up to 28.5 meters. Furthermore, the lithological boundary of these post-alpine deposits and their underlying pyroclastic ignimbrite flow (with resistivity 24.0–58.0 Ohm.m) seem to dip to the north. The volume of the Quaternary layer is proposed as the maximum depth for archaeological investigation with high chances to recover more Paleolithic material.
Citation: John D Alexopoulos, Nikolaos Voulgaris, Spyridon Dilalos, Georgia S Mitsika, Ioannis-Konstantinos Giannopoulos, Vassileios Gkosios, Nena Galanidou. A geophysical insight of the lithostratigraphic subsurface of Rodafnidia area (Lesbos Isl., Greece)[J]. AIMS Geosciences, 2023, 9(4): 769-782. doi: 10.3934/geosci.2023041
The study area of Rodafnidia on the island of Lesbos (Greece) is considered of archaeological interest, as Paleolithic stone tools have been recovered through excavation and collected from the ground surface in recent years. Geologically, the area is mostly covered by Quaternary post-alpine deposits and volcanic rocks. This paper presents the application of a local geophysical survey to determine the volume of the upper Quaternary deposits in which the Paleolithic artefacts can be found and the identification of their ignimbrite substrates. For this reason, the geoelectrical method was selected as the most appropriate for determining the lithostratigraphic subsurface layers. More specifically, a grid of twenty-one (21) Vertical Electrical Soundings (VES) along with an Electrical Resistivity Tomography (ERT) was carried out. The interpretation of the results of these surveys, in conjunction with the results of older excavation trenches, revealed that the Quaternary deposits have been investigated at depths ranging from 0.5 up to 28.5 meters. Furthermore, the lithological boundary of these post-alpine deposits and their underlying pyroclastic ignimbrite flow (with resistivity 24.0–58.0 Ohm.m) seem to dip to the north. The volume of the Quaternary layer is proposed as the maximum depth for archaeological investigation with high chances to recover more Paleolithic material.

| [1] | Galanidou N, Athanassas C, Cole J, et al. (2016) The acheulian site at rodafnidia, Lisvori, on Lesbos, Greece: 2010–2012, Paleoanthropology of the Balkans and Anatolia: Human evolution and its context, Springer, Dordrecht. 119–138. https://doi.org/10.1007/978-94-024-0874-4_8 |
| [2] | Iliopoulos G, Alexopoulos J, Papadopoulou P, et al. (2022) The Acheulean site of Rodafnidia: geology, stratigraphy and chronology. Aegean Acheulean at the Eurasian crossroads Hominin settlement in Eurasia and Africa: 3–5, 25–29, Lesbos, Greece. |
| [3] |
Tian S, Zhang P, Shang T, et al. (2022) Application of resistivity sounding in Quaternary stratigraphic division in Yixing, Eastern China. J Geophys Eng 19: 362–375. https://doi.org/10.1093/jge/gxac025 doi: 10.1093/jge/gxac025

|
| [4] | Alexopoulos JD, Dilalos S, Mitsika GS, et al. (2019) The Contribution of Geophysical Survey to Seismic Hazard Mapping at Farsala basin (Greece). Bull Geol Soc Greece. |
| [5] |
Alexopoulos JD, Dilalos S, Voulgaris N, et al. (2023) The Contribution of Near-Surface Geophysics for the Site Characterization of Seismological Stations. Appl Sci 13: 4932. https://doi.org/10.3390/app13084932 doi: 10.3390/app13084932
|
| [6] |
Alexopoulos JD, Dilalos S (2010) Geophysical research for geological structure determination in the region of South Mesogheia (Attica). Bull Geol Soc Greece 43: 1898–1906. https://doi.org/10.12681/bgsg.11381 doi: 10.12681/bgsg.11381
|
| [7] |
Fountoulis I, Vassilakis E, Mavroulis S, et al. (2015) Synergy of tectonic geomorphology, applied geophysics and remote sensing techniques reveals new data for active extensional tectonism in NW Peloponnese (Greece). Geomorphology 237: 52–64. https://doi.org/10.1016/j.geomorph.2014.11.016 doi: 10.1016/j.geomorph.2014.11.016
|
| [8] | Mitsika GS, Alexopoulos JD, Vassilakis E, et al. (2023) Investigation of the physical-geographical characteristics of river delta with geophysical and satellite data. The case study of Pineios River, Greece. MethodsX 10: 102033. https://doi.org/10.1016/j.mex.2023.102033 |
| [9] | Papadopoulos TD, Alexopoulos JD, Dilalos S (2020) Combined geoelectrical and geoelectromagnetic survey for contributing to local hydrogeological regime—The case study of Delfini basin (Chios isl.—Greece). Geol Geophys Russ South 10: 68–80. https://doi.org/10.23671/VNC.2020.1.59066 |
| [10] |
Abdulkadir YA, Eritro TH (2017) 2D resistivity imaging and magnetic survey for characterization of thermal springs: a case study of Gergedi thermal springs in the northwest of Wonji, Main Ethiopian Rift, Ethiopia. J Afr Earth Sci 133: 95–103. https://doi.org/10.1016/j.jafrearsci.2017.05.001 doi: 10.1016/j.jafrearsci.2017.05.001
|
| [11] |
Bibby HM, Bennie SL, Stagpoole VM, et al. (1994) Resistivity structure of the Waimangu, Waiotapu, Waikite and Reporoa geothermal areas, New Zealand. Geothermics 23: 445–471. https://doi.org/10.1016/0375-6505(94)90013-2 doi: 10.1016/0375-6505(94)90013-2
|
| [12] |
Bibby HM, Caldwell TG, Risk GF (1998) Electrical resistivity image of the upper crust within the Taupo Volcanic Zone, New Zealand. J Geophys Res: Solid Earth 103: 9665–9680. https://doi.org/10.1029/98JB00031 doi: 10.1029/98JB00031
|
| [13] |
Bibby HM, Risk GF, Caldwell TG (2002) Long offset tensor apparent resistivity surveys of the Taupo Volcanic Zone, New Zealand. J Appl Geophys 49: 17–32. https://doi.org/10.1016/S0926-9851(01)00096-9 doi: 10.1016/S0926-9851(01)00096-9
|
| [14] |
Bibby HM, Risk GF, Caldwell TG, et al. (2008) Resistivity structure of western Taupo Volcanic Zone, New Zealand. N Z J Geol Geophys 51: 231–244. https://doi.org/10.1080/00288300809509862 doi: 10.1080/00288300809509862
|
| [15] | Fisseha S, Mewa G, Haile T (2021) Refraction seismic complementing electrical method in subsurface characterization for tunneling in soft pyroclastic (a case study). Heliyon 7: e07680. https://doi.org/10.1016/j.heliyon.2021.e07680 |
| [16] |
İlkişik OM, Gürer A, Tokgöz T, et al. (1997) Geoelectromagnetic and geothermic investigations in the Ihlara Valley geothermal field. J Volcanol Geotherm Res 78: 297–308. https://doi.org/10.1016/S0377-0273(97)00008-5 doi: 10.1016/S0377-0273(97)00008-5
|
| [17] |
Longo V, Testone V, Oggiano G, et al. (2014) Prospecting for clay minerals within volcanic successions: Application of electrical resistivity tomography to characterise bentonite deposits in northern Sardinia (Italy). J Appl Geophys 111: 21–32. https://doi.org/10.1016/j.jappgeo.2014.09.014 doi: 10.1016/j.jappgeo.2014.09.014
|
| [18] |
Markos M, Saka A, Jule LT, et al. (2021) Groundwater potential assessment using vertical electrical sounding and magnetic methods: A case of Adilo Catchment, South Nations, Nationalities and Peoples Regional Government, Ethiopia. Concepts Magn Reson 2021: 1–11. https://doi.org/10.1155/2021/5424865 doi: 10.1155/2021/5424865
|
| [19] |
Risk GF, Bibby HM, Caldwell TG (1993) DC resistivity mapping with the multiple-source bipole-dipole array in the Central Volcanic Region, New Zealand. J Geomagn Geoelectr 45: 897–916. https://doi.org/10.5636/jgg.45.897 doi: 10.5636/jgg.45.897
|
| [20] |
Risk GF, Caldwell TG, Bibby HM (1994) Deep resistivity surveys in the waiotapu-Waikite-Reporoa region, New Zealand. Geothermics 23: 423–443. https://doi.org/10.1016/0375-6505(94)90012-4 doi: 10.1016/0375-6505(94)90012-4
|
| [21] |
Risk GF, Bibby HM, Caldwell TG (1999) Resistivity structure of the central Taupo volcanic zone, New Zealand. J Volcanol Geotherm Res 90: 163–181. https://doi.org/10.1016/S0377-0273(99)00026-8 doi: 10.1016/S0377-0273(99)00026-8
|
| [22] | Eppelbaum LV, Itkis SE, Khesin BE (2006) Detailed magnetic survey unmasks Prehistoric archaeological sites in Israel. 19th EEGS Symposium on the Application of Geophysics to Engineering and Environmental Problems. European Association of Geoscientists & Engineers. https://doi.org/10.3997/2214-4609-pdb.181.138 |
| [23] | Eppelbaum LV, Khesin BE (2001) Disturbing factors in geophysical investigations at archaeological sites and ways of their elimination. Transactions of the IV Conference on Archaeological Prospection, Vienna, Austria, 99–101. |
| [24] |
Eppelbaum LV, Khesin BE, Itkis SE (2010). Archaeological geophysics in arid environments: Examples from Israel. J Arid Environ 74: 849–860. https://doi.org/10.1016/j.jaridenv.2009.04.018 doi: 10.1016/j.jaridenv.2009.04.018
|
| [25] | Hecht J (1974) Geological map of Greece, Sheet Polichnitos (Lesbos Island), Scale 1: 50.000. National Institute of Geological and Mining Research (IGME). Athens, Greece. |
| [26] |
Lamera S, Seymour KS, Vamvoukakis C, et al. (2001) The Polychnitos ignimbrite of Lesvos island. Bull Geol Soc Greece 34: 917–921. https://doi.org/10.12681/bgsg.17118 doi: 10.12681/bgsg.17118
|
| [27] | Lamera S (2004) The Polichnitos ignimbrite of Lesvos island. Ph.D. Thesis University of Patras (in Greek): 272. http://hdl.handle.net/10442/hedi/26632 |
| [28] | Pe-Piper G (1978) The Cenozoic volcanic rocks of Lesbos. Ph.D. Thesis, University of Patras. (in Greek). |
| [29] |
Pe-Piper G, Piper DJW (1993) Revised stratigraphy of the Miocene volcanic rocks of Lesbos, Greece. Neues Jahrb Geol P-M 2: 97–110. https://doi.org/10.1127/njgpm/1993/1993/97 doi: 10.1127/njgpm/1993/1993/97
|
| [30] | Pe-Piper G, Piper DJW (2002) The igneous rocks of Greece. The Anatomy of an Orogen. Gebrüder Borntraeger-Berlin, Stuttgart. G. Catsadorakis: Determinants of raptor abundance, 573. |
| [31] | Thomaidou EL (2009) Geological structure of Lesbos Island. Ph.D. Thesis Aristotelian University of Thessaloniki: 199. (in Greek). http://hdl.handle.net/10442/hedi/19792 |
| [32] | Sotiropoulou S, Kalaitzis M, Sakellariou D, et al. (2022) Plio-Quaternary palaeogeographic evolution of central south Lesbos: implications for Palaeolithic Archaeology. Aegean Acheulean at the Eurasian crossroads Hominin settlement in Eurasia and Africa: 14–15: 25–29. Lesbos, Greece. |
| [33] | Alexopoulos J, Dilalos S, Mitsika GS, et al. (2019) A geophysical approach to the phenomenon of ground fissures at the East Thessaly basin (Greece). 25th European Meeting of Environmental and Engineering Geophysics, 2019: 1–5. |
| [34] |
Oudeika MS, Taşdelen S, Güngör M, et al. (2021) Integrated vertical electrical sounding and hydrogeological approach for detailed groundwater pathways investigation: Gökpınar Dam Lake, Denizli, Turkey. J Afr Earth Sci 182: 104273. https://doi.org/10.1016/j.jafrearsci.2021.104273 doi: 10.1016/j.jafrearsci.2021.104273
|
| [35] |
Zohdy AA (1989) A new method for the automatic interpretation of Schlumberger and Wenner sounding curves. Geophysics 54: 245–253. https://doi.org/10.1190/1.1442648 doi: 10.1190/1.1442648
|


Figures(8) / Tables(1)

John D Alexopoulos, Nikolaos Voulgaris, Spyridon Dilalos, Georgia S Mitsika, Ioannis-Konstantinos Giannopoulos, Vassileios Gkosios, Nena Galanidou. A geophysical insight of the lithostratigraphic subsurface of Rodafnidia area (Lesbos Isl., Greece)[J]. AIMS Geosciences, 2023, 9(4): 769-782. doi: 10.3934/geosci.2023041


 DownLoad: