Patients with inflammatory bowel disease (IBD) often suffer from mood disorders and cognitive decline, which has prompted research into abnormalities in emotional brain regions and their functional analysis. However, most IBD studies only focus on single-modality neuroimaging technologies. Due to a limited spatiotemporal resolution, it is unfeasible to fully explore deep brain source activities and accurately evaluate the brain functional connectivity. Therefore, we propose an electroencephalography (EEG)-functional magnetic resonance imaging (fMRI)source imaging method based on an empirical mode diagram decomposition (EMDD) and performed a synchronous EEG-fMRI source imaging analysis on 21 IBD patients and 11 healthy subjects. The high-frequency spatial components of the fMRI were extracted through EMDD as prior constraints and compared with the EEG source imaging based on the entire fMRI spatial prior. Then, the cortical source time series were reconstructed according to the Desikan-Killiany atlas for an effective connectivity analysis. The results showed that the EEG-fMRI source imaging based on EMDD had a better performance, with the average log model evidence increased by 29.60% and the average explained variance increased by 19.12%. There were significant differences in the activation intensity of a series of abnormal brain regions between IBD patients and healthy controls, some of which were newly discovered: the uncus, claustrum, lentiform nucleus, and lingual gyrus. Moreover, the findings from the effective connectivity analysis of cortical source signals revealed that IBD patients had information flow loss in the frontal lobes, central areas, left parietal lobe, and right temporal lobe, and the information flow intensity of the right lingual gyrus was enhanced.
Citation: Yujie Kang, Wenjie Li, Jidong Lv, Ling Zou, Haifeng Shi, Wenjia Liu. Exploring brain dysfunction in IBD: A study of EEG-fMRI source imaging based on empirical mode diagram decomposition[J]. Mathematical Biosciences and Engineering, 2025, 22(4): 962-987. doi: 10.3934/mbe.2025035
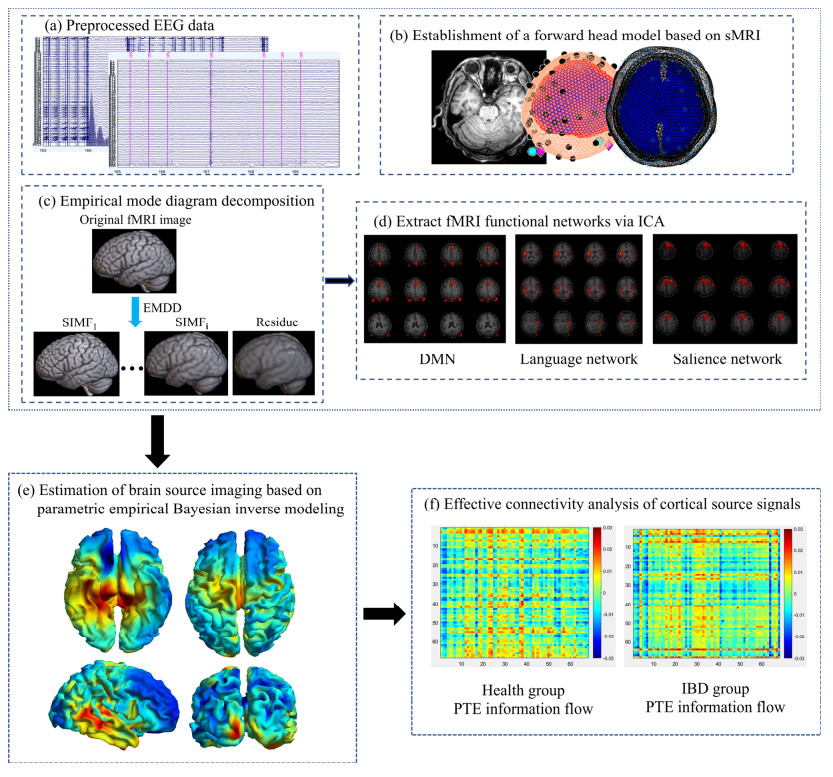
Patients with inflammatory bowel disease (IBD) often suffer from mood disorders and cognitive decline, which has prompted research into abnormalities in emotional brain regions and their functional analysis. However, most IBD studies only focus on single-modality neuroimaging technologies. Due to a limited spatiotemporal resolution, it is unfeasible to fully explore deep brain source activities and accurately evaluate the brain functional connectivity. Therefore, we propose an electroencephalography (EEG)-functional magnetic resonance imaging (fMRI)source imaging method based on an empirical mode diagram decomposition (EMDD) and performed a synchronous EEG-fMRI source imaging analysis on 21 IBD patients and 11 healthy subjects. The high-frequency spatial components of the fMRI were extracted through EMDD as prior constraints and compared with the EEG source imaging based on the entire fMRI spatial prior. Then, the cortical source time series were reconstructed according to the Desikan-Killiany atlas for an effective connectivity analysis. The results showed that the EEG-fMRI source imaging based on EMDD had a better performance, with the average log model evidence increased by 29.60% and the average explained variance increased by 19.12%. There were significant differences in the activation intensity of a series of abnormal brain regions between IBD patients and healthy controls, some of which were newly discovered: the uncus, claustrum, lentiform nucleus, and lingual gyrus. Moreover, the findings from the effective connectivity analysis of cortical source signals revealed that IBD patients had information flow loss in the frontal lobes, central areas, left parietal lobe, and right temporal lobe, and the information flow intensity of the right lingual gyrus was enhanced.

| [1] |
T. H. Taft, A. Bedell, M. R. Craven, L. Guadagnoli, S. Quinton, S. B. Hanauer, Initial assessment of post-traumatic stress in a US cohort of inflammatory bowel disease patients, Inflammatory Bowel Dis., 25 (2019), 1577–1585. https://doi.org/10.1093/ibd/izz032 doi: 10.1093/ibd/izz032

|
| [2] |
T. H. Bisgaard, K. H. Allin, L. Keefer, A. N. Ananthakrishnan, T. Jess, Depression and anxiety in inflammatory bowel disease: epidemiology, mechanisms and treatment, Nat. Rev. Gastroenterol. Hepatol., 19 (2022), 717–726. https://doi.org/10.1038/s41575-022-00634-6 doi: 10.1038/s41575-022-00634-6
|
| [3] |
A. K. Thomann, M. M. Schmitgen, D. Kmuche, M. P. Ebert, P. A. Thomann, K. Szabo, et al., Exploring joint patterns of brain structure and function in inflammatory bowel diseases using multimodal data fusion, Neurogastroenterol. Motil., 33 (2021), e14078. https://doi.org/10.1111/nmo.14078 doi: 10.1111/nmo.14078
|
| [4] |
G. Thapaliya, S. Eldeghaidy, S. J. Radford, S. T. Francis, G. W. Moran, An examination of resting-state functional connectivity in patients with active Crohn's disease, Front. Neurosci., 17 (2023), 1265815. https://doi.org/10.3389/fnins.2023.1265815 doi: 10.3389/fnins.2023.1265815
|
| [5] |
U. A. Kelleci, T. Calhan, A. Sahin, Z. A. Ozemir, R. Kahraman, K. Ozdil, et al., Electroencephalography findings in Crohn's disease, Clin. EEG Neurosci., 50 (2019), 129–133. https://doi.org/10.1177/1550059418767589 doi: 10.1177/1550059418767589
|
| [6] |
A. Kibleur, S. Pellissier, V. Sinniger, J. Robert, E. Gronlier, D. Clarencon, et al., Electroencephalographic correlates of low-frequency vagus nerve stimulation therapy for Crohn's disease, Clin. Neurophysiol., 129 (2018), 1041–1046. https://doi.org/10.1016/j.clinph.2018.02.127 doi: 10.1016/j.clinph.2018.02.127
|
| [7] |
Z. Fang, E. Lynn, M. Huc, S. Fogel, V. J. Knott, N. Jaworska, Simultaneous EEG+fMRI study of brain activity during an emotional Stroop task in individuals in remission from depression, Cortex, 155 (2022), 237–250. https://doi.org/10.1016/j.cortex.2022.07.010 doi: 10.1016/j.cortex.2022.07.010
|
| [8] |
Y. Yang, S. Luo, W. Wang, X. Gao, X. Yao, T. Wu, From bench to bedside: Overview of magnetoencephalography in basic principle, signal processing, source localization and clinical applications, NeuroImage Clin., 42 (2024), 103608. https://doi.org/10.1016/j.nicl.2024.103608 doi: 10.1016/j.nicl.2024.103608
|
| [9] |
K. Yu, X. Niu, B. He, Neuromodulation management of chronic neuropathic pain in the central nervous system, Adv. Funct. Mater., 30 (2020), 1908999. https://doi.org/10.1002/adfm.201908999 doi: 10.1002/adfm.201908999
|
| [10] |
A. Seeland, M. M. Krell, S. Straube, E. A. Kirchner, Empirical comparison of distributed source localization methods for single-trial detection of movement preparation, Front. Hum. Neurosci., 12 (2018), 340. https://doi.org/10.3389/fnhum.2018.00340 doi: 10.3389/fnhum.2018.00340
|
| [11] |
R. Coben, D. C. Hammond, M. Arns, 19 channel z-score and LORETA neurofeedback: Does the evidence support the hype, Appl. Psychophysiol. Biofeedback, 44 (2019), 1–8. https://doi.org/10.1007/s10484-018-9420-6 doi: 10.1007/s10484-018-9420-6
|
| [12] | C. Wei, K. Lou, Z. Wang, M. Zhao, D. Mantini, Q. Liu, Edge sparse basis network: A deep learning framework for EEG source localization, in 2021 International Joint Conference on Neural Networks (IJCNN), (2021), 1–8. https://doi.org/10.1109/IJCNN52387.2021.9533968 |
| [13] |
Z. Jiang, Y. Liu, W. Li, Y. Dai, L. Zou, Integration of simultaneous fMRI and EEG source localization in emotional decision problems, Behav. Brain Res., 448 (2023), 114445. https://doi.org/10.1016/j.bbr.2023.114445 doi: 10.1016/j.bbr.2023.114445
|
| [14] |
S. M. Sadjadi, E. Ebrahimzadeh, M. Shams, M. Seraji, H. S. Zadeh, Localization of epileptic foci based on simultaneous EEG–fMRI data, Front. Neurol., 12 (2021), 645594. https://doi.org/10.3389/fneur.2021.645594 doi: 10.3389/fneur.2021.645594
|
| [15] |
N. Moradi, B. G. Goodyear, R. C. Sotero, Deep EEG source localization via EMD-based fMRI high spatial frequency, Plos One, 19 (2024), e0299284. https://doi.org/10.137/journal.pone.0299284 doi: 10.137/journal.pone.0299284
|
| [16] |
J. Riffi, A. M. Mahraz, A. Abbad, H. Tairi, 3D extension of the fast and adaptive bidimensional empirical mode decomposition, Multidimens. Syst. Signal Process., 26 (2015), 823–834. https://doi.org/10.1007/s11045-014-0283-6 doi: 10.1007/s11045-014-0283-6
|
| [17] |
T. Nguyen, T. Zhou, T. Potter, L. Zou, Y. Zhang, The cortical network of emotion regulation: Insights from advanced EEG-fMRI integration analysis, IEEE Trans. Med. Imaging, 38 (2019), 2423–2433. https://doi.org/10.1109/TML.2019.2900978 doi: 10.1109/TML.2019.2900978
|
| [18] |
B. Wang, A. D. N. Initiative, Enhanced brain efficiency network by integrating the new causality with fMRI and its application for Alzheimer's disease study, Biomed. Signal Process. Control, 86 (2023), 105364. https://doi.org/10.1016/j.bspc.2023.105364 doi: 10.1016/j.bspc.2023.105364
|
| [19] |
S. N. Kalburgi, T. Kleinert, D. Aryan, K. Nash, B. Schiller, T. Koenig, MICROSTATELAB: The EEGLAB Toolbox for resting-state Microstate Analysis, Brain Topogr., 37 (2023), 621–645. https://doi.org/10.1007/s10548-023-01003-5 doi: 10.1007/s10548-023-01003-5
|
| [20] |
M. Amann, M. Andelova, A. Pfister, N. M. Lenke, S. Traud, J. Reinhardt, et al., Subcortical brain segmentation of two dimensional T1-weighted data sets with FMRIB's Integrated Registration and Segmentation Tool (FIRST), NeuroImage Clin., 7 (2015), 43–52. https://doi.org/10.1016/j.nicl.2014.11.010 doi: 10.1016/j.nicl.2014.11.010
|
| [21] | R. K. Niazy, G. Iannetti, C. F. Beckmann, M. Brady, S. M. Smith, Improved FMRI artifact reduction from simultaneously acquired EEG data using slice dependant template matching, NeuroReport, 80 (1999). |
| [22] |
C. Yan, X. Wang, X. Zuo, Y. Zang, DPABI: Data processing & analysis for (resting-state) brain imaging, Neuroinformatics, 14 (2016), 339–351. https://doi.org/10.1007/s12021-016-9299-4 doi: 10.1007/s12021-016-9299-4
|
| [23] |
A. Agosstini, F. Benuzzi, D. Ballotta, F. Rizzello, P. Gionchetti, N. Filippini, Differential brain structural and functional patterns in Crohn's disease patients are associated with different disease stages, Inflammatory Bowel Dis., 29 (2023), 1297–1305. https://doi.org/10.1093/ibd/izad029 doi: 10.1093/ibd/izad029
|
| [24] |
J. Deng, J. Sun, S. Lu, K. Yue, W. Li, H. Shi, et al., Exploring neural activity in inflammatory bowel diseases using functional connectivity and DKI-fMRI fusion, Behav. Brain Res., 443 (2023), 114325. https://doi.org/10.1016/j.bbr.2023.114325 doi: 10.1016/j.bbr.2023.114325
|
| [25] |
K. Friston, L. Harrison, J. Daunizeau, S. Kiebel, C. Phillips, N. T. Barreto, et al., Multiple sparse priors for the M/EEG inverse problem, NeuroImage, 39 (2008), 1104–1120. https://doi.org/10.1016/j.neuroimage.2007.09.048 doi: 10.1016/j.neuroimage.2007.09.048
|
| [26] | X. Lei, Electromagnetic brain imaging based on standardized resting-state networks, in 2012 5th International Conference on BioMedical Engineering and Informatics, (2012), 40–44. https://doi.org/10.1109.BMEI.2012.6512901 |
| [27] |
K. Friston, J. Mattout, N. T. Barreto, J. Ashhburner, W. Penny, Variational free energy and the Laplace approximation, NeuroImage, 34 (2007), 220–234. https://doi.org/10.1016/j.neuroimage.2006.08.035 doi: 10.1016/j.neuroimage.2006.08.035
|
| [28] |
N. J. T. Barreto, E. A. Vazquez, W. D. Penny, Bayesian M/EEG source reconstruction with spatio-temporal priors, NeuroImage, 39 (2008), 318–335. https://doi.org/10.1016/j.neuroimage.2007.07.062 doi: 10.1016/j.neuroimage.2007.07.062
|
| [29] |
R. N. Henson, D. G. Wakeman, V. Litvak, K. J. Friston, A parametric empirical Bayesian framework for the EEG/MEG inverse problem: generative models for multi-subject and multi-modal integration, Front. Hum Neurosci., 5 (2011), 76. https://doi.org/10.3389/fnhum.2011.00076 doi: 10.3389/fnhum.2011.00076
|
| [30] |
X. Geng, X. Fan, Y. Zhong, M. F. Casanova, E. M. Sokhadze, X. Li, et al., Abnormalities of EEG functional connectivity and effective connectivity in children with autism spectrum disorder, Brain Sci., 13 (2023), 130. https://doi.org/10.3390/brainsci13010130 doi: 10.3390/brainsci13010130
|
| [31] |
J. Vorwerk, C. H. Wolters, D. Baumgarten, Global sensitivity of EEG source analysis to tissue conductivity uncertainties, Front. Hum. Neurosci., 18 (2024), 1335212. https://doi.org/10.3389/fnhum.2024.1335212 doi: 10.3389/fnhum.2024.1335212
|
| [32] |
S. J. Vogrin, C. Plummer, EEG source imaging—clinical considerations for EEG acquisition and signal processing for improved temporo-spatial resolution, J. Clin. Neurophysiol., 41 (2024), 8–18. https://doi.org/10.1097/WNP.0000000000001023 doi: 10.1097/WNP.0000000000001023
|
| [33] |
G. Lin, A. Lin, Y. Mi, D. Gu, Measurement of information transfer based on phase increment transfer entropy, Chaos Soliton. Fract., 174 (2023), 113864. https://doi.org/10.1016/j.chaos.2023.113864 doi: 10.1016/j.chaos.2023.113864
|
| [34] |
G. Chiarion, L. Sparacino, Y. Antonacci, L. Faes, L. Mesin, Connectivity analysis in EEG data: A tutorial review of the state of the art and emerging trends, Bioengineering, 10 (2023), 372. https://doi.org/10.3390/bioengineering10030372 doi: 10.3390/bioengineering10030372
|
| [35] |
A. Ekhlasi, A. M. Nasrabadi, M. Mohammadi, Classification of the children with ADHD and healthy children based on the directed phase transfer entropy of EEG signals, Front. Biomed. Technol., 8 (2021). https://doi.org/10.18502/fbt.v8i2.6515 doi: 10.18502/fbt.v8i2.6515
|
| [36] |
C. Jao, C. I. Lau, L. Lien, Y. Tsai, K. Chu, C. Hsiao, et al., Using fractal dimension analysis with the Desikan–Killiany atlas to assess the effects of normal aging on subregional cortex alterations in adulthood, Brain Sci., 11 (2021), 107. https://doi.org/10.3390/brainsci11010107 doi: 10.3390/brainsci11010107
|
| [37] |
A. Z. Snyder, Intrinsic brain activity and resting state networks, Neurosci. in the 21st century, 2022 (2022), 1939–1990. https://doi.org/10.1007/978-3-030-88832-9_133 doi: 10.1007/978-3-030-88832-9_133
|
| [38] |
R. Abreu, J. F. Soares, A. C. Lima, L. Sousa, S. Batista, M. C. Branco, et al., Optimizing EEG source reconstruction with concurrent fMRI-derived spatial priors, Brain Topogr., 35 (2022), 282–301. https://doi.org/10.1007/s10548-022-00891-3 doi: 10.1007/s10548-022-00891-3
|
| [39] |
A. Ojeda, K. K. Delgado, T. Mullen, Fast and robust block-sparse Bayesian learning for EEG source imaging, NeuroImage, 174 (2018), 449–462. https://doi.org/10.1016/j.neuroimage.2018.03.048 doi: 10.1016/j.neuroimage.2018.03.048
|
| [40] |
X. Lei, P. Xu, C. Luo, J. Zhao, D. Zhou, D. Yao, fMRI functional networks for EEG source imaging, Hum. Brain Mapp., 32 (2011), 1141–1160. https://doi.org/10.1002/hbm.21098 doi: 10.1002/hbm.21098
|
| [41] |
S. Yang, M. B. Reveret, Y. J. Choo, M. C. Chang, Association between chronic pain and alterations in the mesolimbic dopaminergic system, Brain Sci., 10 (2020), 701. https://doi.org/10.3390/brainsci10100701 doi: 10.3390/brainsci10100701
|
| [42] |
Y. S. Liaw, G. J. Augustine, The claustrum and consciousness: An update, Int. J. Clin. Health Psychol., 23 (2023), 100405. https://doi.org/10.1016/j.ijchp.2023.100405 doi: 10.1016/j.ijchp.2023.100405
|
| [43] |
D. Zhong, K. Jin, R. Wang, B. Chen, J. Zhang, C. Ren, et al., Microalgae‐based hydrogel for inflammatory bowel disease and its associated anxiety and depression, Adv. Mater., 36 (2024), 2312275. https://doi.org/10.1002/adma.202312275 doi: 10.1002/adma.202312275
|
| [44] |
Y. Yang, T. Wei, W. Yang, S. Hu, H. Jiang, W. Dong, et al., Dysfunction of the lenticular nucleus is associated with dystonia in Wilson's disease, Brain Sci., 13 (2022), 7. https://doi.org/10.3390/brainsci13010007 doi: 10.3390/brainsci13010007
|
| [45] |
B. C. Duchesne, L. T. Stike, G. I. Zubicaray, K. L. McMahon, P. M. Thompson, I. B. Hickie, et al., Lingual gyrus surface area is associated with anxiety-depression severity in young adults: A genetic clustering approach, Eneuro, 5 (2018). https://doi.org/10.1523/ENEURO.0153-17.2017 doi: 10.1523/ENEURO.0153-17.2017
|
| [46] |
C. Koutsarnakis, S. Komaitis, E. Drosos, A. V. Kalyvas, G. P. Skandalakis, F. Liakos, et al., Mapping the superficial morphology of the occipital lobe: Proposal of a universal nomenclature for clinical and anatomical use, Neurosurg. Rev., 44 (2021), 335–350. https://doi.org/10.1007/s10143-019-01212-2 doi: 10.1007/s10143-019-01212-2
|
| [47] |
S. Smerconish, J. E. Schmitt, Neuroanatomical correlates of cognitive dysfunction in 22q11.2 deletion syndrome, Genes, 15 (2024), 440. https://doi.org/10.3390/genes15040440 doi: 10.3390/genes15040440
|
| [48] |
A. Ogura, H. Watanabe, K. Kawabata, R. Ohdake, Y. Tanaka, M. Masuda, et al., Semantic deficits in ALS related to right lingual/fusiform gyrus network involvement, EBioMedicine, 47 (2019), 506–517. https://doi.org/10.1016/j.ebiom.2019.08.022 doi: 10.1016/j.ebiom.2019.08.022
|
| [49] |
N. Aldusary, G. L. Taber, P. Freund, F. C. Fierz, K. P. Weber, A. Baeshhen, et al., Abnormal connectivity and brain structure in patients with visual snow, Front. Hum. Neurosci., 14 (2020), 582031. https://doi.org/10.3389/fnhum.2020.582031 doi: 10.3389/fnhum.2020.582031
|


Figures(9) / Tables(3)

Yujie Kang, Wenjie Li, Jidong Lv, Ling Zou, Haifeng Shi, Wenjia Liu. Exploring brain dysfunction in IBD: A study of EEG-fMRI source imaging based on empirical mode diagram decomposition[J]. Mathematical Biosciences and Engineering, 2025, 22(4): 962-987. doi: 10.3934/mbe.2025035


 DownLoad: