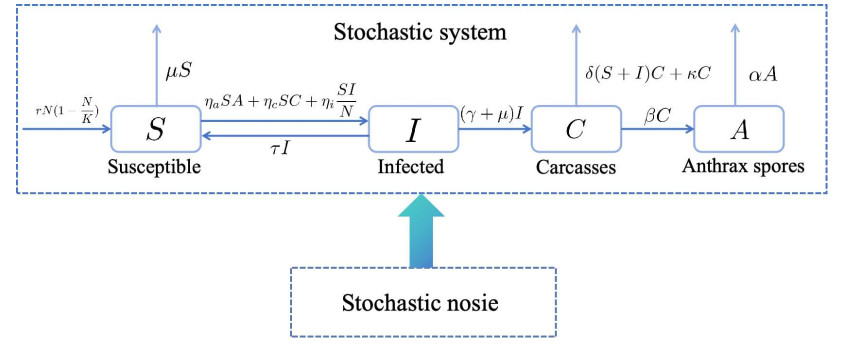
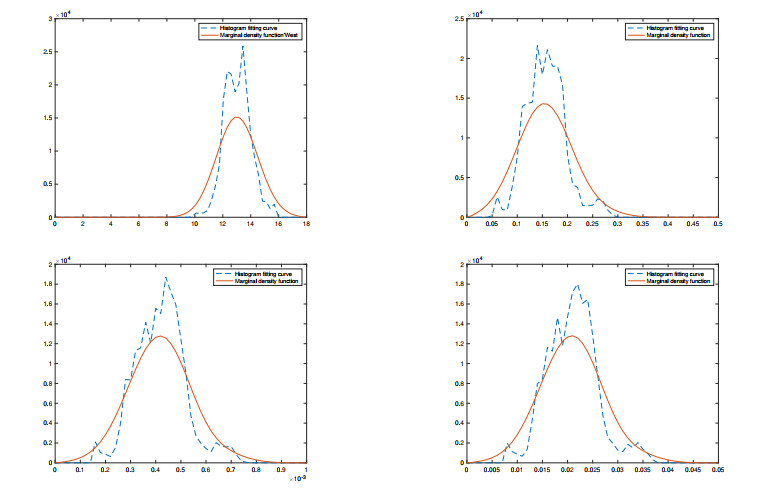
In response to the pressing need to understand anthrax biology, this paper focused on the dynamical behavior of the anthrax model under environmental influence. We defined the threshold parameter $ R^s $, when $ R^s > 1 $; the disease was almost certainly present and the model exists a unique ergodic stationary distribution. Subsequently, statistical features were employed to analyze the dynamic behavior of the disease. The exact representation of the probability density function in the vicinity of the quasi-equilibrium point was determined by the Fokker-Planck equation. Finally, some numerical simulations validated our theoretical results.
Citation: Bing Zhao, Shuting Lyu, Qimin Zhang. Dynamics and density function for a stochastic anthrax epidemic model[J]. Electronic Research Archive, 2024, 32(3): 1574-1617. doi: 10.3934/era.2024072
In response to the pressing need to understand anthrax biology, this paper focused on the dynamical behavior of the anthrax model under environmental influence. We defined the threshold parameter $ R^s $, when $ R^s > 1 $; the disease was almost certainly present and the model exists a unique ergodic stationary distribution. Subsequently, statistical features were employed to analyze the dynamic behavior of the disease. The exact representation of the probability density function in the vicinity of the quasi-equilibrium point was determined by the Fokker-Planck equation. Finally, some numerical simulations validated our theoretical results.

| [1] | N. A. Logan, M. Rodríguez‐Díaz, Bacillus spp. and related genera, Princ. Pract. of Clini. Bacteriol., (2006), 139–158. https://doi.org/10.1002/9780470017968.ch9 |
| [2] | P. R. Murray, K. S. Rosenthal, M. A. Pfaller, Medical Microbiology, Elsevier Health Sciences, 2021. |
| [3] | P. C. Hanna, Ireland J A W, Understanding Bacillus anthracis pathogenesis, Trends. Microbiol., (1999), 180–182. https://doi.org/10.1016/S0966-842X(99)01507-3 |
| [4] |
M. E. Bales, A. L. Dannenberg, P. S. Brachman, A. F. Kaufmann, P. C. Klatsky, D. A. Ashford, Epidemiologic responses to anthrax outbreaks: a review of field investigations, 1950–2001, Emerging Infect. Dis., 8 (2002), 1163. https://doi.org/10.3201/eid0810.020223 doi: 10.3201/eid0810.020223

|
| [5] | J. R. Ezzel, W. C. L. JW, Bacillus anthracis, Pathog. Bact. Infect. Anim., (1993), 36–43. https://doi.org/10.1137/0149110 |
| [6] | N. A. Suverly, B. Kvasnicka, R. Torrell, Anthrax: a guide for livestock producers, University of Nevada-Reno, 2001. https://doi.org/10.1111/j.1863-2378.2008.01135.x |
| [7] |
C. M. Saad-Roy, P. Van den Driessche, A. A. Yakubu, A mathematical model of anthrax transmission in animal populations, Bull. Math. Biol., 79 (2017), 303–324. https://doi.org/10.1007/s11538-016-0238-1 doi: 10.1007/s11538-016-0238-1
|
| [8] |
S. S. Lewerin, M. Elvander, T. Westermark, L. N. Hartzell, A. K. Norström, S. Ehrs, et al., Anthrax outbreak in a Swedish beef cattle herd-1st case in 27 years: Case report, Acta Vet. Scand., 52 (2010), 1–8. https://doi.org/10.1186/1751-0147-52-7 doi: 10.1186/1751-0147-52-7
|
| [9] |
P. R. Furniss, B. D. Hahn, A mathematical model of an anthrax epizoötic in the Kruger National Park, Appl. Math. Modell., 5 (1981), 130–136. https://doi.org/10.1016/0307-904X(81)90034-2 doi: 10.1016/0307-904X(81)90034-2
|
| [10] | S. V. Shadomy, A. E. Idrissi, E. Raizman, Anthrax outbreaks: a warning for improved prevention, control and heightened awareness, Rome, 2016. |
| [11] |
S. B. Clegg, P. C. B. Turnbull, C. M. Foggin, P. M. Lindeque, Massive outbreak of anthrax in wildlife in the Malilangwe Wildlife Reserve, Zimbabwe, Vet. Rec., 160 (2007), 113–118. https://doi.org/10.1136/vr.160.4.113 doi: 10.1136/vr.160.4.113
|
| [12] |
M. N. Mongoh, N. W. Dyer, C. L. Stoltenow, M. L. Khaitsa, Risk factors associated with anthrax outbreak in animals in North Dakota, 2005: A retrospective case-control study, Public Health Rep., 123 (2008), 352–359. https://doi.org/10.1177/003335490812300315 doi: 10.1177/003335490812300315
|
| [13] |
A. Chakraborty, S. U. Khan, M. A. Hasnat, S. Parveen, M. Saiful Islam, A. Mikolon, et al., Anthrax outbreaks in Bangladesh, 2009–2010, Am. J. Trop. Med. Hyg., 86 (2012), 703. https://doi.org/10.4269/ajtmh.2012.11-0234 doi: 10.4269/ajtmh.2012.11-0234
|
| [14] | W. Beyer, P. C. B. Turnbull, Anthrax in animals, Mol. Aspects Med., 30 (2009), 481–489. https://doi.org/10.1016/j.mam.2009.08.004 |
| [15] |
B. D. Hahn, P. R. Furniss, A deterministic model of an anthrax epizootic: threshold results, Ecol. Modell., 20 (1983), 233–241. https://doi.org/10.1016/0304-3800(83)90009-1 doi: 10.1016/0304-3800(83)90009-1
|
| [16] |
A. Friedman, A. A. Yakubu, Anthrax epizootic and migration: Persistence or extinction, Math. Biosci., 241 (2013), 137–144. https://doi.org/10.1016/j.mbs.2012.10.004 doi: 10.1016/j.mbs.2012.10.004
|
| [17] |
S. Mushayabasa, T. Marijani, M. Masocha, Dynamical analysis and control strategies in modeling anthrax, Comput. Appl. Math., 36 (2017), 1333–1348. https://doi.org/10.1007/s40314-015-0297-1 doi: 10.1007/s40314-015-0297-1
|
| [18] |
X. Li, G. Song, Y. Xia, C.Yuan, Dynamical behaviors of the tumor-immune system in a stochastic environment, SIAM J. Appl. Math., 79 (2019), 2193–2217. https://doi.org/10.1137/19M1243580 doi: 10.1137/19M1243580
|
| [19] |
Y. Cai, Y. Kang, M. Banerjee, W. Wang, A stochastic epidemic model incorporating media coverage, Commun. Math. Sci., 14 (2016), 893–910. https://doi.org/10.1186/s13662-018-1925-z doi: 10.1186/s13662-018-1925-z
|
| [20] |
Y. Zhao, D. Jiang, The threshold of a stochastic SIS epidemic model with vaccination, Appl. Math. Comput., 243 (2014), 718–727. https://doi.org/10.1016/j.amc.2014.05.124 doi: 10.1016/j.amc.2014.05.124
|
| [21] |
Q. Liu, D. Jiang, T. Hayat, B. Ahmad, Analysis of a delayed vaccinated SIR epidemic model with temporary immunity and Lévy jumps, Nonlinear Anal. Hybrid Syst., 27 (2018), 29–43. https://doi.org/10.1016/j.nahs.2017.08.002 doi: 10.1016/j.nahs.2017.08.002
|
| [22] |
B. Zhou, D. Jiang, Y. Dai, T. Hayat, Stationary distribution and density function expression for a stochastic SIQRS epidemic model with temporary immunity, Nonlinerar. Dyn., 105 (2021), 931–955. https://doi.org/10.1007/s11071-020-06151-y doi: 10.1007/s11071-020-06151-y
|
| [23] |
Y. Tan, Y. Cai, X. Sun, K. Wang, R. Yao, W. Wang, A stochastic SICA model for HIV/AIDS transmission, Chaos, Solitons Fractals, 165 (2022), 112768. https://doi.org/10.1016/j.chaos.2022.112768 doi: 10.1016/j.chaos.2022.112768
|
| [24] |
L. Imhof, S. Walcher, Exclusion and persistence in deterministic and stochastic chemostat models, J. Differ. Equations, 217 (2005), 26–53. https://doi.org/10.1016/j.jde.2005.06.017 doi: 10.1016/j.jde.2005.06.017
|
| [25] |
X. Mao, Stationary distribution of stochastic population systems, Syst. Control Lett., 60 (2011), 398–405. https://doi.org/10.1016/j.sysconle.2011.02.013 doi: 10.1016/j.sysconle.2011.02.013
|
| [26] |
A. Bahar, X. Mao, Stochastic delay lotka–volterra model, J. Math. Anal. Appl., 292 (2004), 364–380. https://doi.org/10.1016/j.jmaa.2003.12.004 doi: 10.1016/j.jmaa.2003.12.004
|
| [27] | R. Khasminskii, Stochastic stability of differential equations, Springer Science and Business Media, 2011. |
| [28] |
B. Zhou, D. Jiang, Y. Dai, T. Hayat, Ergodic property, extinction, and density function of an SIRI epidemic model with nonlinear incidence rate and high‐order stochastic perturbations, Math. Methods. Appl. Sci., 45 (2022), 1513–1537. https://doi.org/10.1002/mma.7870 doi: 10.1002/mma.7870
|
| [29] |
B. Zhou, X. Zhang, D. Jiang, Dynamics and density function analysis of a stochastic SVI epidemic model with half saturated incidence rate, Chaos, Solitons Fractals, 137 (2020), 109865. https://doi.org/10.1016/j.chaos.2020.109865 doi: 10.1016/j.chaos.2020.109865
|
| [30] |
C. Xu, W. Ou, Y. Pang, Q. Cui, M. U. Rahman, M. Farman, et al., Hopf bifurcation control of a fractional-order delayed turbidostat model via a novel extended hybrid controller, Match-Commun. Math. Comput. Chem., 91 (2024), 367–413. https://doi.org/10.46793/match.91-2.367X doi: 10.46793/match.91-2.367X
|
| [31] |
C. Xu, Z. Liu, Y. Pang, A. Akgül, Stochastic analysis of a COVID-19 model with effects of vaccination and different transition rates: Real data approach, Chaos, Solitons Fractals, 170 (2023), 113395. https://doi.org/10.1016/j.chaos.2023.113395 doi: 10.1016/j.chaos.2023.113395
|
| [32] |
C. Xu, Y. Pang, Z. Liu, J. Shen, M. Liao, P. Li, Insights into COVID-19 stochastic modelling with effects of various transmission rates: simulations with real statistical data from UK, Australia, Spain, and India, Phys. Scr., 99 (2024), 025218. https://doi.org/10.1088/1402-4896/ad186c doi: 10.1088/1402-4896/ad186c
|
| [33] | C. Xu, Y. Zhao, J. Lin, Y. Pang, Z. Liu, J. Shen, et al., Mathematical exploration on control of bifurcation for a plankton–oxygen dynamical model owning delay, J. Math. Chem., (2023), 1–31. https://doi.org/10.1007/s10910-023-01543-y |
| [34] |
W. Ou, C. Xu, Q. Cui, Y. Pang, Z. Liu, J. Shen, et al., Hopf bifurcation exploration and control technique in a predator-prey system incorporating delay, AIMS Math., 9 (2024), 1622–1651. https://doi.org/10.3934/math.2024080 doi: 10.3934/math.2024080
|
| [35] |
Q. Cui, C. Xu, W. Ou, Y. Pang, Z. Liu, P. Li, et al., Bifurcation behavior and hybrid controller design of a 2D Lotka–Volterra commensal symbiosis system accompanying delay, Mathematics, 11 (2023), 4808. https://doi.org/10.3390/math11234808 doi: 10.3390/math11234808
|
| [36] | C. W. Gardiner, Handbook of stochastic methods, Berlin: springer, 1985. |
| [37] | X. Tian, C, Ren, Linear equations, superposition principle and complex exponential notation, Coll. Phys., 23 (2004), 23–25 |
| [38] |
H. Roozen, An asymptotic solution to a two-dimensional exit problem arising in population dynamics, SIAM J. Appl. Math., 49 (1989), 1793–1810. https://doi.org/10.1137/0149110 doi: 10.1137/0149110
|
| [39] |
D. J. Higham, An algorithmic introduction to numerical simulation of stochastic differential equations, SIAM Rev., 43 (2001), 525–546. https://doi.org/10.1137/S0036144500378302 doi: 10.1137/S0036144500378302
|
| [40] |
D. C. Dragon, B. T. Elkin, J. S. Nishi, T. R. Ellsworth, A review of anthrax in Canada and implications for research on the disease in northern bison, J. Appl. Microbiol., 87 (1999), 208–213. https://doi.org/10.1046/j.1365-2672.1999.00872.x doi: 10.1046/j.1365-2672.1999.00872.x
|
| [41] | World Health Organization, International Office of Epizootics, Anthrax in humans and animals, World Health Organization, 2008. |
| [42] |
Z. Shi, D. Jiang, X. Zhang, A. Alsaedi, A stochastic SEIRS rabies model with population dispersal: Stationary distribution and probability density function, Appl. Math. Comput., 427 (2022), 127189. https://doi.org/10.1016/j.amc.2022.127189 doi: 10.1016/j.amc.2022.127189
|
| [43] |
B. Han, B. Zhou, D. Jiang, T. Hayat, A. Alsaedi, Stationary solution, extinction and density function for a high-dimensional stochastic SEI epidemic model with general distributed delay, Appl. Math. Comput., 405 (2021), 126236. https://doi.org/10.1016/j.amc.2021.126236 doi: 10.1016/j.amc.2021.126236
|
| [44] |
H. Yang, F. Wu, P. E. Kloeden, Stationary distribution of stochastic population dynamics with infinite delay, J. Differ. Equations, 340 (2022), 205–226. https://doi.org/10.1016/j.jde.2022.08.035 doi: 10.1016/j.jde.2022.08.035
|
Figures(5) / Tables(2)
Bing Zhao, Shuting Lyu, Qimin Zhang. Dynamics and density function for a stochastic anthrax epidemic model[J]. Electronic Research Archive, 2024, 32(3): 1574-1617. doi: 10.3934/era.2024072


 DownLoad: