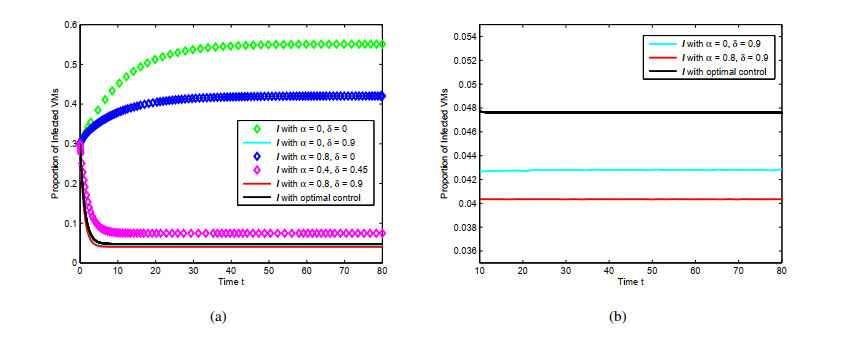
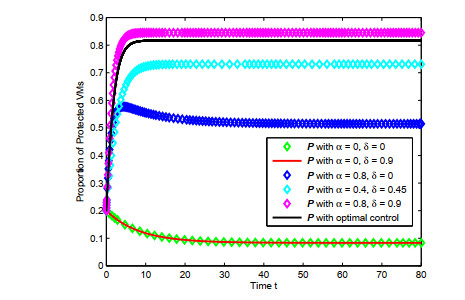
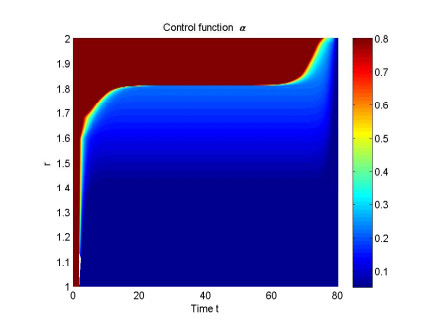
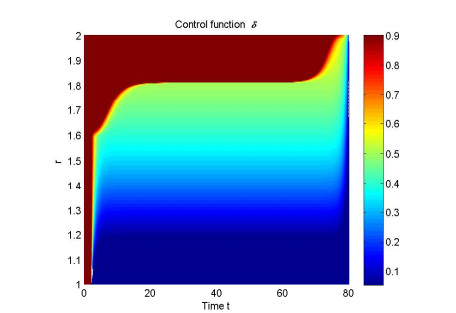
Cloud computing has become a widespread technology that delivers a broad range of services across various industries globally. One of the crucial features of cloud infrastructure is virtual machine (VM) migration, which plays a pivotal role in resource allocation flexibility and reducing energy consumption, but it also provides convenience for the fast propagation of malware. To tackle the challenge of curtailing the proliferation of malware in the cloud, this paper proposes an effective strategy based on optimal dynamic immunization using a controlled dynamical model. The objective of the research is to identify the most efficient way of dynamically immunizing the cloud to minimize the spread of malware. To achieve this, we define the control strategy and loss and give the corresponding optimal control problem. The optimal control analysis of the controlled dynamical model is examined theoretically and experimentally. Finally, the theoretical and experimental results both demonstrate that the optimal strategy can minimize the incidence of infections at a reasonable loss.
Citation: Liang Tian, Fengjun Shang, Chenquan Gan. Optimal control analysis of malware propagation in cloud environments[J]. Mathematical Biosciences and Engineering, 2023, 20(8): 14502-14517. doi: 10.3934/mbe.2023649
Cloud computing has become a widespread technology that delivers a broad range of services across various industries globally. One of the crucial features of cloud infrastructure is virtual machine (VM) migration, which plays a pivotal role in resource allocation flexibility and reducing energy consumption, but it also provides convenience for the fast propagation of malware. To tackle the challenge of curtailing the proliferation of malware in the cloud, this paper proposes an effective strategy based on optimal dynamic immunization using a controlled dynamical model. The objective of the research is to identify the most efficient way of dynamically immunizing the cloud to minimize the spread of malware. To achieve this, we define the control strategy and loss and give the corresponding optimal control problem. The optimal control analysis of the controlled dynamical model is examined theoretically and experimentally. Finally, the theoretical and experimental results both demonstrate that the optimal strategy can minimize the incidence of infections at a reasonable loss.

| [1] |
X. Zhu, J. Wang, H. Guo, D. Zhu, L. T. Yang, L. Liu, Fault-tolerant scheduling for real-time scientific workflows with elastic resource provisioning in virtualized clouds, IEEE Trans. Parallel Distrib. Syst., 27 (2016), 3501–3517. https://doi.org/10.1109/TPDS.2016.2543731 doi: 10.1109/TPDS.2016.2543731

|
| [2] | E. Pluzhnik, E. Nikulchev, Virtual laboratories in cloud infrastructure of educational institutions, in 2014 2nd 2014 2nd International Conference on Emission Electronics (ICEE), (2014), 1–3. |
| [3] |
M. Ali, S. U. Khan, A. V. Vasilakos, Security in cloud computing: Opportunities and challenges, Inform. Sci., 305 (2015), 357–383. https://doi.org/10.1016/j.ins.2015.01.025 doi: 10.1016/j.ins.2015.01.025
|
| [4] |
P. D. Ezhilchelvan, I. Mitrani, Evaluating the probability of malicious co-residency in public clouds, IEEE Trans. Cloud Comput., 5 (2015), 420–427. https://doi.org/10.1109/TCC.2015.2451633 doi: 10.1109/TCC.2015.2451633
|
| [5] | H. El Merabet, A. Hajraoui, A survey of malware detection techniques based on machine learning, Int. J. Adv. Comput. Sci. Appl., 10 (2019). https://doi.org/10.14569/IJACSA.2019.0100148 |
| [6] |
K. Lu, J. Cheng, A. Yan, Malware detection based on the feature selection of a correlation information decision matrix, Mathematics, 11 (2023), 961. https://doi.org/10.3390/math11040961 doi: 10.3390/math11040961
|
| [7] | T. Li, Y. Liu, Q. Liu, W. Xu, Y. Xiao, H. Liu, A malware propagation prediction model based on representation learning and graph convolutional networks, Digital Commun. Networks, 2022. https://doi.org/10.3390/math11040961 |
| [8] |
Y. Ye, T. Li, D. Adjeroh, S. S. Iyengar, A survey on malware detection using data mining techniques, ACM Comput. Surv., 50 (2017), 1–40. https://doi.org/10.1145/3073559. doi: 10.1145/3073559
|
| [9] |
T. Li, Y. Liu, X. Wu, Y. Xiao, C. Sang, Dynamic model of malware propagation based on tripartite graph and spread influence, Nonlinear Dyn., 101 (2020), 2671–2686. https://doi.org/10.1007/s11071-020-05935-6 doi: 10.1007/s11071-020-05935-6
|
| [10] | F. Mira, A systematic literature review on malware analysis, in 2021 IEEE International IOT, Electronics and Mechatronics Conference (IEMTRONICS), (2021), 1–5. https://doi.org/10.1109/IEMTRONICS52119.2021.9422537 |
| [11] | Q. Zhu, Y. Liu, X. Luo, K. Cheng, A malware propagation model considering conformity psychology in social networks, Axioms, 11 (2022). https://doi.org/10.3390/axioms11110632 |
| [12] |
X. Ye, S. Xie, S. Shen, Sir1r2: Characterizing malware propagation in wsns with second immunization, IEEE Access, 9 (2021), 82083–82093. https://doi.org/10.1109/ACCESS.2021.3086531 doi: 10.1109/ACCESS.2021.3086531
|
| [13] |
N. P. Dong, H. V. Long, N. T. K. Son, The dynamical behaviors of fractional-order se1e2iqr epidemic model for malware propagation on wireless sensor network, Commun. Nonlinear Sci. Numerical Simul., 111 (2022), 106428. https://doi.org/10.1016/j.cnsns.2022.106428 doi: 10.1016/j.cnsns.2022.106428
|
| [14] |
S. M. Al-Tuwairqi, W. S. Bahashwan, The impact of quarantine strategies on malware dynamics in a network with heterogeneous immunity, Math. Model. Anal., 27 (2022), 282–302. https://doi.org/10.3846/mma.2022.14391 doi: 10.3846/mma.2022.14391
|
| [15] |
A. Martin del Rey, G. Hernandez, A. Bustos Tabernero, A. Queiruga Dios, Advanced malware propagation on random complex networks, Neurocomputing, 423 (2021), 689–696. https://doi.org/10.1016/j.neucom.2020.03.115 doi: 10.1016/j.neucom.2020.03.115
|
| [16] |
J. R. C. Piqueira, M. A. Cabrera, C. M. Batistela, Malware propagation in clustered computer networks, Phys. A Stat. Mech. Appl., 573 (2021), 125958. https://doi.org/10.1016/j.physa.2021.125958 doi: 10.1016/j.physa.2021.125958
|
| [17] | W. Zhang, Z. Wang, Z. Zhang, J. Zou, Delay effect on a malware propagation model incorporating user awareness, in 2022 International Conference on Cyber-Physical Social Intelligence (ICCSI), (2022), 555–560. https://doi.org/10.1109/ICCSI55536.2022.9970556 |
| [18] |
L. Li, J. Cui, R. Zhang, H. Xia, X. Cheng, Dynamics of complex networks: Malware propagation modeling and analysis in industrial internet of things, IEEE Access, 8 (2020), 64184–64192. https://doi.org/10.1109/ACCESS.2020.2984668 doi: 10.1109/ACCESS.2020.2984668
|
| [19] |
M. N. Aman, U. Javaid, B. Sikdar, Iot-proctor: A secure and lightweight device patching framework for mitigating malware spread in iot networks, IEEE Syst. J., 16 (2022), 3468–3479. https://doi.org/10.1109/JSYST.2021.3070404 doi: 10.1109/JSYST.2021.3070404
|
| [20] |
S. Hosseini, M. A. Azgomi, Dynamical analysis of a malware propagation model considering the impacts of mobile devices and software diversification, Phys. A Stat. Mech. Appl., 526 (2019), 120925. https://doi.org/10.1016/j.physa.2019.04.161 doi: 10.1016/j.physa.2019.04.161
|
| [21] |
S. Hosseini, Defense against malware propagation in complex heterogeneous networks, Cluster Comput., 24 (2021), 1199–1215. https://doi.org/10.1007/s10586-020-03181-4 doi: 10.1007/s10586-020-03181-4
|
| [22] | R. Hassan, S. Rafatirad, H. Homayoun, S. M. P. Dinakarrao, Performance-aware malware epidemic confinement in large-scale iot networks, in ICC 2021 - IEEE International Conference on Communications, (2021), 1–6. https://doi.org/10.1109/ICC42927.2021.9500476 |
| [23] |
S. Shen, H. Zhou, S. Feng, J. Liu, H. Zhang, Q. Cao, An epidemiology-based model for disclosing dynamics of malware propagation in heterogeneous and mobile wsns, IEEE Access, 8 (2020), 43876–43887. https://doi.org/10.1109/ACCESS.2020.2977966 doi: 10.1109/ACCESS.2020.2977966
|
| [24] |
L. Miao, S. Li, Stochastic differential game-based malware propagation in edge computing-based iot, Secur. Commun. Networks, 2021 (2021), 1–11. https://doi.org/10.1155/2021/8896715 doi: 10.1155/2021/8896715
|
| [25] |
V. S. Varma, Y. Hayel, I.-C. Morarescu, A non-cooperative resource utilization game between two competing malware, IEEE Control Syst. Lett., 7 (2023), 67–72. https://doi.org/10.1109/LCSYS.2022.3186620 doi: 10.1109/LCSYS.2022.3186620
|
| [26] |
L. Wang, S. S. Iyengar, A. K. Belman, P. Śniatała, V. V. Phoha, C. Wan, Game theory based cyber-insurance to cover potential loss from mobile malware exploitation, Digital Threats Res. Pract., 2 (2021), 1–24. https://doi.org/10.1145/3409959 doi: 10.1145/3409959
|
| [27] |
H. Zhou, S. Shen, J. Liu, Malware propagation model in wireless sensor networks under attack-defense confrontation, Comput. Commun., 162 (2020), 51–58. https://doi.org/10.1016/j.comcom.2020.08.009 doi: 10.1016/j.comcom.2020.08.009
|
| [28] | Z. Benomar, C. Ghribi, E. Cali, A. Hinsen, B. Jahnel, Agent-based modeling and simulation for malware spreading in d2d networks, preprint, arXiv: 2201.12230. |
| [29] |
F. Abazari, M. Analoui, H. Takabi, Effect of anti-malware software on infectious nodes in cloud environment, Comput. Secur., 58 (2016), 139–148. https://doi.org/10.1016/j.cose.2015.12.002 doi: 10.1016/j.cose.2015.12.002
|
| [30] |
C. Gan, Q. Feng, X. Zhang, Z. Zhang, Q. Zhu, Dynamical propagation model of malware for cloud computing security, IEEE Access, 8 (2020), 20325–20333. https://doi.org/10.1109/ACCESS.2020.2968916 doi: 10.1109/ACCESS.2020.2968916
|
| [31] | M. I. Kamien, N. L. Schwartz, Dynamic optimization: the calculus of variations and optimal control in economics and management, Courier Corporation, 2012. |
| [32] | E. Pluzhnik, E. Nikulchev, S. Payain, Optimal control of applications for hybrid cloud services, in 2014 IEEE World Congress on Services, 2014,458–461. https://doi.org/10.1109/SERVICES.2014.88 |
| [33] |
Q. Zhu, X. Yang, L. X. Yang, C. Zhang, Optimal control of computer virus under a delayed model, Appl. Math. Comput., 218 (2012), 11613–11619. https://doi.org/10.1016/j.amc.2012.04.092 doi: 10.1016/j.amc.2012.04.092
|
| [34] |
L. Chen, K. Hattaf, J. Sun, Optimal control of a delayed slbs computer virus model, Phys. A Stat. Mech. Appl., 427 (2015), 244–250. https://doi.org/10.1016/j.physa.2015.02.048 doi: 10.1016/j.physa.2015.02.048
|
| [35] |
L. X. Yang, M. Draief, X. Yang, The optimal dynamic immunization under a controlled heterogeneous node-based sirs model, Phys. A Stat. Mech. Appl., 450 (2016), 403–415. https://doi.org/10.1016/j.physa.2016.01.026 doi: 10.1016/j.physa.2016.01.026
|
| [36] | R. C. Robinson, An introduction to dynamical systems: Continuous and discrete, American Mathematical Soc., 2012. |
| [37] | J. Stewart, Multivariable calculus: Concepts and contexts, Cengage Learning, 2018. |
| [38] | D. Liberzon, Calculus of variations and optimal control theory: A concise introduction, Princeton university press, 2011. |
Figures(4) / Tables(1)

Liang Tian, Fengjun Shang, Chenquan Gan. Optimal control analysis of malware propagation in cloud environments[J]. Mathematical Biosciences and Engineering, 2023, 20(8): 14502-14517. doi: 10.3934/mbe.2023649


 DownLoad: