Figure 1.
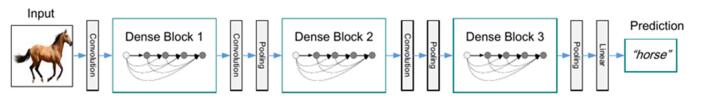
A deep DenseNet with three dense blocks.


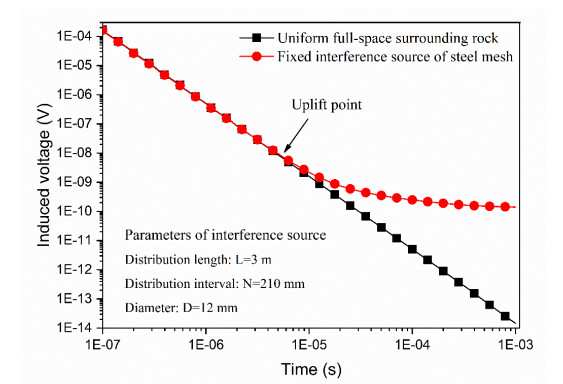
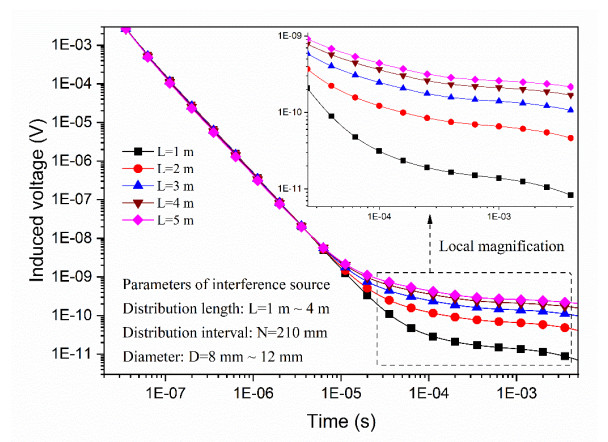
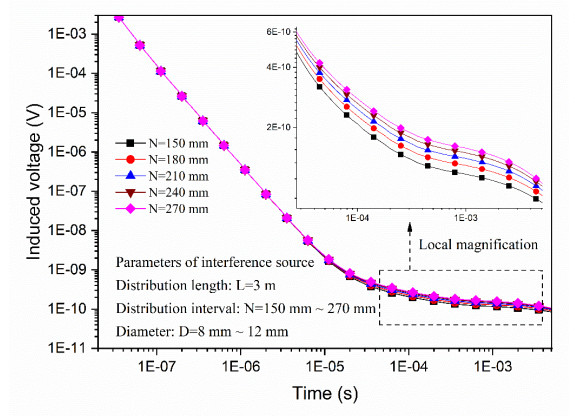
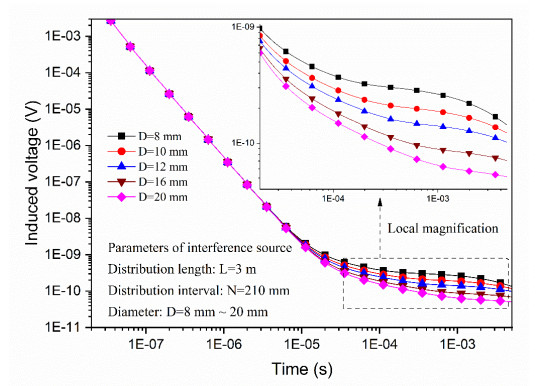
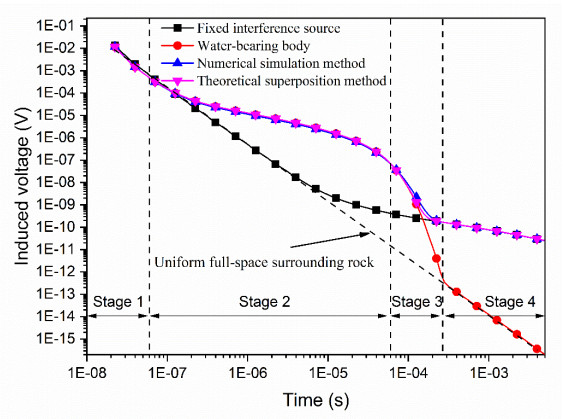
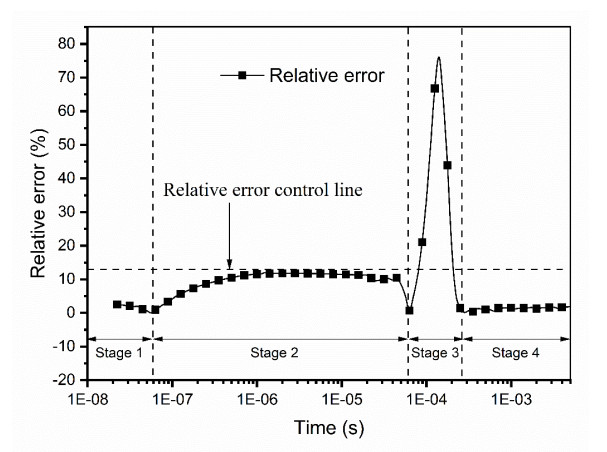
The detection effect of the transient electromagnetic method is ambiguous in engineering applications due to the existence of interference sources, so explaining the influence of these fixed interference sources on is crucial. In this paper, the response characterisation of transient electromagnetic signals of fixed interference sources are thoroughly investigated. First, the secondary field generated by these interference sources is analyzed, and a typical fixed interference source is calculated. Then, a sensitivity analysis of the transient electromagnetic response curve is carried out. Finally, the mathematical superposition method for multiple field sources is proposed and verified. The results illustrate that the transient electromagnetic response curve of uniform full-space surrounding rock with a single fixed interference source has an apparent lifting phenomenon in the middle stage and presents an approximate horizontal change rule at the late stage. The transient electromagnetic response curves of multiple field sources separately illustrate the response characterisation of different field sources at different time stages. These research results can provide a valuable reference for the on-site interpretation of detection signals.
Citation: Wangping Qian, Yikang Xu, Zhenyuan Gu, Ziru Xiang, Zongyang Li, Jinchao Liu, Jiujiang Wu. Characterisation of transient electromagnetic signals during fixed interference sources in tunnel structure[J]. Mathematical Biosciences and Engineering, 2021, 18(5): 6907-6925. doi: 10.3934/mbe.2021343
| [1] | Mingwei Wang, Kaisheng Shi, Zhao Wang, Rui Yan, Tao Lei, Jiaqin Xiao . Multi-slot energy harvesting wireless communication in interference environment. Mathematical Biosciences and Engineering, 2021, 18(4): 4127-4145. doi: 10.3934/mbe.2021207 |
| [2] | Yikang Xu, Zhaohua Sun, Wei Gu, Wangping Qian, Qiangru Shen, Jian Gong . Three-dimensional inversion analysis of transient electromagnetic response signals of water-bearing abnormal bodies in tunnels based on numerical characteristic parameters. Mathematical Biosciences and Engineering, 2023, 20(1): 1106-1121. doi: 10.3934/mbe.2023051 |
| [3] | Peter A. Braza . A dominant predator, a predator, and a prey. Mathematical Biosciences and Engineering, 2008, 5(1): 61-73. doi: 10.3934/mbe.2008.5.61 |
| [4] | Zongyang Li, Taiyue Qi, Shaojie Qin, Wangping Qian . The research on minimizing the induction between the transmitting and receiving coils in close range transient electromagnetic inspection of groundwater-related defects in the operating tunnels. Mathematical Biosciences and Engineering, 2021, 18(4): 4508-4527. doi: 10.3934/mbe.2021229 |
| [5] | Zhibo Liu, Yu Yuan, Ling Yu, Yingjie Li, Jiyou Fei . A novel threshold segmentation instantaneous frequency calculation approach for fault diagnosis. Mathematical Biosciences and Engineering, 2020, 17(5): 5395-5413. doi: 10.3934/mbe.2020291 |
| [6] | Xiao Liang, Taiyue Qi, Zhiyi Jin, Wangping Qian . Hybrid support vector machine optimization model for inversion of tunnel transient electromagnetic method. Mathematical Biosciences and Engineering, 2020, 17(4): 3998-4017. doi: 10.3934/mbe.2020221 |
| [7] | H. T. Banks, D. Rubio, N. Saintier, M. I. Troparevsky . Optimal design for parameter estimation in EEG problems in a 3D multilayered domain. Mathematical Biosciences and Engineering, 2015, 12(4): 739-760. doi: 10.3934/mbe.2015.12.739 |
| [8] | Ankai Liu, Felicia Maria G. Magpantay, Kenzu Abdella . A framework for long-lasting, slowly varying transient dynamics. Mathematical Biosciences and Engineering, 2023, 20(7): 12130-12153. doi: 10.3934/mbe.2023540 |
| [9] | Xuyang Xie, Zichun Yang, Lei Zhang, Guoqing Zeng, Xuefeng Wang, Peng Zhang, Guobing Chen . An improved Autogram and MOMEDA method to detect weak compound fault in rolling bearings. Mathematical Biosciences and Engineering, 2022, 19(10): 10424-10444. doi: 10.3934/mbe.2022488 |
| [10] | Krzysztof Fujarewicz, Marek Kimmel, Andrzej Swierniak . On Fitting Of Mathematical Models Of Cell Signaling Pathways Using Adjoint Systems. Mathematical Biosciences and Engineering, 2005, 2(3): 527-534. doi: 10.3934/mbe.2005.2.527 |
The detection effect of the transient electromagnetic method is ambiguous in engineering applications due to the existence of interference sources, so explaining the influence of these fixed interference sources on is crucial. In this paper, the response characterisation of transient electromagnetic signals of fixed interference sources are thoroughly investigated. First, the secondary field generated by these interference sources is analyzed, and a typical fixed interference source is calculated. Then, a sensitivity analysis of the transient electromagnetic response curve is carried out. Finally, the mathematical superposition method for multiple field sources is proposed and verified. The results illustrate that the transient electromagnetic response curve of uniform full-space surrounding rock with a single fixed interference source has an apparent lifting phenomenon in the middle stage and presents an approximate horizontal change rule at the late stage. The transient electromagnetic response curves of multiple field sources separately illustrate the response characterisation of different field sources at different time stages. These research results can provide a valuable reference for the on-site interpretation of detection signals.
To prevent the websites from being maliciously accessed by the automatic program in a short time and wasting network resources, the CAPTCHA (Completely Automated Public Turing Test to Tell Computers and Humans Apart) came into being. At present, the major websites have designed kinds of CAPTCHA with low resolution, multi-noise points, deformation characters, and adhesive characters. Therefore, designing a CAPTCHA recognition method can help to verify the security of existing various forms of CAPTCHA and assist in creating more robust CAPTCHAs. At the same time, CAPTCHA recognition technology can also be applied in the area of license plate recognition, optical character recognition, handwriting recognition and so on. Scholars at home and abroad have done a lot of researches and got some progress in this field, which includes the traditional CAPTCHA recognition methods and the CAPTCHA recognition methods based on deep learning.
The traditional methods usually locate a single number or character area in an image and identify a single character after segmentation. For example, Lu Wang et al. [1] focused on the recognition of merged characters and proposed a method based on the local minimum and minimum projection values. It firstly divided the fuzzy-bonded characters and then combined the convolutional neural network (CNN) to identify a single character. But the recognition rate was only 38%. Yan et al. [2] successfully segmented the Microsoft CAPTCHA and recognized it by multiple classifiers, but the recognition rate was only 60%. Liang Zhang et al. [3] proposed a method based on LSTM (Long Short-Term Memory Network) recurrent neural network (RNN) for recognition. Long Yin et al. [4] suggested an approach based on dense scale-invariant feature transform (DENSE SIFT) and random sampling consistency algorithm (RANSAC), which had a recognition rate of 88% for simple sticky characters. It also had a good effect for the difficult twisted CAPTCHA. Hao Li et al. [5] proposed a Harris image matching method combining adaptive threshold and RANSAC. Lingyun Xiang et al. [6] used an adaptive binary arithmetic coding to encode English letters. After that, they also proposed a novel hashing method, called discrete multi-graph hashing [7]. Yuling Liu et al. [8] proposed a valid method for outsourced word segmentation, which saved storage space. Haitao Tang et al. [9] suggested a self-organizing incremental neural network based on PNN-SOINN-RBF. The overall prediction accuracy of single characters on the verification set of offline and online models were72.75% and 50.25%. Yang Wang [10] et al. proposed a three-color denoising method based on RGB, using the method of segmentation character combined with contour difference projection and water droplet algorithm. This method had an excellent recognition effect on the CAPTCHA with background noise and character distortion adhesion. Yishan Chen et al. [11] proposed a method based on traditional digital image morphological processing technology for the segmentation and recognition of CAPTCHA, with the recognition rate of 60%. Ye Wang et al. [12] proposed a new adaptive algorithm to denoise and segment the CAPTCHA images, and used OCR (Optical Character Recognition) and template matching method to recognize a single character. Wentao Ma et al. [13] proposed an adaptive median filtering algorithm based on divide and conquer. Jinwei Wang et al. [14] proposed the CQWT-based forensics scheme for color images to distinguish CG and PG images. Inevitably, the above methods adopt manual data processing; there were three problems as follows:
(1) The way of direct segmentation for the adhesive CAPTCHA images is easy to cause character defects and agammaavate the training task.
(2) Based on the global statistical feature or local feature descriptor of color, texture and shape, the extracted feature cannot accurately represent the images.
(3) Due to the imbalance of data, the results of classifier training are often not ideal and the selection of parameters adds a lot of difficulties for classifier training.
It was proved that a single feature could not adequately represent the image details [15]. The combination of both global and local features was used in image recognition method to achieve good performance [16]. With the rapid development and rise of artificial intelligence, the convolutional neural networks, by using the shared convolution kernel, have shown the effectiveness for multi-feature extraction and achieved excellent classification performance for two-dimensional graphs with invariant displacement, scaling and other forms of distortion. For example, Mingli Wen et al. [17] built a CNN with only five layers, which achieved recognition accuracy as high as 99%. Peng Yu et al. [18] used the AlexNet for CAPTCHA recognition. After 20000 iterations, the recognition accuracy of this model was 99.43%. Zhang et al. [19] improved the LeNet-5, and the recognition accuracy was also as high as 95.2%. Shuren Zhou et al. [20] proposed a traffic sign recognition algorithm based on IVGG. Wei Fang et al. [21] proposed an image recognition model based on CNN, which can enhance the classification model and effectively improve the accuracy of image recognition. Lv Yanping et al. [22] used CNN to identify Chinese CAPTCHA images with distortion, rotation, and background noise. Garg and Pollett [23] developed a single neural network capable of breaking all character-based CAPTCHA. Yunhang Shen et al. [24] proposed a structural model based on multi-scale Angle to identify the currently popular Touclick Chinese CAPTCHA images. Wang Fan et al. [25] used the Keras framework for building CNN to identify Chinese CAPTCHA images with an accuracy of 92.8%. Directly input the CAPTCHA images into the trained CNN to identify which can effectively simplify manual intervention such as character segmentation, position and noise problems. Overall our main contributions are as follows: (1) we propose a CAPTCHA recognition method based on the deep CNN. By identifying different types of CAPTCHA images, it can improve the recognition accuracy and provide a convenient way for the website users to verify the security of their CAPTCHAs; (2) we design a new DenseNet that effectively reduces the memory consumption and show excellent performance.
In 2017, Gao Huang and Zhuang Liu et al. [26] constructed 4 deep CNN called DenseNets, which connected every two layers in the network with "skip-connection." It means that the input of each layer is the union of the output of all the preceding layers, which is different from the traditional network where each layer is only connected to the subsequent layers. The DenseNets have several compelling advantages: they solve the problem of gradient dispersion, and effectively utilize the features of all the preceding convolutional layers, which reduce the computational complexity of the network parameters and show excellent classification performance.
| xl=Hl([x1,x2,……,xl−1]) | (1) |
In Eq 1, xl indicates that the lth layer received the feature mapping of all the preceding convolutional layers as input, and [x1,x2,……,xl−1] is a tensor referred to the concatenation of the feature-maps. Therefore, even the last layer can receive the output of the first layer as input. As shown in Figure 1, Gao Huang inputs a given image into the DenseNets, then the network will predict the classification result after convolution and pooling in three Dense Blocks.
Gao Huang and Zhuang Liu have designed 4 networks, such as DenseNet-121, DenseNet-169, DenseNet-201, and DenseNet-264. However, all the DenseNets' convolutional groups are 12 times in Dense Block 2. But Ma N et al. [27] proved that convolutional groups increased the complexity of the network and occupied much memory resources. Therefore, we improve the structural of DenseNets and propose a CAPTCHA identification method based on the DenseNets.
Based on the architecture of the DenseNets, we build a new deep CNN called the DFCR.
Firstly, the original CAPTCHA images with a size of 224×224 are convoluted and pooled to output the cropped CAPTCHA images with a size of 56×56.
After that, 4 dense blocks are concatenated in turn. In each dense block, the "skip connection" and BN→ReLU→Conv(1×1)→BN→ReLU→Conv(3×3) are performed between every two layers, and the transition layer is connected after the first three dense blocks. The structure of the transition layer is constructed by BN→Conv(1×1)→AvgPool(2×2) to implement down-sampling, which is used here to reduce the dimension of the feature-maps and parameters and helps eliminate the computational bottleneck. More importantly, we set the convolutional group of the bottleneck layers as 6 in the Dense Block 2, which is hugely different from Gao Huang's DenseNets.
Finally, the feature-maps are used to represent the confidence map of a class directly. The values in each feature-maps are added to obtain the average value, which is then taken as the confidence value of a class and input into the corresponding softmax layer for classification. The classification layer is composed of global average pooling and softmax, which has fewer parameters and effectively prevents data overfitting. Since the Dataset #1 has 5 characters, we use the multi-task classification method to access 5 softmax classifiers. The Dataset #2 has 4 characters, so the last fully connected layer is changed to 4 dense layers. For the Dataset #3 which has 4 characters, we only need to recognize the Chinese character that is rotated 90° at random, so the original network design can be maintained. The DFCR's architecture is shown in Table 1. The growth rate k is 32. Note that each "conv" layer shown in the table corresponds to the sequence BN→ReLU→Conv.
| Layers | Output Size | Dataset #1 | Dataset #2 | Dataset #3 |
| Convolution | 112×112 | 7×7conv, stride2 | ||
| Pooling | 56×56 | 3×3max pool, stride2 | ||
| Dense Block (1) | 56×56 | (1×1conv3×3conv)×6 | ||
| Transition (1) | 56×56 | 1×1conv | ||
| 28×28 | 2×2average pool, stride2 | |||
| Dense Block (2) | 28×28 | (1×1conv3×3conv)×6 | ||
| Transition (2) | 28×28 | 1×1conv | ||
| 14×14 | 2×2average pool, stride2 | |||
| Dense Block (3) | 14×14 | (1×1conv3×3conv)×24 | ||
| Transition (3) | 14×14 | 1×1conv | ||
| 7×7 | 2×2average pool, stride2 | |||
| Dense Block (4) | 7×7 | (1×1conv3×3conv)×16 | ||
| 7×7global average pool | ||||
| Classification Layer | 1×1 | 5×1000Dfully-connected, softmax | 4×1000Dfully-connected, softmax | 1000Dfully-connected, softmax |
 DownLoad:
CSV
DownLoad:
CSV
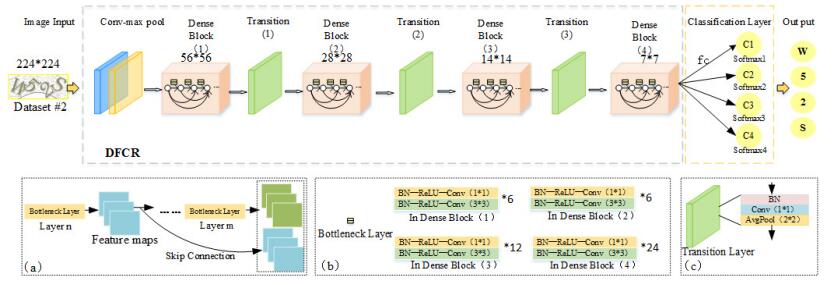
Figure 2 shows the process of identifying the image "W52S" by the DFCR we built. First, the network can be input 224×224 images directly. Then, it is linked with a convolution and max pool layer, and 4 dense blocks with 3 transition blocks, and produces 7×7 feature-maps. Particularly, we design 4 softmax layers at the end of the network for Dataset #2. (a) illustrates the "skip connection" is that the nth layer is directly connected to the mth layer. The nth layer outputs k1 feature-maps, and the mth layer convolutes to get k2 feature-maps, so the mth layer outputs (k1+k2) feature-maps. (b) illustrates each dense block has a different number of bottleneck layers. (c) shows that the average pool layer is used to modified transition block.
In this paper, we used three types of CAPTCHA images given by the organizing committee in the 9th China University Student Service Outsourcing Innovation and Entrepreneurship Competition, with each class consists of 15000 CAPTCHA images. We randomly selected 8000 for training, 2000 for validation and 5000 for test. The characteristics of the three types of CAPTCHA images are as follows: The Dataset #1 is a five-character CAPTCHA composed of 10 digits and 26 upper and lower case English letters randomly without slant. The Dataset #2 is a four-character CAPTCHA consisting of 10 digits and 26 uppercase English letters randomly, with skew, noisy and irregular curves. The Dataset #3 is a four-character CAPTCHA composed of Chinese characters, and one character is randomly rotated by 90°. So, the recognition difficulty of these three types of CAPTCHA images increases successively. Table 2 shows the CAPTCHA examples of the three types.
| Type | Sample 1 | Sample 2 |
| Dataset #1 | 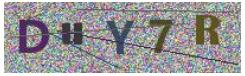 |
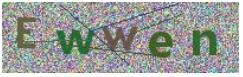 |
| Dataset #2 |  |
 |
| Dataset #3 |  |
 |
DownLoad:
CSV
We used the Windows 10 operating system, Inter(R) Core(TM) i5-8400 processor, GTX 1060, and our experiments were completed on Keras. Keras is a high-level neural network API which is very modular, minimal, and extensible.
In our experiment, we first normalized the CAPTCHA images to the size of 224×224 and converted it to the TFrecord format. All the networks were trained using stochastic gradient descent (SGD) with the initial learning rate α = 0.001. Limited by the GPU running memory, we set the batch size as 16 for 100 epochs.
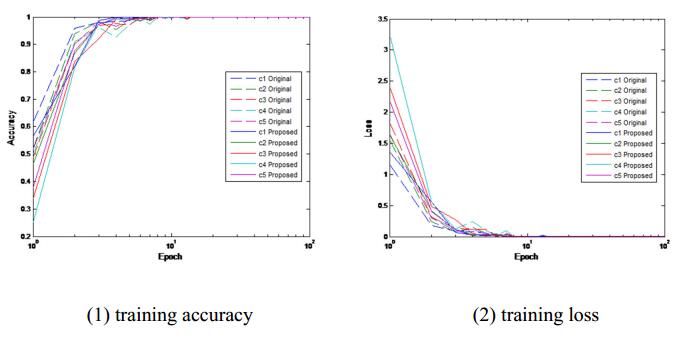
As shown in Figure 3, (1) and (2) respectively show the training accuracy and loss value of the Dataset #1 in 100 epochs, the solid line indicates 5 classifiers of DFCR, and the dotted line indicates DenseNet-121's. It can be seen from the exact value that although the training accuracy of DFCR is not as high as that of DenseNet-121 at begin, but the gradient of training accuracy is faster than DenseNet-121 in the subsequent iteration, especially in the 3 epoch. Then the exact value has reached 98.6%, which also shows that reducing the convolutional group is beneficial to improve the ability of the model to train and accelerate the convergence. At the same time, the DFCR loss value converges faster in the first three epochs. After 6 epochs, the model tends to be stable and the DenseNet-121 loss value converges more quickly in the first 6 epochs. After 11 epochs, the model is almost stable.
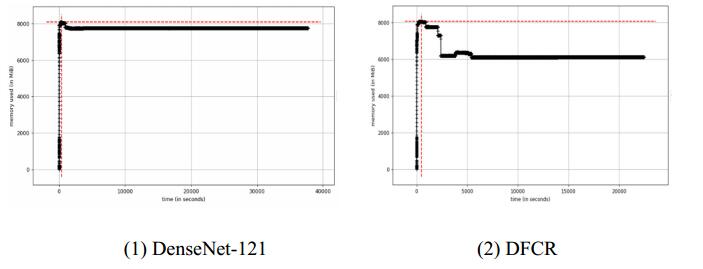
As shown in Figure 4, it is the memory consumption and the training duration for 100 epochs. It can be seen that the memory consumption of the DenseNet-121 network during training is close to 80%, and the DFCR we built is only about 60%. And the training time has been reduced by nearly 3 hours. Thus, the DFCR reduces memory consumption and model training time.
We compare the CAPTCHA identification accuracy and parameters of DFCR with the ResNet-50 and the DenseNet-121. Three types of 5000 CAPTCHA test sets of the TFrecords format are input to the trained optimal model, then the recognition accuracy is performed according to the existing tags, and the results are recorded in Table 3 and 4.
| Dataset #1 | Dataset #2 | Dataset #3 | ||||
| Validation set 2000 | Test set 5000 | Validation set 2000 | Test set 5000 | Validation set 2000 | Test set 5000 | |
| ResNet50 | 99.70% | 95.34% | 99.95% | 99.90% | 99.95% | 99.86% |
| DenseNet-121 | 99.80% | 95.40% | 99.95% | 99.90% | 100% | 99.92% |
| DFCR | 99.80% | 99.60% | 100% | 99.96% | 100% | 99.94% |
DownLoad:
CSV
| Parameters | Dataset #1 | Dataset #2 | Dataset #3 | ||||||
| Total Params | Depth | Dimension | Total Params | Depth | Dimension | Total Params | Depth | Dimension | |
| ResNet50 | 23966777 | 177 | 2048 | 23890964 | 177 | 2048 | 23595908 | 177 | 2048 |
| DenseNet121 | 7227129 | 428 | 1024 | 7189204 | 428 | 1024 | 7041604 | 428 | 1024 |
| DFCR | 3781833 | 302 | 784 | 3752788 | 302 | 784 | 5919940 | 386 | 976 |
DownLoad:
CSV
As shown in Table 3 and 4, we can see that the DFCR have better recognition accuracy than the fine-tuning ResNet-50 and DenseNet-121. Especially on Dataset #1, the accuracy of the DFCR is 4.2% higher than DenseNet-121. Not only that, the total parameters and the feature dimensions of the ResNet-50 are several times than ours, which adds much difficulty to subsequent data processing. We cut the total number of parameters of DFCR to half of DenseNet-121's. Not only the dimension of the feature map is reduced, but the overall training time is reduced by several hours. It can be seen that it is not a mechanically deepening of the network to have an excellent classification effect. In practical applications, a neural network needs to be constructed for specific data.
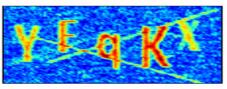
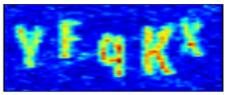
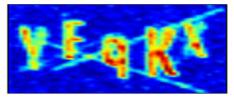
As shown in Table 5, we visualize the training process of CAPTCHA image "YEqKX." Specifically, we reconstruct the features of each layer of convolution and output a fixed feature. Even if the input of the same picture has a degree of transformation, the output can remain unchanged, which also indicates that the CNNs have strong robustness.
| Layers | DenseNet-121 | DFCR |
| conv1/relu | 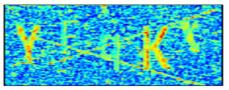 |
 |
| conv2_block4_1_relu | 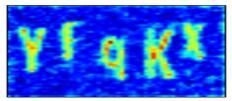 |
 |
| pool2_relu | 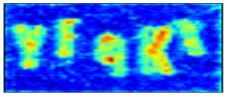 |
 |
DownLoad:
CSV
We visualize and superimpose the feature maps of the conv1/relu, conv2_block4_1_relu, and pool2_relu layers in each channel to obtain a visualization as shown in Table 5. Compared with the DenseNet-121, the DFCR we built has a stronger representation of the output characteristics in the same layer. In particular, in the output of the pool2_relu layer, it can be seen that the feature profile of the DFCR is more concrete than the DenseNet-121.
Although there are various kinds of CAPTCHAs, text-based CAPTCHA is applied most widely. On the one hand, it is because its a convenient and user-friendly way for website user; on the other hand, CAPTCHAs are a low-cost solution for websites. However, we know that the text CAPTCHAs are vulnerable and not as secure as expected. So we are willing to design text CAPTCHAs with higher security and better usability.
Defeating the CAPTCHAs is the most effective way to increase its own safety by finding the deficiency. The deep CNNs act as a more robust and useful method. All in all, using deep learning techniques to enhance the security of CAPTCHAs is a promising direction. In this paper, we constructed a deep CNN, which we referred to as DFCR. We compared its effectiveness with the ResNet-50 and the DenseNet-121. The experimental results showed that the DFCR not only kept compelling advantages but also encouraged feature reuse. On the one hand, memory consumption was greatly reduced. On the other hand, it had a better recognition performance than others. We used the end-to-end learning to directly identify the CAPTCHAs from the pixel image, which greatly avoided manual intervention, reduced the complexity of model training, and effectively prevented data over-fitting. It was different from traditional methods. What's more, we found that the recognition difficulty of these CAPTCHA images increases successively. So we can design CAPTCHA images by rotating multiple Chinese characters. The question of whether other CAPTCHA alternatives are robust and whether the designs of new CAPTCHAs can be secure are still open problems and are part of our ongoing work.
This work is supported by the National Natural Science Foundation of China (No.61772561), the Key Research & Development Plan of Hunan Province (No.2018NK2012), the Science Research Projects of Hunan Provincial Education Department (No.18A174, 18C0262), the Science & Technology Innovation Platform and Talent Plan of Hunan Province (No.2017TP1022).
All authors declare no conflicts of interest in this paper.
| [1] | S. Tian, W. Wang, J. Gong, Development and prospect of railway tunnels in China (including statistics of railway tunnels in China by the end of 2020), Tunn. Constr., 41 (2021), 308-325. |
| [2] |
F. Ye, N. Qin, X. Liang, A. Ouyang, Z. Qin, E. Su, Analyses of the defects in highway tunnels in china, Tunn. Undergr. Sp. Tech., 107 (2021), 103658. doi: 10.1016/j.tust.2020.103658

|
| [3] |
M. Hu, Y. Liu, V. Sugumaran, B. Liu, J. Du, Automated structural defects diagnosis in underground transportation tunnels using semantic technologies, Automat. Constr., 107 (2019), 102929-102929. doi: 10.1016/j.autcon.2019.102929
|
| [4] | W. Qian, T. Qi, X. Liang, S. Qin, Z. Li, Y. Li, Vehicle-borne transient electromagnetic numerical characteristic parameter of water-bearing body behind tunnel linings, Math. Probl. Eng., 26 (2020), 8514913. |
| [5] |
Z. Li, T. Qi, S. Qin, W. Qian, The research on minimizing the induction between the transmitting and receiving coils in close range transient electromagnetic inspection of groundwater-related defects in the operating tunnels, Math. Biosci. Eng., 18 (2021), 4508-4527. doi: 10.3934/mbe.2021229
|
| [6] |
X. Liang, T. Qi, Z. Jin, W. Qian, Hybrid support vector machine optimization model for inversion of tunnel transient electromagnetic method, Math. Biosci. Eng., 17 (2020), 3998-4017. doi: 10.3934/mbe.2020221
|
| [7] | Z. Liu, W. Huang, J. Huang, H. Wu, Y. Wang, D. Zhou, Interference of metal materials in tunnels on the detection results by transient electromagnetic method, Mod. Tunn. Tech., 53 (2016), 116-122. |
| [8] | H. Sun, X. Li, X. Lu, S. Li, B. Ren, Transient electromagnetic responses in tunnels with strong interferences and the correcting method, A TBM example, Chin. J. Geophys., 59 (2016), 4720-4732. |
| [9] |
N. Zhou, K. Lei, G. Xue, W. Chen, Induced polarization effect on grounded-wire transient electromagnetic data from transverse electric and magnetic fields, Geophysics, 85 (2020), E111-E120. doi: 10.1190/geo2019-0322.1
|
| [10] |
X. Wu, G. Xue, Y. He, J. Xue, Removal of multisource noise in airborne electromagnetic data based on deep learning, Geophysics, 85 (2020), B207-B222. doi: 10.1190/geo2019-0555.1
|
| [11] |
B. Blanco-Arrué, P. Yogeshwar, B. Tezkan, D. Díaz, Loop source transient electromagnetics in an urban noise environment: A case study in Santiago de Chile, Geophysics, 86 (2021), B135-B147. doi: 10.1190/geo2020-0322.1
|
| [12] |
A. Tamburrino, R. Fresa, S. S. Udpa, Y. Tian, Three-dimensional defect localization from time-of-flight/eddy current testing data, IEEE T. Magn., 40 (2004), 1148-1151. doi: 10.1109/TMAG.2004.824584
|
| [13] |
A. Sophina, G. Tian, M. Fan, Pulsed eddy current non-destructive testing and evaluation: A review, Chin. J. Mech. Eng., 30 (2017), 500-514. doi: 10.1007/s10033-017-0122-4
|
| [14] |
Y. Li, T. Qi, B. Lei, Z. Li, W. Qian, An iterative inversion method using transient electromagnetic data to predict water-filled caves during the excavation of a tunnel, Geophysics, 84 (2019), E89-E103. doi: 10.1190/geo2018-0253.1
|
| [15] |
Z. Guo, G. Xue, J. Liu, X. Wu, Electromagnetic methods for mineral exploration in China: A review, Ore Geol. Rev., 118 (2020), 103357. doi: 10.1016/j.oregeorev.2020.103357
|
| [16] |
Q. Di, G. Xue, C. Yin, X. Li, New methods of controlled-source electromagnetic detection in China, Sci. China Earth Sci., 63 (2020), 1268-1277. doi: 10.1007/s11430-019-9583-9
|
| [17] | W. Qian, Research on Vehicle-mounted Transient Electromagnetic Response Characterisation for Internal Defects of High-speed Railway Tunnel Structure, Ph.D thesis, Southwest Jiaotong University, 2020. |
| [18] |
Z. Shi, L. Liu, P. Xiao, Z. Geng, F. Liu, G. Fang, Simulation and analysis of the effect of ungrounded rectangular loop distributed parameters on TEM response, J. Appl. Geophys., 149 (2018), 105-113. doi: 10.1016/j.jappgeo.2017.12.018
|
| [19] | J. Zhou, J. Cheng, L. Wen, Response characteristics of metallic facilities and correction method on mine transient electromagnetic surveying, China Min. Mag., 26 (2017), 146-164. |
| 1. | Chunwei Pan, Guocai Zhang, Sheng Chen, Fangkun Zheng, Xue Liu, Liang Xin, Study on Detection of the Bearing Stratum Integrity of Bored Pile Based on Transient Electromagnetic Method, 2022, 2022, 1468-8123, 1, 10.1155/2022/2583113 | |
| 2. | Jinhua Xu, Shaohua Liu, Huaqiu Zhou, Rikai Zhang, Bo Wang, Yikang Xu, Wangping Qian, Investigation on Spatial Transformation and Proportional Coefficient of Vehicle-Mounted Transient Electromagnetic Detection Environments in Operational Tunnels, 2022, 12, 2076-3417, 9303, 10.3390/app12189303 | |
| 3. | Z. JiaWe, G. GuangDe, A geological interpretation method for non-uniform survey, 2022, 19, 1735-1472, 9047, 10.1007/s13762-021-03769-2 | |
| 4. | Chao Tan, Xingzuo Ou, Jiwei Tan, Xinyu Min, Qihao Sun, Segmental Regularized Constrained Inversion of Transient Electromagnetism Based on the Improved Sparrow Search Algorithm, 2024, 14, 2076-3417, 1360, 10.3390/app14041360 | |
| 5. | Lu Gan, Rongjiang Tang, Hao Li, Fusheng Li, Yunbo Rao, A deep learning-based parametric inversion for forecasting water-filled bodies position using electromagnetic method, 2025, 00983004, 105881, 10.1016/j.cageo.2025.105881 |
Figures(11) / Tables(1)

Wangping Qian, Yikang Xu, Zhenyuan Gu, Ziru Xiang, Zongyang Li, Jinchao Liu, Jiujiang Wu. Characterisation of transient electromagnetic signals during fixed interference sources in tunnel structure[J]. Mathematical Biosciences and Engineering, 2021, 18(5): 6907-6925. doi: 10.3934/mbe.2021343

| Layers | Output Size | Dataset #1 | Dataset #2 | Dataset #3 |
| Convolution | 112×112 | 7×7conv, stride2 | ||
| Pooling | 56×56 | 3×3max pool, stride2 | ||
| Dense Block (1) | 56×56 | (1×1conv3×3conv)×6 | ||
| Transition (1) | 56×56 | 1×1conv | ||
| 28×28 | 2×2average pool, stride2 | |||
| Dense Block (2) | 28×28 | (1×1conv3×3conv)×6 | ||
| Transition (2) | 28×28 | 1×1conv | ||
| 14×14 | 2×2average pool, stride2 | |||
| Dense Block (3) | 14×14 | (1×1conv3×3conv)×24 | ||
| Transition (3) | 14×14 | 1×1conv | ||
| 7×7 | 2×2average pool, stride2 | |||
| Dense Block (4) | 7×7 | (1×1conv3×3conv)×16 | ||
| 7×7global average pool | ||||
| Classification Layer | 1×1 | 5×1000Dfully-connected, softmax | 4×1000Dfully-connected, softmax | 1000Dfully-connected, softmax |
DownLoad:
CSV
| Type | Sample 1 | Sample 2 |
| Dataset #1 | |
|
| Dataset #2 | |
|
| Dataset #3 | |
|
DownLoad:
CSV
| Dataset #1 | Dataset #2 | Dataset #3 | ||||
| Validation set 2000 | Test set 5000 | Validation set 2000 | Test set 5000 | Validation set 2000 | Test set 5000 | |
| ResNet50 | 99.70% | 95.34% | 99.95% | 99.90% | 99.95% | 99.86% |
| DenseNet-121 | 99.80% | 95.40% | 99.95% | 99.90% | 100% | 99.92% |
| DFCR | 99.80% | 99.60% | 100% | 99.96% | 100% | 99.94% |
DownLoad:
CSV
| Parameters | Dataset #1 | Dataset #2 | Dataset #3 | ||||||
| Total Params | Depth | Dimension | Total Params | Depth | Dimension | Total Params | Depth | Dimension | |
| ResNet50 | 23966777 | 177 | 2048 | 23890964 | 177 | 2048 | 23595908 | 177 | 2048 |
| DenseNet121 | 7227129 | 428 | 1024 | 7189204 | 428 | 1024 | 7041604 | 428 | 1024 |
| DFCR | 3781833 | 302 | 784 | 3752788 | 302 | 784 | 5919940 | 386 | 976 |
DownLoad:
CSV
| Layers | DenseNet-121 | DFCR |
| conv1/relu | |
|
| conv2_block4_1_relu | |
|
| pool2_relu | |
|
DownLoad:
CSV
| Layers | Output Size | Dataset #1 | Dataset #2 | Dataset #3 |
| Convolution | 112×112 | 7×7conv, stride2 | ||
| Pooling | 56×56 | 3×3max pool, stride2 | ||
| Dense Block (1) | 56×56 | (1×1conv3×3conv)×6 | ||
| Transition (1) | 56×56 | 1×1conv | ||
| 28×28 | 2×2average pool, stride2 | |||
| Dense Block (2) | 28×28 | (1×1conv3×3conv)×6 | ||
| Transition (2) | 28×28 | 1×1conv | ||
| 14×14 | 2×2average pool, stride2 | |||
| Dense Block (3) | 14×14 | (1×1conv3×3conv)×24 | ||
| Transition (3) | 14×14 | 1×1conv | ||
| 7×7 | 2×2average pool, stride2 | |||
| Dense Block (4) | 7×7 | (1×1conv3×3conv)×16 | ||
| 7×7global average pool | ||||
| Classification Layer | 1×1 | 5×1000Dfully-connected, softmax | 4×1000Dfully-connected, softmax | 1000Dfully-connected, softmax |
| Type | Sample 1 | Sample 2 |
| Dataset #1 | |
|
| Dataset #2 | |
|
| Dataset #3 | |
|
| Dataset #1 | Dataset #2 | Dataset #3 | ||||
| Validation set 2000 | Test set 5000 | Validation set 2000 | Test set 5000 | Validation set 2000 | Test set 5000 | |
| ResNet50 | 99.70% | 95.34% | 99.95% | 99.90% | 99.95% | 99.86% |
| DenseNet-121 | 99.80% | 95.40% | 99.95% | 99.90% | 100% | 99.92% |
| DFCR | 99.80% | 99.60% | 100% | 99.96% | 100% | 99.94% |
| Parameters | Dataset #1 | Dataset #2 | Dataset #3 | ||||||
| Total Params | Depth | Dimension | Total Params | Depth | Dimension | Total Params | Depth | Dimension | |
| ResNet50 | 23966777 | 177 | 2048 | 23890964 | 177 | 2048 | 23595908 | 177 | 2048 |
| DenseNet121 | 7227129 | 428 | 1024 | 7189204 | 428 | 1024 | 7041604 | 428 | 1024 |
| DFCR | 3781833 | 302 | 784 | 3752788 | 302 | 784 | 5919940 | 386 | 976 |
| Layers | DenseNet-121 | DFCR |
| conv1/relu | |
|
| conv2_block4_1_relu | |
|
| pool2_relu | |
|
