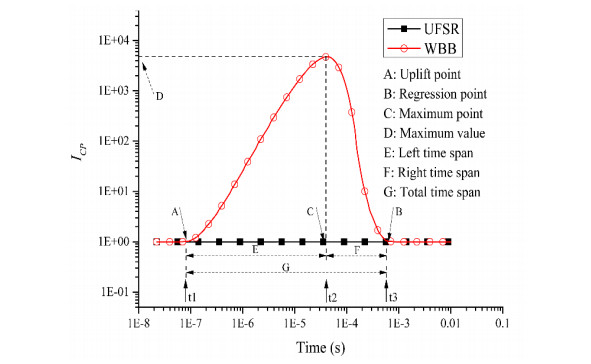
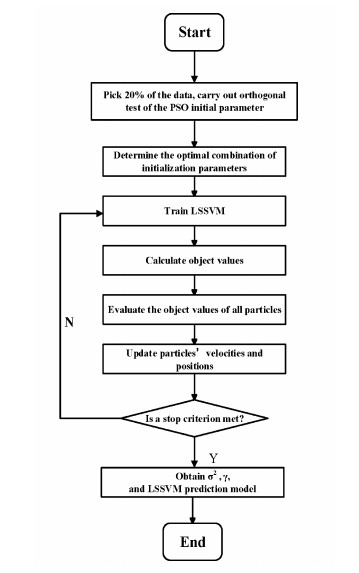
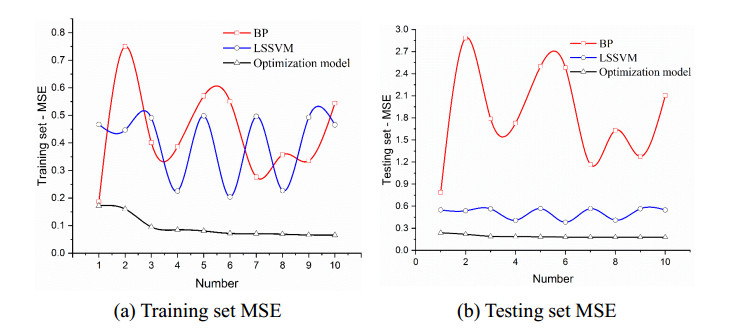
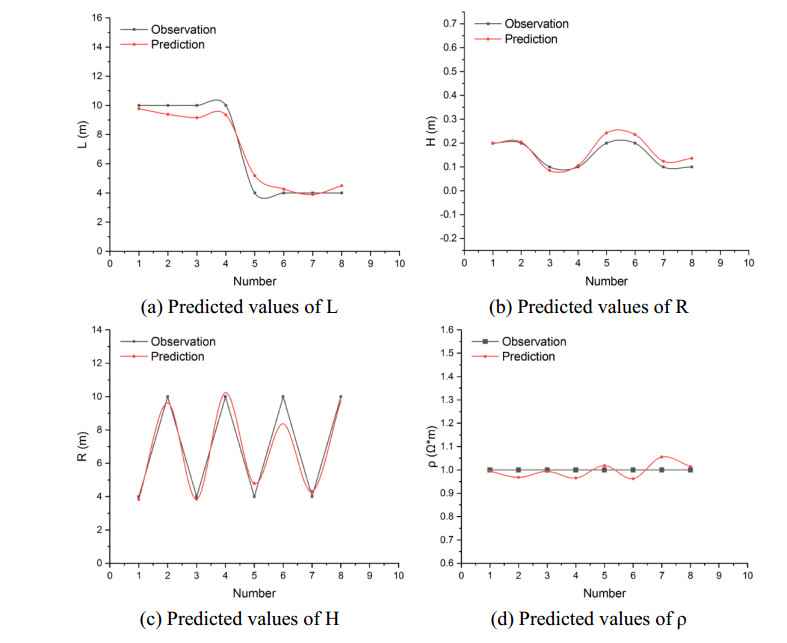
The transient electromagnetic method (TEM) can effectively predict adverse geological conditions, and is widely used in underground engineering fields such as coal mining and tunneling. Accurate evaluation of adverse geological features is a crucial problem that requires urgent solutions. TEM inversion is an essential tool in solving such problems. However, the three-dimensional full-space detection of tunnels and its inversion are not sufficiently developed. Therefore, combining a least-squares support vector machine (LSSVM) with particle swarm optimization (PSO), this paper proposes a tunnel TEM inversion approach. Firstly, the PSO algorithm is adopted to optimize the LSSVM model, thus overcoming the randomness and uncertainty of model parameter selection. An orthogonal test method is adopted to optimize the initial parameter combination of the PSO algorithm, which further improves the accuracy of our PSO-LSSVM model. Numerical simulations are conducted to generate 125 sets of original data. The optimized PSO-LSSVM model is then used to predict certain values of the original data. Finally, the optimization model is compared with conventional machine learning methods, and the results show that the randomness of the initial parameters of the PSO algorithm has been reduced and the optimization effect has been improved. The optimized PSO algorithm further improves the stability and accuracy of the generalization ability of the model. Through a comparison of different machine learning methods and laboratory model tests, it is verified that the optimized PSO-LSSVM model proposed in this paper is an effective technique for tunnel TEM detection inversion.
Citation: Xiao Liang, Taiyue Qi, Zhiyi Jin, Wangping Qian. Hybrid support vector machine optimization model for inversion of tunnel transient electromagnetic method[J]. Mathematical Biosciences and Engineering, 2020, 17(4): 3998-4017. doi: 10.3934/mbe.2020221
The transient electromagnetic method (TEM) can effectively predict adverse geological conditions, and is widely used in underground engineering fields such as coal mining and tunneling. Accurate evaluation of adverse geological features is a crucial problem that requires urgent solutions. TEM inversion is an essential tool in solving such problems. However, the three-dimensional full-space detection of tunnels and its inversion are not sufficiently developed. Therefore, combining a least-squares support vector machine (LSSVM) with particle swarm optimization (PSO), this paper proposes a tunnel TEM inversion approach. Firstly, the PSO algorithm is adopted to optimize the LSSVM model, thus overcoming the randomness and uncertainty of model parameter selection. An orthogonal test method is adopted to optimize the initial parameter combination of the PSO algorithm, which further improves the accuracy of our PSO-LSSVM model. Numerical simulations are conducted to generate 125 sets of original data. The optimized PSO-LSSVM model is then used to predict certain values of the original data. Finally, the optimization model is compared with conventional machine learning methods, and the results show that the randomness of the initial parameters of the PSO algorithm has been reduced and the optimization effect has been improved. The optimized PSO algorithm further improves the stability and accuracy of the generalization ability of the model. Through a comparison of different machine learning methods and laboratory model tests, it is verified that the optimized PSO-LSSVM model proposed in this paper is an effective technique for tunnel TEM detection inversion.

| [1] |
E. D. Jens, A. Esben, J. Flemming, The application of the transient electromagnetic method in hydrogeophysical surveys, J. Appl. Geophys., 53 (2003), 181-198. doi: 10.1016/j.jappgeo.2003.08.004

|
| [2] |
A. Kanta, P. Soupios, P. Barsukov, M. Kouli, Aquifer characterization using shallow geophysics in the Keritis Basin of Western Crete, Greece, Environ. Earth Sci., 70 (2013), 2153-2165. doi: 10.1007/s12665-013-2503-z
|
| [3] | D. Kalisperi, M. Kouli, F. Vallianatos, A transient electromagnetic (TEM) method survey in north-central coast of Crete, Greece: Evidence of seawater intrusion, Geosciences, 8 (2018), 2076-3263. |
| [4] |
F. Vallianatos, M. Kouli, D. Kalisperi, Evidence of hierarchy in the complex fractured system of geropotamos (Crete, Greece), as extracted from transient electromagnetic responses, Pure Appl. Geophys., 175 (2018), 2895-2904. doi: 10.1007/s00024-018-1835-8
|
| [5] |
D. A. Pavlov, M. S. Zhdanov, Analysis and interpretation of anomalous conductivity and magnetic permeability effects in time domain electromagnetic data, J. Appl. Geophys., 46 (2001), 217-233. doi: 10.1016/S0926-9851(01)00040-4
|
| [6] |
M. Y. Cheng, Y. W. Wu, L. Chen, Risk preference-based support vector machine inference model for slope collapse prediction, Autom. Constr., 22 (2012), 175-181. doi: 10.1016/j.autcon.2011.06.015
|
| [7] |
C. Zhou, L. Y. Ding, Y. Zhou, Hybrid support vector machine optimization model for prediction of energy consumption of cutter head drives in shield tunneling, J. Comput. Civ. Eng., 33 (2019), 04019019. doi: 10.1061/(ASCE)CP.1943-5487.0000833
|
| [8] | H. F. Sun, X. Li, X. S. Lu, Transient electromagnetic responses in tunnels with strong interferences and the correcting method: A TBM example, Chin. J. Geophys., 59 (2016), 4720-4732. |
| [9] | G. Q. Xue, Y. J. Yan, X. Li, Q. Y. Di, Transient electromagnetic S-inversion in tunnel prediction, Geophys. Res. Lett., 34 (2007). |
| [10] | D. M. Tan, Research on Theory and Application for Advanced Prediction of Water by Whole Space Transient Electromagnetism, Master thesis, Southwest Jiaotong University, 2009. |
| [11] | W. P. Qian, T. Y. Qi, X. Liang, S. J. Qin, Z. Y. Li, Y. Li, Vehicle-borne transient electromagnetic numerical characteristic parameter of water-bearing body behind tunnel linings, Math. Probl. Eng., 2020 (2020), 8514913. |
| [12] |
S. E. Cho, Probabilistic stability analyses of slopes using the ANN-based response surface, Comput. Geotech., 36 (2009), 787-797. doi: 10.1016/j.compgeo.2009.01.003
|
| [13] | X. H. Xue, Prediction of slope stability based on hybrid PSO and LSSVM, J. Comput. Civ. Eng., 33 (2019), 04016041. |
| [14] |
J. Rostami, Performance prediction of hard rock tunnel boring machines (TBMs) in difficult ground, Tunn. Undergr. Space Technol., 57 (2016), 173-182. doi: 10.1016/j.tust.2016.01.009
|
| [15] | L. M. Zhang, X. G. Wu, H. P. Zhu, Performing global uncertainty and sensitivity analysis from given data in tunnel construction, J. Comput. Civ. Eng., 31 (2017), 040170. |
| [16] |
J. A. K. Suykens, J. Vandewalle, Least squares support vector machine classifiers, Neural Process. Lett., 9 (1999), 293-300. doi: 10.1023/A:1018628609742
|
| [17] | Y. Yamagami, J. C. Jiang, A search for the critical slip surface in three-dimensional slope stability analysis, Soils Found., 37 (1997), 1-16. |
| [18] | J. Kennedy, R. Eberhart, Particle swarm optimization, in ICNN'95-International Conference on Neural Networks, IEEE, 1995. |
| [19] | Y. H. Shi, R. Eberhart, A modified particle swarm optimizer, in 1998 IEEE International Conference on Evolutionary Computation Proceedings. IEEE World Congress on Computational Intelligence, IEEE, 1998. |
| [20] | R. Y. Ma, L. L. Yang, Z. C. Zhang, Analysis the characteristic of C1, C2 based on the PSO of iterative shift and trajectory of particle, Math. Comput., 4 (2013), 109-115. |
| [21] |
C. Elegbede, Structural reliability assessment based on particle swarm optimization, Struct. Saf., 27 (2005), 171-186. doi: 10.1016/j.strusafe.2004.10.003
|
| [22] |
M. Y. Cheng, N. D. Hoang, Risk score inference for bridge maintenance project using evolutionary fuzzy least squares support vector machine, J. Comput. Civ. Eng., 28 (2014), 04014003. doi: 10.1061/(ASCE)CP.1943-5487.0000275
|
| [23] |
T. Lee, L. Thomas, The transient electromagnetic response of a polarizable sphere in a conducting half space, Geophys. Prospect., 40 (1992), 541-563. doi: 10.1111/j.1365-2478.1992.tb00540.x
|
| [24] |
H. M. Lin, S. K. Chang, J. H. Wu, C. H. Juang, Neural network-based model for assessing failure potential of highways lopes in the Alishan, Taiwan area: Pre-and post-earthquake investigation, Eng. Geol., 104 (2009), 280-289. doi: 10.1016/j.enggeo.2008.11.007
|
| [25] |
M. N. Nabighian, Quasi-static transient response of a conducting half-space-An approximate representation, Geophysics, 44 (1979), 1700-1705. doi: 10.1190/1.1440931
|
Figures(11) / Tables(4)

Xiao Liang, Taiyue Qi, Zhiyi Jin, Wangping Qian. Hybrid support vector machine optimization model for inversion of tunnel transient electromagnetic method[J]. Mathematical Biosciences and Engineering, 2020, 17(4): 3998-4017. doi: 10.3934/mbe.2020221


 DownLoad: