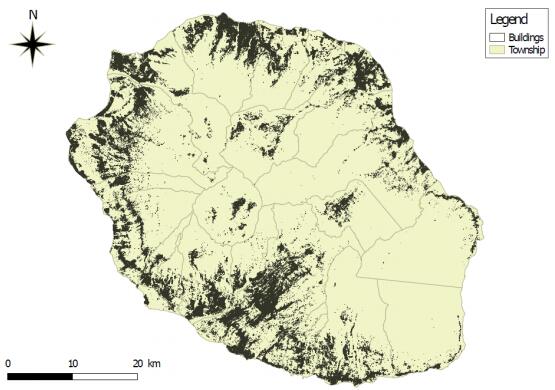
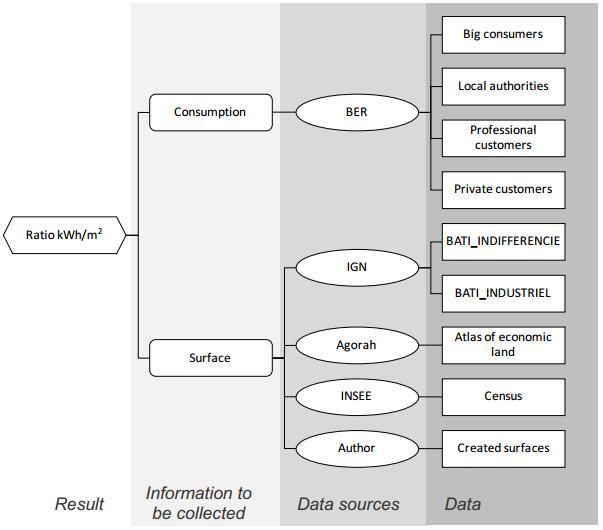
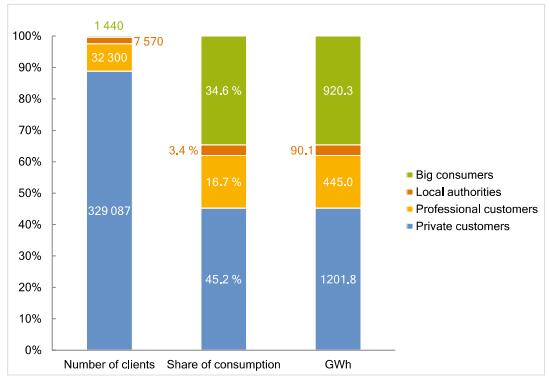
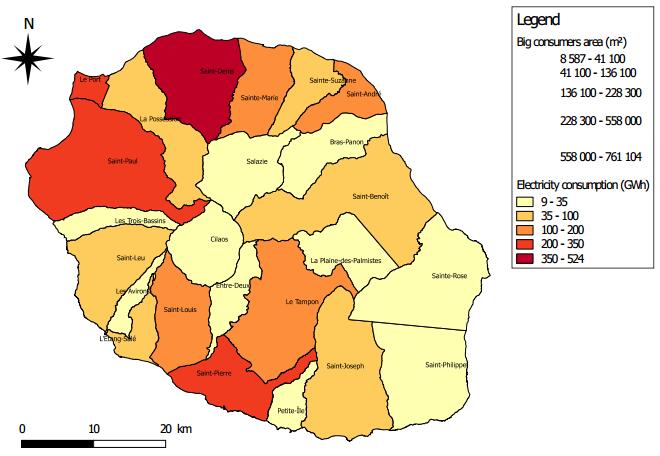
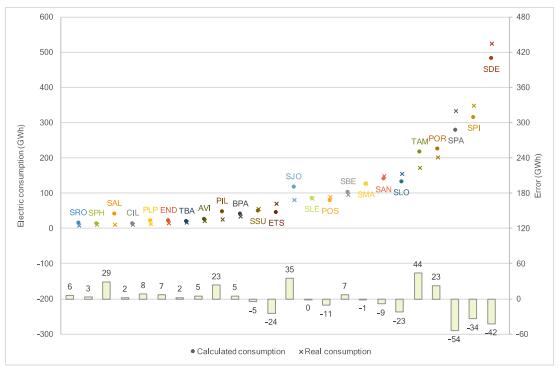
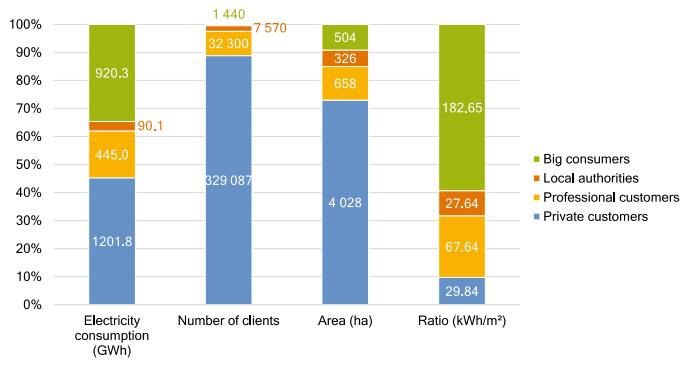
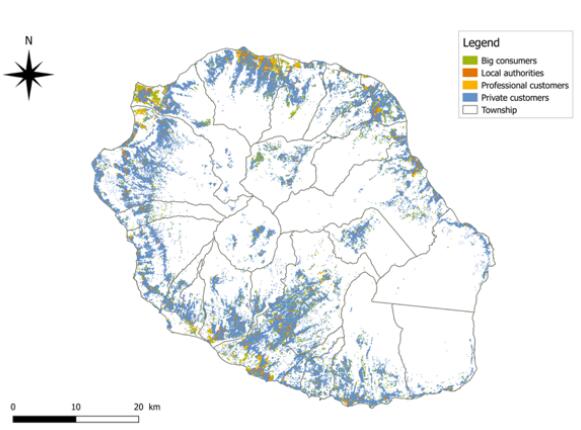
Succeeding energy transition is the current challenging objective of many remote islands such as Reunion Island to reduce their dependency to fossil resources. To define an efficient energy framework strategy for the territory, it is important to be able to assess the electricity consumption intensity per typology of consumers. A particular attention must be paid on building electricity consumption in energy planning scenarios. This paper proposes to investigate the electricity consumption ratio per square meter per building type which appears as a relevant indicator. The proposed methodology aims at filling the lack of data (ratio kWh/m2/ type of consumers) when this information doesn’t exist for a territory. This type of ratio can be useful in two ways: on the one hand to characterize the building energy demand, and, on the other hand, to understand the consumption mode of the inhabitants. We can therefore provide future energy policy framework in favor of demand-side management what is a key step, a lock to solve for the deployment of sustainable cities. This work calculates electricity consumption ratios per area by using a GIS (Geographic Information System) method, distinguishing the type of building. The case of Reunion Island is studied and four building categories are identified corresponding to the functional characteristics such as industry, administration, companies and residential. The results highlight that residential sector has one of the lowest electricity ratios with a value of 29.84 kWh/m2, but also the highest part of electricity consumption, 45.2%. The different ratio value has been cross validated by estimating municipalities electricity consumption based on the distribution of consumers and the associated ratio.
1.
Introduction
Tuberculosis (TB) is caused by Mycobacterium tuberculosis, one of the oldest infectious diseases that affects humans [1]. The prevalence of tuberculosis in Iran due to BCG vaccination, the electronic reporting system and access to free treatment is decreasing [2]. However, the incidence of multi drug resistant (MDR) tuberculosis is rising among new cases of tuberculosis [3]. Anthracosis is a black-blue color change in the bronchial mucosa, which may lead to anthracofibrosis due to stenosis and bronchial destruction. Exposure to the smoke from the biomass fuels is the most common risk factor in anthracosis-anthracofibrosis patients [4]–[7]. The exposure to wood smoke and dust is also a risk factor for anthracosis [4]. Bronchial anthracofibrosis is increasing in industrialized countries [8]. Women are significantly more likely susceptible to anthracosis than men [6],[7]. The most common complaints of these patients are dyspnea and coughing [4]–[6],[9]. The diagnosis of this disease is by bronchoscopy and there is no alternative noninvasive method for diagnosis [4],[8].
According to the studies, the most commonly involved regions are the upper lobes of the right and left lungs and the middle lobe of the right lungs [6],[7]. In CT scan imaging of a number of patients, consolidation and reticular pattern, and in some cases multifocal stenosis in lung's HRCT have seen which is characteristic for bronchial anthracofibrosis, and in some cases, lymphadenopathy, or bronchial calcification, or mass can be seen [4],[6],[10]. In some cases, anthracosis has been reported with active pulmonary TB, and in some other studies bronchial anthracofibrosis has been mentioned as a potential risk factor for endobronchial tuberculosis. Bronchial anthracosis is one of the major symptoms of pulmonary tuberculosis; hence, in patients with anthracosis and pulmonary and general symptoms, pulmonary tuberculosis should be considered, which would be a good guide to treatment and follow up of patients [10],[11]. Identifying anthracosis patients with active pulmonary tuberculosis can reduce the adverse outcomes of the disease and the mortality rate of patients [12]. It is recommended that patients who are diagnosed for pulmonary tuberculosis and get treated because of it, should be evaluated for anthracofibrosis if they have a history of exposure to smoke from Biomass fuel [7]. The prevalence of tuberculosis is different among anthracosis patients in different provinces of Iran. This rate is 44% in Zahedan, 25–30% in Mashhad, and 6.9% in Kerman. However, there are no reports of tuberculosis among anthracosis patients in Tabriz and Sanandaj [13].
Since no study with this title has been done in Kurdistan province and there is no comprehensive and accurate information on the association between tuberculosis and anthracosis in this province and also, due to the fact that the contact of some patients with biomass-induced smoke in the rural areas of the province is high, the aim of this study was to evaluate the prevalence of pulmonary tuberculosis in patients with anthracosis compared with patients without anthracosis.
2.
Materials and methods
2.1. Studied samples
In this historical cohort study, anthracosis was considered as the exposure and the consequence was tuberculosis. The statistical population was all patients with radiological evidence of tuberculosis referring to the pulmonology clinic of Tohid Hospital in Sanandaj from October 2017 to December 2018.
2.2. Inclusion and exclusion criteria
Inclusion criteria included patients who had evidence of pulmonary tuberculosis in their imaging methods, and the presence of tumors and pneumonia in patients and also smoking were considered as exclusion criteria.
2.3. Gathering data
All patients who had the inclusion criteria were selected by census method. After describing all stages of the study for patients and obtaining written consent from them, if they had radiological evidence of pulmonary tuberculosis that diagnosed by a pulmonologist, they were subjected to bronchoscopy for diagnosis of anthracosis. 40 persons were selected for the exposed group (anthracosis group) and 138 individuals were identified as non-exposed (non-affected) group. After determining the two groups, the final diagnosis for active tuberculosis was done based on the results of PCR and preparation of smear and culture from bronchoalveolar lavage. To perform bronchoalveolar lavage, after selecting the intended site during bronchoscopy, 40 to 60 ml of normal saline was injected slowly into the site and collected by suction and transferred to special syringes. The obtained results and patient's information were recorded in a questionnaire designed in this regard.
2.4. Statistical analysis
To analyze the data for descriptive variables, descriptive statistics formulas (the mean, standard deviation and frequency) and for analyzing the analytical variables, Chi-square test, as well as logistic regression using SPSS V.22 statistical software were used.
3.
Results
In this study, the patients' age average was 62.90 ± 15.29 years. Also, 95 patients (53.4%) were men. The rate of active TB in women and men was 19.3% and 2.1%, respectively and anthracosis was 28.9% and 16.8% respectively which in both cases were significantly different and were higher in women (P < 0.001 and p = 0.05, respectively). Of the total patients with anthracosis (40 cases), 9 (22.5%) had active TB. Table 1 presents some of the features and symptoms of the disease in the studied patients. The rate of lesion in right middle lobe (RML), right upper lobe (RUL), left upper lobe (LUL), left lower lobe(LLL), right lowr lobe (RLL) in patients with anthracosis was more than in patients with active TB, so that RUL lesion in patients with anthracosis was 80% and was 44.4% in tuberculosis patients (Table 2). The study of the relationship between exposure to smoke and smoking with anthracosis showed that smoke exposure was effective in anthracosis presence (P < 0.01) but smoking had not an effective role (P > 0.05). Exposure to smoke was effective with a odds ratio (OR) of 6.85 in the incidence of anthracosis (Table 3). The results of the evaluation of the relationship between anthracosis, smoking and exposure to smoke with TB are presented in Table 4 and show that anthracosis and exposure to smoke are related to tuberculosis (P < 0.01). The OR of exposure to smoke was 8.06 and was 4.16 in anthracosis. But in this study smoking was not associated with tuberculosis. The results of logistic regression analysis on the factors affecting tuberculosis showed that smoke exposure and anthracosis have a significant relationship with tuberculosis, but age and smoking are not significantly related to tuberculosis. Exposure to smoke and anthracosis, respectively, with a OR of 5.78 and 1.74, can be considered as predictor variables, respectively (Table 5).
4.
Discussion
The results of this study showed that the mean age of the patients was 62.90 ± 15.29 years. Also, 95 (53.4%) were male, and the incidence of tuberculosis and anthracosis was higher in women than in men. These findings were largely consonant with other studies, as confirmed by Kunal et al. [8], Rezaeetalab et al. [9], Kahkouee et al. [14] and Fekri et al. [15]. The occurrence of anthracosis in women is likely to be due to the exposure of the smoke from biomass fuels, especially in the villages. Another finding of our study was that 92.7% of patients had cough and 90.4% had dyspnea. These results were largely in line with the findings of other studies, which in the studies of Kunal et al. [8], Kahkouee et al. [14], Ghanei et al. [16] and Uçar et al. [7], the percentage of cough and dyspnea was 80% to 95%, which is predictable due to bronchial problems and obstruction in these patients. On the other hand, 27.5% of patients had cigarette smoking habit but there was no relationship between smoking with tuberculosis and anthracosis. A number of studies have also confirmed this findings [6],[17],[18]. A reason for this result is the recommendation of physicians to not use of cigarettes by patients.
Other results showed that the rate of lesion in different regions of the lung (RML, RUL, LUL) was higher in patients with anthracosis than in patients with active TB which the lesion in RML in patients with anthracosis was 60% and in patients with Tb was 38.9 % and in case of RUL was 80% in anthracosis and 44.4% in TB, and the total amount of lesions in the right lung lobes was greater than the left lung. These results were supported by other studies [14],[19]. In another study, the most common finding was anthracotic pigmentation and distortion of involved bronchus in LUL [8]. Other results of our study showed that 22.5% of patients had anthracosis and 10.1% of active TB. In other studies, some of the results were similar to those of the present study, including in the study of Rezaei-Talab [2], 26.5% Enterococci, in the study of Fekri et al. [15], the prevalence of anthracosis was 20.8%, but in the Ghanei et al. study [16], the prevalence of anthracosis was 10.5%, which was lower than our study. Differences in the results may be due to the clinical status of the patients and the rate of sensitivity in the selection of the patients.
Our findings suggest that anthracosis and exposure to smoke are related to tuberculosis. The OR of TB in the exposure to smoke was 8.06 and in anthracosis cases was 4.16. Also, exposure to smoke was significantly higher in patients with anthracosis and increased the risk of anthracosis 6.5 times. In this regard, many studies have been carried out which most of them confirming the association between anthracosis and TB. For example, in the study of Rezaei-Talab et al. [9] and Fekri et al. [15], the association between anthracosis and tuberculosis with a risk of 2.6 was confirmed. Also, in the study of Ghanei et al. [16], the association of anthracosis and pulmonary tuberculosis was significantly confirmed. On the other hand, in our study the role of smoke on the occurrence of anthracosis and tuberculosis was confirmed by logistic regression analysis with a OR of 7.84, and considered as a predictor variable. Previous studies have also shown that smoke from biomass fuel is associated with an increased risk of chronic lung disease [10]. However, there are limited data on anthracosis in developed countries [18],[20]. In other studies, the findings showed that most patients with anthracosis were non-smoker old women who lived in rural areas and had no work-related anthracosis history [21],[22]. However, some studies have not found significant correlation between anthracosis and tuberculosis [6]. There are also evidences that tuberculosis is high in some areas, but anthracosis is limited [13]. The confirmation of the association between tuberculosis with anthracosis is still under discussion, as Kim et al. [18] confirmed the association between these two diseases after evaluation of the radiographic images of some patients with anthracosis which some of them had a history of tuberculosis. Their theory was based on three characteristics: 1) the presence of active or previous TB with anthracosis, 2) the formation of dark anthracotic pigmentation during tuberculosis treatment, and 3) similar imaging findings in tuberculosis and anthraco-fibrosis. But unlike Kim, the causal role of tuberculosis in the development of anthracosis and its trial therapy in anthracotic patients was questioned by Park et al. [23], and provided scientific reasons for rejection of the above theory. These results necessitate further studies in this regard. Access to samples was one of the limitation in this study.
5.
Conclusion
Based on the results of this study, the presence of anthracosis and exposure to smoke of burning biomass can increase the risk of tuberculosis and accompany it. Therefore, it is recommended that patients with anthracosis and those who have long-term exposure to smoke should be evaluated for active tuberculosis to reduce their morbidity and mortality through early diagnosis and provide more effective treatment.


 DownLoad: