Loading [MathJax]/jax/output/SVG/jax.js

Reimagining multiplication as diagrammatic and dynamic concepts via cutting, pasting and rescaling actions

  • Recently, Tisdell [48] developed some alternative pedagogical perspectives of multiplication strategies via cut-and-paste actions, underpinned via the principle of conservation of area. However, the ideas therein were limited to problems involving two factors that were close together, and so would not directly apply to a problem such as 17 × 93. The purpose of the present work is to establish what diagrammatic and dynamic perspectives could look like for these more complex classes of multiplication problems. My approach to explore this gap is through an analysis and discussion of case studies. I probe several multiplication problems in depth, and drill down to get at their complexity. Through this process, new techniques emerge that involve cut-and-paste and rescaling actions to enable a reimagination of the problem from diagrammatic and dynamic points of view. Furthermore, I provide some suggestions regarding how these ideas might be supplemented in the classroom through the employment of history that includes Leonardo Da Vinci's use of conservation principles in his famous notebooks. I thus establish a pedagogical framework that has the potential to support the learning and teaching of these extended problems from diagrammatic and dynamic perspectives. groups.

    Citation: Christopher C. Tisdell. Reimagining multiplication as diagrammatic and dynamic concepts via cutting, pasting and rescaling actions[J]. STEM Education, 2021, 1(3): 170-185. doi: 10.3934/steme.2021013
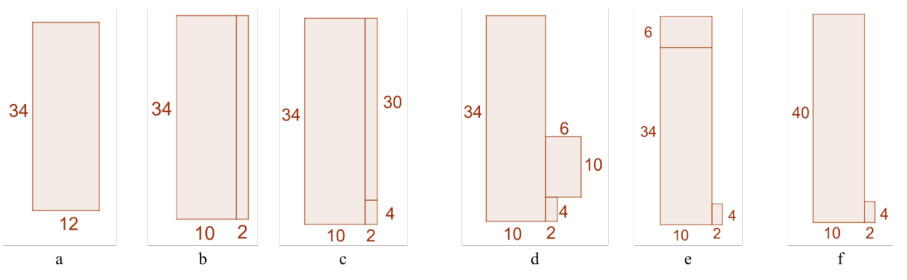
    Related Papers:

    [1] Xue Hu, Haiping Ren . Statistical inference of the stress-strength reliability for inverse Weibull distribution under an adaptive progressive type-Ⅱ censored sample. AIMS Mathematics, 2023, 8(12): 28465-28487. doi: 10.3934/math.20231457
    [2] Mohamed S. Eliwa, Essam A. Ahmed . Reliability analysis of constant partially accelerated life tests under progressive first failure type-II censored data from Lomax model: EM and MCMC algorithms. AIMS Mathematics, 2023, 8(1): 29-60. doi: 10.3934/math.2023002
    [3] Refah Alotaibi, Mazen Nassar, Zareen A. Khan, Ahmed Elshahhat . Statistical analysis of stress–strength in a newly inverted Chen model from adaptive progressive type-Ⅱ censoring and modelling on light-emitting diodes and pump motors. AIMS Mathematics, 2024, 9(12): 34311-34355. doi: 10.3934/math.20241635
    [4] Hanan Haj Ahmad, Ehab M. Almetwally, Dina A. Ramadan . A comparative inference on reliability estimation for a multi-component stress-strength model under power Lomax distribution with applications. AIMS Mathematics, 2022, 7(10): 18050-18079. doi: 10.3934/math.2022994
    [5] Hanan Haj Ahmad, Osama E. Abo-Kasem, Ahmed Rabaiah, Ahmed Elshahhat . Survival analysis of newly extended Weibull data via adaptive progressive Type-Ⅱ censoring and its modeling to Carbon fiber and electromigration. AIMS Mathematics, 2025, 10(4): 10228-10262. doi: 10.3934/math.2025466
    [6] A. M. Abd El-Raheem, Ehab M. Almetwally, M. S. Mohamed, E. H. Hafez . Accelerated life tests for modified Kies exponential lifetime distribution: binomial removal, transformers turn insulation application and numerical results. AIMS Mathematics, 2021, 6(5): 5222-5255. doi: 10.3934/math.2021310
    [7] Refah Alotaibi, Mazen Nassar, Zareen A. Khan, Ahmed Elshahhat . Analysis of Weibull progressively first-failure censored data with beta-binomial removals. AIMS Mathematics, 2024, 9(9): 24109-24142. doi: 10.3934/math.20241172
    [8] Ahmed R. El-Saeed, Ahmed T. Ramadan, Najwan Alsadat, Hanan Alohali, Ahlam H. Tolba . Analysis of progressive Type-Ⅱ censoring schemes for generalized power unit half-logistic geometric distribution. AIMS Mathematics, 2023, 8(12): 30846-30874. doi: 10.3934/math.20231577
    [9] Hassan Okasha, Mazen Nassar, Saeed A. Dobbah . E-Bayesian estimation of Burr Type XII model based on adaptive Type-Ⅱ progressive hybrid censored data. AIMS Mathematics, 2021, 6(4): 4173-4196. doi: 10.3934/math.2021247
    [10] Nora Nader, Dina A. Ramadan, Hanan Haj Ahmad, M. A. El-Damcese, B. S. El-Desouky . Optimizing analgesic pain relief time analysis through Bayesian and non-Bayesian approaches to new right truncated Fréchet-inverted Weibull distribution. AIMS Mathematics, 2023, 8(12): 31217-31245. doi: 10.3934/math.20231598
  • Recently, Tisdell [48] developed some alternative pedagogical perspectives of multiplication strategies via cut-and-paste actions, underpinned via the principle of conservation of area. However, the ideas therein were limited to problems involving two factors that were close together, and so would not directly apply to a problem such as 17 × 93. The purpose of the present work is to establish what diagrammatic and dynamic perspectives could look like for these more complex classes of multiplication problems. My approach to explore this gap is through an analysis and discussion of case studies. I probe several multiplication problems in depth, and drill down to get at their complexity. Through this process, new techniques emerge that involve cut-and-paste and rescaling actions to enable a reimagination of the problem from diagrammatic and dynamic points of view. Furthermore, I provide some suggestions regarding how these ideas might be supplemented in the classroom through the employment of history that includes Leonardo Da Vinci's use of conservation principles in his famous notebooks. I thus establish a pedagogical framework that has the potential to support the learning and teaching of these extended problems from diagrammatic and dynamic perspectives. groups.


    Abbreviations.
    Abbreviations Full name
    ALTs Accelerated life tests
    CSALTs Constant-stress accelerated life tests
    PT2C Progressive Type-Ⅱ censoring
    APT2C Adaptive progressive Type-Ⅱ censoring
    IAPT2C Improved adaptive progressive Type-Ⅱ censoring
    MPS Maximum product of spacings
    RF Reliability function
    MCMC Markov chain Monte Carlo
    ACIs Approximate confidence intervals
    BCIs Bayes credible intervals
    PDF Probability density function
    CDF Cumulative distribution function
    LF Likelihood function
    MLEs Maximum likelihood estimates
    AV-CM Asymptotic variance-covariance matrix
    MPSEs Maximum product of spacings estimates
    PS Product of spacings
    SELF Squared error loss function
    M-H Metropolis–Hastings
    AvEs Average estimates
    RMSEs Root mean squared-errors
    MRABs Mean average absolute biases
    MRABs Mean relative absolute biases
    ACLs Average confidence lengths
    CPs Coverage probabilities
    BGR Brooks–Gelman–Rubin
    OLED Organic light-emitting diode
    SEs Standard–errors
    LR Likelihood ratio
    KS Kolmogorov-Smirnov

    Quick advancements in technology, drastic global competition, and growing client expectations have all put massive pressure on manufacturers to deliver high-quality products. Clients anticipate high-reliability products. Enhancing reliability is a significant part of the overall vision of improving product quality. For modern products, there is a longer lifespan with higher reliability, which means it is not beneficial to test products under normal-use circumstances, where the evaluation procedure may be overly long and excessive. In this case, accelerated life tests (ALTs) have been presented to gather failure information quickly within a reasonable testing time frame. In ALTs, items are subjected to higher-than-normal amounts of stress (for example, temperature or pressure) to lead to a quicker failure. The data acquired from such ALTs is then examined to determine the life characteristics under typical circumstances of operation. Employing the constant-stress ALTs (CSALTs), the test objects are under continual severe stress until failure occurs or the test is finished. The mechanism of CSALTs is explained in detail in the next section. It is vital to highlight that there are other types of ALTs, such as step-stress ALTs. Many authors have considered ALTs in their studies; see, for example, Balakrishnan and Han[1], Nelson[2], Kateri and Kamps[3], Mohie El-Din et al.[4], Wang[5], Nassr and Elharoun [6], Nassar et al. [7,8], Dey and Nassar[9], Feng et al.[10], Balakrishnan et al.[11], Alotaibi et al.[12], Kumar et al. [13], Manal et al. [14], and Wu et al. [15].

    In life testing and reliability analysis, collecting data from all tested units is unrealistic because of its high cost and duration. Accordingly, the use of censoring schemes is naturally utilized in reliability and lifetime investigations, where the experiment will end when a portion of the units fail. Type-Ⅰ and Type-Ⅱ censoring strategies are the most commonly utilized plans in publications. Nevertheless, these plans do not permit the experimenters to discard items from the experimentation at any moment until the investigation is completed. To overpower this disadvantage, a progressive Type-Ⅱ censoring (PT2C) procedure is suggested, in which the experimenters can remove live units in various testing phases. The lifespan of items is increasing due to technological advancements, and even when the PT2C scheme is used, this results in increased test time frames. In certain cases, no failure occurs within the test period. Therefore, Kundu and Joarder[16] suggested the progressive Type-Ⅰ hybrid censoring strategy, which is a combination of PT2C and hybrid censoring plans. The major weakness of this plan is that the number of failures is arbitrary and occasionally low or zero, which delivers outcomes of statistical deduction that may be inappropriate or inadequate. To improve this shortage, Ng et al. [17] introduced an adaptive PT2C (APT2C) plan that adapts the test procedure according to the trial improvement to achieve the desired pre-fixed number of failures. Because of the advantages of this scheme, numerous researchers have explored the estimation problems of some lifetime models in the presence of APT2C data, see, for example, Ismail[18], AL Sobhi[19], Nassar and Abo-Kasem[20], Nassar et al[21], Elshahhat and Nassar[22], Abu El Azm et al[23], and Nassr et al[24], among others. Nevertheless, as indicated by Ng et al. [17], the APT2C is efficient in parameter evaluation when the full period of the trial is not a significant matter. On the other hand, if the products being studied are exceptionally reliable, the assessment process may require a lengthy period, and the APT2C plan cannot ensure that the total test duration is suitable. To overcome this limitation, Yan et al. [25] proposed an improved-APT2C (IAPT2C). It guarantees that the assessment ends in the allotted amount of time. It can also be viewed as a generalization of many plans. Therefore, if the investigator aims to finish the test within a designated time frame, the IAPT2C may be applied. The description of the IAPT2C plan is presented in the next section. Recently, some studies considered this scheme; see for example Elbatal [26] and Dutta and Kayal [27].

    In this study, we utilize the IAPT2C under the CSALTs when the tested failure times follow the Weibull model. This work's motivation comes from: (1) The popularity and flexibility of the Weibull distribution in modeling various data types; (2) the effectiveness of combining CSALTs with the IAPT2C plan in cutting the test time and estimating the product's performance under regular usage circumstances; (3) it is the first time that the product of spacings (PS) function has been used in the case of the IAPT2C with CSALTs, so we are interested to see how it performs when compared with other classical and Bayesian methods; (4) the reliability function (RF) estimation under normal use situations was researched in a few studies, despite many examining the estimation issues in the presence of CSALTs. To put it another way, the vast majority of the studies have only focused on the estimation issues of unknown parameters and have said nothing about the estimation of the RF under normal operational settings. We believe it is important for reliability engineers and other practitioners to identify the RF for the Weibull distribution under normal operating conditions. For more detail about the importance of the reliability estimation, see Xu et al. [28] and Wang et al. [29]. To achieve our objectives, the unknown parameters are estimated using two classical approaches, namely maximum likelihood and maximum product of spacings (MPS) methods. Moreover, the Bayesian method via the Markov chain Monte Carlo (MCMC) sampling technique is considered to get different estimates when the observed data are evaluated using the two classical approaches. Based on the different estimation methods, the scale and reliability parameters are estimated at the designed stress level. In addition, the approximate confidence intervals (ACIs) and the Bayes credible intervals (BCIs) are acquired. As far as we are aware, this is the first time that the various estimation approaches to the Weibull distribution under the IAPT2C with CSALTs have been studied. Another important motivation for this paper is to compare the maximum likelihood estimators (MLEs) with the MPS estimators (MPSEs), as well as the corresponding Bayesian ones. To assess our findings, an extensive simulation study is implemented. It is very interesting for statisticians and applied researchers to see the applicability of the different methods offered in real-life cases. Consequently, two groups of real-world data are explored to demonstrate how the suggested methodologies may be applied in reality.

    This study is arranged as follows: In Section 2, we provide the model and basic assumptions. In Section 3, the point and interval estimates of the unknown subjects are obtained using the maximum likelihood method. The various estimates using the MPS method are provided in Section 4. The Bayes' method is utilized in Section 5. In Section 6, the various estimation methods are compared via a simulation study. Two real CSALT data sets are analyzed in Section 7. Section 8 ends the study.

    In this work, we make the assumption that the lifespan of products follows the Weibull distribution. It is favoured because it is a logical generalization of the exponential distribution and hence recreates a critical role in many applications in different fields, including analyzing engineering, biological, and medical data sets. Here, we consider the Weibull CSALTs model with the next two assumptions:

    (1) The unit lifetime associated with each stress level si,i=1,,k is Weibull, and the corresponding probability density function (PDF) and cumulative distribution function (CDF) are outlined below:

    fi(x)=λiθxθ1eλixθ;x>0,λi,θ>0, (2.1)

    and

    Fi(x)=1eλixθ, (2.2)

    where λi and θ are the scale and shape parameters, respectively.

    (2) The relationship between stress and life is proposed to be expressed in the log-linear model as follows:

    log(λi)=β0+β1si,i=1,,k,

    where β0 and β1 are unknown parameters to be estimated.

    The Weibull log-linear model for the scale parameter has been extensively investigated in the literature, see, for example, Wang and Kececioglu [30]. It is known that the ALTs are often performed in the context of stress factors such as temperature, voltage or pressure. Because the main objective of executing the ALTs is to deduce reliability at a normal level of stress, the statistical model employed for this goal must have some technical foundation as well. As a result, the use of the log-linear model described in assumption 2 allows some conventional engineering models, including inverse power, Arrhenius, and exponential models to be readily acquired as special instances. See for more detail Roy [31].

    Based on the CSALTs, assume k accelerated stress levels s1<s2<<sk and the designed stress level is denoted by su. Also, suppose that there are N similar test units splited into k sets of size n1,n2,,nk, where ki=1ni=N. Before starting the experiment, the number (mi<ni), i=1,,k, the progressive censoring plan Ri,1,,Ri,mi such that ni=mi+mij=1Ri,j and two thresholds Ti,1,Ti,2(0,), where Ti,1<Ti,2,i=1,,k are determined in advance, taking into account that some values of Ri,j's, i=1,,k,j=1,,mi may be changed during the experiment. Then, the IAPT2C with CSALTs can be stated as follows: At the stress level si,i=1,,k, when the first failure arises, designated by Xi,1, Ri,1 (surviving units) are randomly discarded. At Xi,2, Ri,2 units are randomly withdrawn from the remaining surviving units, and so on. Here, we have three possible cases outlined as follows:

    (1) Case Ⅰ: If Xi,mi<Ti,1, the test stops at the time of mith failure with Ri,mi=nimimi1j=1Ri,j are withdrawn. In this case, we have PT2C with CSALTs.

    (2) Case Ⅱ: If Xi,di<Ti,1<Xi,di+1, where di is the size of failures at Ti,1 and (di+1)<mi, with Xi,mi<Ti,2, then we set Ri,di+1==Ri,mi1=0 and end the test at the time of mith failure and at which point all the remaining Ri,mi=nimidij=1Ri,j units are removed. In this case, we have APT2C with CSALTs.

    (3) Case Ⅲ: If Xi,mi>Ti,2, the experiment terminates at Ti,2, with the understanding that no units will be discarded from the experiment when the test time passes the threshold Ti,1. In this case, we have di<mi number of observed failures, where di is the number of failures before the time Ti,2. At the time Ti,2, all remaining units are withdrawn, i.e., Ri=nididij=1Ri,j. This describes the IAPT2C with CSALTs.

    We can express the likelihood function (LF) of the observed data as follows, ignoring the normalized constant, based on the aforementioned scenarios

    L(θ,β0,β1)=ki=1{Jij=1fi(xi,j)Dij=1[1Fi(xi,j)]Ri,j[1Fi(Ti)]Ri}, (2.3)

    where

    Ji={mi,for Cases I and II;di,for Case III,Di={mi,for Case I;di,for Cases II and III,
    Ri={0,for Case I; nididij=1Ri,j,for Case II;nididij=1Ri,j,for Case III,

    and Ti=0,xi,mi and Ti,2 for Cases Ⅰ, Ⅱ and Ⅲ, respectively. Before proceeding, for clarity, Figure 1 depicts the various point and interval estimations considered in this work.

    Figure 1.  Flowchart of the proposed classical and Bayesian estimation approaches.

    In this part, the MLEs of θ, β0 and β1 are discussed using IAPT2C with CSALTs data. Under typical use settings, the MLEs of the scale parameter λu and RF Ru(x0) are provided. Moreover, the interval estimations of the different parameters are formed through the asymptotic theory of the MLEs.

    From (2.1)–(2.3), we can express the LF of θ, β0 and β1 as

    L(θ,β0,β1)=θJexp(Jβ0+β1ki=1Jisi)exp[ki=1exp(β0+β1si)Ψi(θ)]ki=1Jij=1xθ1i,j, (3.1)

    where J=ki=1Ji and Ψi(θ)=Jij=1xθi,j+Dij=1Ri,jxθi,j+RiTθi. The log-LF of (3.1) of θ, β0 and β1 can be expressed as

    (θ,β0,β1)=Jlog(θ)+Jβ0+δβ1+(θ1)ki=1Jij=1log(xi,j)ki=1exp(β0+β1si)Ψi(θ), (3.2)

    where δ=ki=1Jisi. The MLEs ˆθ,^β0 and ^β0 of θ, β0 and β1 can be inferred as

    θ=Jθ+ki=1Jij=1log(xi,j)ki=1exp(β0+β1si)Ψi(θ)=0, (3.3)
    β0=Jki=1exp(β0+β1si)Ψi(θ)=0 (3.4)

    and

    β1=δki=1siexp(β0+β1si)Ψi(θ)=0, (3.5)

    where Ψi(θ)=Jij=1xθi,jlog(xi,j)+Dij=1Ri,jxθi,jlog(xi,j)+RiTθilog(Ti). Using (3.4), the MLE of β0 can be obtained as a function of the other two parameters as follows

    ˆβ0(θ,β1)=log(J)log[ki=1eβ1siΨi(θ)]. (3.6)

    Substituting ˆβ0(θ,β1) in (3.3) and (3.5), the MLEs of θ and β1, denoted by ˆθ and ˆβ1, can be reached by solving the subsequent normal equations

    1θ+ki=1Jij=1log(xi,j)Jki=1eβ1siΨi(θ)ki=1eβ1siΨi(θ)=0 (3.7)

    and

    δJki=1sieβ1siΨi(θ)ki=1eβ1siΨi(θ)=0. (3.8)

    Clearly, there are no closed-form solutions to obtain the MLEs of θ and β1. Therefore, one could direct oneself to numerical iterative procedures like the Newton-Raphson method to acquire the needed estimates from (3.7) and (3.8). Upon the MLEs of θ and β1 being obtained, the MLE ˆβ0=ˆˆβ0(ˆθ,ˆβ1) of β0 can be obtained directly from (3.6).

    Since log(λi)=β0+β1si, one can derive the MLE of λi as a function of θ as ˆλi(θ)=Ji/Ψi(θ). Therefore, we can conclude that ˆλi exists and is unique if θ exists and is unique. Substitute ˆλi(θ) in (3.2), the profile log-LF at stress level i can be written as

    ϖ(θ)=Jilog(θ)+θJij=1log(xi,j)Jilog(Ψi(θ)). (3.9)

    From Lemma 1 in Wang [5], one can conclude that the profile log-LF ϖ(θ) is concave with respect to θ. Consequently, at stress level i, the MLE of θ can be found as

    1θ=Ψi(θ)Ψi(θ)Jij=1log(xi,j)Ji. (3.10)

    It is simple to demonstrate that 1/θ is a monotone decreasing function in θ using (3.10). Conversely, the right-side in (3.10) is monotone increasing in θ, as shown by Lemma 2 in Wang [5]. As a result, there is a clear interaction location for the slopes of both variables from both directions in (3.10). This suggests that the MLE of θ exists and is unique.

    Remark 1. A number of previous studies are expanded upon and readily transformed into special scenarios based on the findings obtained in this investigation. Examples of these include:

    The results of Cui et al. [32], by setting Ti,2 for i=1,2,,k, in the case of APT2C data.

    The results of Ismail [33], by setting Ti=Ti,1=Ti,2 for i=1,2,,k, in the case of Type-Ⅰ progressive hybrid censored data.

    The results of Wang et al. [34], by setting Ti,1 for i=1,2,,k, in the case of PT2C data.

    The results of Watkins and John [35], by setting Ti,1, Ri,j=0 and Ri,mi=nimi for i=1,,k, j=1,,mi1, in the case of Type-II censored data.

    It is important to estimate the scale parameter at the designed stress level as well as the RF. To get such estimates, one can utilize the invariance property of the MLEs. Let λu be the scale parameter under the designed stress level su, then the MLE of λu, denoted by ˆλu, can be obtained as

    ˆλu=eˆβ0+ˆβ1su. (3.11)

    Similarly, the MLE of the RF at time x0 under the designed stress level can be acquired as follows

    ˆRu(x0)=eˆλuxˆθ0, (3.12)

    where R()=1F() and ˆλu is evaluated from (3.11).

    Based on the MLEs' asymptotic normality, the interval estimates for the unknown parameters are given in this subsection. Furthermore, we employ the delta method to approximate the variances of the estimators of the scale parameter and the RF at the designed stress level to obtain the related interval ranges.

    In order to accomplish our goals, we first need to get the expressions of the second derivatives obtained from the log-LF in (3.2) as

    2(θ,β0,β1)θ2=Jθ2ki=1exp(β0+β1si)Ψi(θ),
    2(θ,β0,β1)β20=ki=1exp(β0+β1si)Ψi(θ),
    2(θ,β0,β1)β21=ki=1s2iexp(β0+β1si)Ψi(θ),
    2(θ,β0,β1)θβ0=ki=1exp(β0+β1si)Ψi(θ),
    2(θ,β0,β1)θβ1=ki=1siexp(β0+β1si)Ψi(θ)

    and

    2(θ,β0,β1)β0β1=ki=1siexp(β0+β1si)Ψi(θ),

    where Ψi(θ)=Jij=1xθi,jlog2(xi,j)+ Dij=1Ri,jxθi,jlog2(xi,j)+RiTθilog2(Ti). The complex nature of the expectations of the second partial derivatives makes it evident that the asymptotic variance-covariance matrix (AV-CM) of the MLEs of θ, β0, and β1 cannot be constructed. Therefore, by obtaining the inverted observed Fisher information as follows, we are able to obtain the approximate AV-CM for the MLEs

    I0(ˆθ,ˆβ0,ˆβ1)=[2(θ,β0,β1)θ22(θ,β0,β1)θβ02(θ,β0,β1)θβ12(θ,β0,β1)β0θ2(θ,β0,β1)β202(θ,β0,β1)β0β12(θ,β0,β1)β1θ2(θ,β0,β1)β1β02(θ,β0,β1)β21]1(θ,β0,β1)=(ˆθ,ˆβ0,ˆβ1). (3.13)

    Obviously, the asymptotic distribution of (ˆθ,ˆβ0,ˆβ1) is N[(θ,β0,β1),I0(ˆθ,ˆβ0,ˆβ1)], where I0(ˆθ,ˆβ0,ˆβ1) is determined by (3.13). Hence, the 100(1α)% ACIs of ˆθ,ˆβ0 and ˆβ1 can be computed as

    ˆθ±zα/2^var(ˆθ),^β0±zα/2^var(^β0)and^β1±zα/2^var(^β1),

    where ^var(ˆθ),^var(^β0) and ^var(^β1) are the main diagonal elements of I0(ˆθ,ˆβ0,ˆβ1) given by (3.13), respectively, and zα/2 is the higher (α/2)th percentile standard normal level.

    In order to construct the ACIs for the λu and the RF under the designed stress level, we require getting the variances of their estimators. To obtain such variances, we suggest using the delta method to compute the approximate estimates of these variances; see Greene[36] for complete details about the delta method. Let ^var(ˆλu) and ^var(ˆRu) denote the approximate estimates of the variances of the MLEs of the scale parameter and RF, respectively. Then, based on the delta method, we have

    ^var(ˆλu)[ΛλuI0(ˆθ,ˆβ0,ˆβ1)Λλu](θ,β0,β1)=(ˆθ,ˆβ0,ˆβ1)and^var(ˆRu)[ΛRuI0(ˆθ,ˆβ0,ˆβ1)ΛRu](θ,β0,β1)=(ˆθ,ˆβ0,ˆβ1)

    where

    Λλu=(λuθ,λuβ0,λuβ1)andΛRu=(Ruθ,Ruβ0,Ruβ1), (3.14)

    with the following elements

    λuθ=0,λuβ0=eβ0+β1suλuβ1=sueβ0+β1su,
    Ruθ=xθ0log(x0)exp[xθ0eβ0+β1su+β0+β1su],
    Ruβ0=xθ0exp[xθ0eβ0+β1su+β0+β1su]

    and

    Ruβ1=suxθ0exp[xθ0eβ0+β1su+β0+β1su].

    Now, the 100(1α)% ACIs for the scale parameter and the RF under the designed stress level can be obtained, respectively, as follows:

    ˆλu±zα/2^var(ˆλu)andˆRu(x0)±zα/2^var(ˆRu).

    The MPS estimation approach is proposed as a competitive approach to the usual maximum likelihood method by Cheng and Amin[37] and Ranneby[38], independently. Using this approach, the MPSEs are attained using the same logic as the MLEs by maximizing the PS function. Let Δi,j=F(xi,j)F(xi,j1),i=1,,k,j=1,,Ji be the uniform spacings of an IAPT2C random sample of size Ji from the Weibull distribution under CSALTs with xi,0=0, xi,Ji+1= and Δi,Ji+1=1F(xi,Ji) such that Ji+1j=1Δi,j=1. For more studies about the MPS procedure, one can refer to Basu et al.[39], Volovskiy and Kamps [40], and Chaturvedi et al. [41]. However, we can write the PS function of the IAPT2C with CSALTs data as follows:

    P(θ,β0,β1)=ki=1{Ji+1j=1Δi,jDij=1[1Fi(xi,j)]Ri,j[1Fi(Ti)]Ri}. (4.1)

    In this section, we study the MPSEs of θ,β0 and β1 using IAPT2C with CSALTs data. Utilizing the invariance trait of the MPSEs, the estimates of λu and RF at the designed stress level are also computed. Likewise, the ACIs of the different parameters are created using the asymptotic normality of the MPSEs. For more detail regarding the properties of the MPSEs, one can see Ranneby [38], Cheng and Traylor [42], Ghosh and Jammalamadaka [43], and Anatolyev and Kosenok [44].

    Suppose we have an IAPT2C sample taken from the Weibull population with CDF given by (2.2), the PS function of θ, β0 and β1 can be expressed using (2.2) and (4.1) as follows:

    P(θ,β0,β1)=exp[ki=1exp(β0+β1si)Φi(θ)]ki=1Ji+1j=1[exp(eβ0+β1sixθi,j1)exp(eβ0+β1sixθi,j)], (4.2)

    where Qi(θ)=Dij=1Ri,jxθi,j+RiTθi. The log-PS function of (4.2) takes the form

    p(θ,β0,β1)=ki=1Ji+1j=1log[exp(eβ0+β1sixθi,j1)exp(eβ0+β1sixθi,j)]ki=1exp(β0+β1si)Qi(θ). (4.3)

    The MPSEs ˜θ,˜β0 and ˜β1 of θ, β0 and β1 can be obtained by maximizing the objective function in (4.3) with respect to θ, β0 and β1, or equivalently by solving the following three normal equations:

    p(θ,β0,β1)θ=ki=1Ji+1j=1ϕi,jϕi,j1Δi,jki=1exp(β0+β1si)Qi(θ)=0, (4.4)
    p(θ,β0,β1)β0=ki=1Ji+1j=1φi,jφi,j1Δi,jki=1exp(β0+β1si)Qi(θ)=0 (4.5)

    and

    p(θ,β0,β1)β1=ki=1Ji+1j=1siφi,jφi,j1Δi,jki=1siexp(β0+β1si)Qi(θ)=0, (4.6)

    where

    ϕi,j=xθi,jlog(xi,j)exp[xθi,jeβ0+β1si+β0+β1si],
    Δi,j=exp(eβ0+β1sixθi,j1)exp(eβ0+β1sixθi,j),
    Qi(θ)=Dij=1Ri,jxθi,jlog(xi,j)+RiTθilog(Ti)

    and

    φi,j=xθi,jexp[xθi,jeβ0+β1si+β0+β1si].

    It is clear from (4.4)–(4.6) that the MPSEs cannot be obtained in closed-form solutions, similar to the case of the MLEs. Accordingly, one can employ an iterative technique to attain the needed estimates numerically. Consequently, employing the invariance property of the MPSEs, we can get the MPSEs of λu and RF under the designed stress level, respectively, as

    ˜λu=e˜β0+˜β1su (4.7)

    and

    ˜Ru(x0)=e˜λux˜θ0. (4.8)

    In this subsection, we use the asymptotic features of the MPSEs to create the ACIs of θ, β0 and β1 as well as λu and RF at the designed stress level. Firstly, from (4.3), we require obtaining the next quantities

    2p(θ,β0,β1)θ2=ki=1Ji+1j=1[ϕi,jϕi,j1Δi,j(ϕi,jϕi,j1)2Δ2i,j]ki=1exp(β0+β1si)Qi(θ),
    2p(θ,β0,β1)β0=ki=1Ji+1j=1[φi,jφi,j1Δi,j(φi,jφi,j1)2Δ2i,j]ki=1exp(β0+β1si)Qi(θ),
    2p(θ,β0,β1)β0=ki=1Ji+1j=1s2i[φi,jφi,j1Δi,j(φi,jφi,j1)2Δ2i,j]ki=1s2iexp(β0+β1si)Qi(θ),
    2p(θ,β0,β1)θβ0=ki=1Ji+1j=1[ϕi,jϕi,j1Δi,jψi,jΔ2i,j]ki=1exp(β0+β1si)Qi(θ),
    2p(θ,β0,β1)θβ1=ki=1Ji+1j=1si[ϕi,jϕi,j1Δi,jψi,jΔ2i,j]ki=1siexp(β0+β1si)Qi(θ)

    and

    2p(θ,β0,β1)β0β1=ki=1Ji+1j=1si[φi,jφi,j1Δi,j(φi,jφi,j1)2Δ2i,j]ki=1siexp(β0+β1si)Qi(θ),

    where

    ϕi,j=xθi,jlog2(xi,j)exp[xθi,jeβ0+β1si+β0+β1si][1xθi,jeβ0+β1si],
    Qi(θ)=Dij=1Ri,jxθi,jlog2(xi,j)+RiTθilog2(Ti),
    φi,j=xθi,jexp[xθi,jeβ0+β1si+β0+β1si][1xθi,jeβ0+β1si],
    ψi,j=(ϕi,jϕi,j1)(φi,jφi,j1)andϕi,j=ϕi,jlog(xi,j).

    The expectations of the expressions of the second derivatives are not straightforward to obtain. Thus, the AV-CM of the MPSEs of θ, β0, and β1 cannot be obtained in closed structures. So, we use the approximate AV-CM for the MPSEs as

    I0(˜θ,˜β0,˜β1)=[2p(θ,β0,β1)θ22p(θ,β0,β1)θβ02p(θ,β0,β1)θβ12p(θ,β0,β1)β0θ2p(θ,β0,β1)β202p(θ,β0,β1)β0β12p(θ,β0,β1)β1θ2p(θ,β0,β1)β1β02p(θ,β0,β1)β21]1(θ,β0,β1)=(˜θ,˜β0,˜β1). (4.9)

    Following the MPSE's asymptotic features, similar to the case of the MLEs, the 100(1α)% ACIs of θ, β0 and β1 can be constructed as

    ˜θ±zα/2~var(˜θ),~β0±zα/2~var(~β0)and~β1±zα/2~var(~β1),

    where ~var(˜θ),~var(~β0) and ~var(~β1) are the main diagonal elements of I0(˜θ,˜β0,˜β1) presented by (4.9).

    Now, we need to build the ACIs of the λu and the RF under the designed stress level. To achieve this purpose, we first consider using the delta method to compute the approximate estimates of the variances ~var(~λu) and ~var(˜Ru) as follows:

    ~var(˜λu)[ΛλuI0(˜θ,˜β0,˜β1)Λλu](θ,β0,β1)=(˜θ,˜β0,˜β1)and~var(˜Ru)[ΛRuI0(˜θ,˜β0,˜β1)ΛRu](θ,β0,β1)=(˜θ,˜β0,˜β1)

    where Λλu and ΛRu are as defined in (3.14). Then, the 100(1α)% ACIs of λu and RF under the designed stress level are computed, respectively, by

    ˜λu±zα/2~var(˜λu)and˜Ru(x0)±zα/2~var(˜Ru).

    When the sample size is large enough or there is no censoring of the data, classical estimation procedures usually produce highly precise results. However, in experiments with small sample sizes or when there is censored data, these classical procedures can sometimes lead to misleading and incorrect conclusions. The Bayesian approach offers a solution by incorporating additional prior information, such as historical data or existing knowledge, into the statistical inference process. This allows for more accurate estimations. In this section, we will discuss Bayesian estimations of θ, β0, and β1. We will also examine λu and RF under the designated stress level. To investigate the Bayesian estimates, both points and intervals, we will derive the posterior distributions based on the LF and PS functions, respectively.

    In this subsection, it is considered that the parameters θ, β0 and β1 are statistically independent. It is observed from (3.1) or (4.2) that no conjugate prior distributions are available for the unknown parameters due to the complex expressions of the LF or PS function. Furthermore, it is to be mentioned here that it is not straightforward to involve Jeffrey's priors because of the complicated form of the Fisher information matrices using both classical approaches. Therefore, we assume that the parameters θ and β1 have gamma PDFs, i.e., θGamma(c1,w1) and β1Gamma(c2,w2). We consider the gamma prior distributions since they adjust the support of the unknown parameters θ and β1 and are fairly straightforward. They are also flexible and incorporate a wide range of prior knowledge. Furthermore, the usage of gamma prior distributions may not result in much complexity in posterior evaluation or calculation scenarios, particularly when employing the MCMC technique. On the other hand, it is known that the parameter β0 can be positive (or negative) depending on the nature of the product. Therefore, we adopted this information and assumed that the parameter β0 has a normal prior distribution, i.e., β0N(μ,σ2). Here, we select the normal distribution due to its popularity and flexibility with the understanding that some other distributions like generalized logistic type-Ⅰ or Gumbel distributions can be used. So, the joint prior distribution becomes

    g(θ,β0,β1)θc11βc211exp[(w1θ+w2β1+(β0μ)2/2σ2)],θ,β1>0,<β0<, (5.1)

    where c1,c2,w1,w2,σ>0 and <μ<, are the associated hyper-parameters and are considered to be known. The joint prior in (5.1) reduces to the case of non-informative prior when c1=c2=w1=w2=μ=0 and σ=β0/2log(β0).

    From a Bayesian perspective, the choice of loss function plays a crucial part in the inference issues. Since there is no precise analytical method for determining which loss function should be used, most studies on estimating problems have assumed that the underlying loss function, which is a symmetric loss function, is the squared error loss function (SELF). Assuming ˇτ represents the parameter τ's Bayesian estimator, then the SELF can be expressed as

    ζ(τ,ˇτ)=(ˇττ)2. (5.2)

    From (5.2), the Bayes estimator ˇτ of τ is the posterior mean of τ.

    Combining the LF in (3.1) with the joint prior distribution in (5.1), the joint posterior PDF of θ, β0, and β1 can be expressed as

    π(θ,β0,β1)=AθJ+c11βc211exp[Jβ0(β0μ)2/2σ2β1(w2δ)w1θ]ki=1Jij=1xθ1i,j×exp[ki=1exp(β0+β1si)Ψi(θ)], (5.3)

    where A is the normalized constant. Let η(θ,β0,β1) be any parametric function of θ, β0 and β1, then the Bayesian estimator using likelihood-based, denoted by ˇη(θ,β0,β1), using the SELF is the expectation of the posterior distribution in (5.3), which is given by

    ˇη(θ,β0,β1)=00η(θ,β0,β1)g(θ,β0,β1)L(θ,β0,β1)dθdβ0dβ100g(θ,β0,β1)L(θ,β0,β1)dθdβ0dβ1. (5.4)

    From (5.4), it is obvious that it is not probable to acquire an exact expression for the Bayesian estimator ˇη(θ,β0,β1) because it is depicted as the ratio of three intractable integrals. Accordingly, the MCMC technique is implemented to calculate the required estimates. To do the steps of the MCMC technique, we first need to derive the conditional distributions of θ, β0 and β1 as

    π1(θ|β0,β1)θJ+c11ew1θexp[ki=1exp(β0+β1si)Ψi(θ)]ki=1Jij=1xθ1i,j, (5.5)
    π2(β0|β1,θ)exp[ki=1exp(β0+β1si)Ψi(θ)+Jβ0(β0μ)2/2σ2] (5.6)

    and

    π3(β1|β0,θ)βc211eβ1(w2δ)exp[ki=1exp(β0+β1si)Ψi(θ)]. (5.7)

    Clearly, the conditional distributions of θ, β0, and β1 in (5.5)–(5.7) cannot be described by any well-known distributions. Thus, to get the Bayes estimates, the Metropolis-Hastings (M-H) procedure is operated to yield random samplings from these distributions. However, to perform Bayesian estimation by performing the M-H algorithm, the stages of the sample generation procedure in Algorithm 1 have to be completed.

    Algorithm 1 The M-H procedure
    Step 1. Begin with initial values of (θ,β0,β1), say (θ(0),β(0)0,β(0)1)=(ˆθ,ˆβ0,ˆβ1).
    Step 2. Put t=1.
    Step 3. Get θ from (5.5) using normal proposal distribution N(θ(t1),^var(ˆθ)).
    Step 4. Obtain the acceptance probability p(θ(t1)|θ)=min[1,π1(θ|β(t1)0,β(t1)1)π1(θ(t1)|β(t1)0,β(t1)1)].
    Step 5. Generate u, where UU(0,1).
    Step 6. If up(θ(t1)|θ), set θ(t)=θ, else, set θ(t)=θ(t1).
    Step 7. Redo Steps 3–6 for β0 and β1 to generate β(t)0 and β(t)1 from (5.6) and (5.7), respectively.
    Step 8. Obtain λ(t)u=eβ(t)0+β(t)1su and R(t)u(x0)=exp[xθ(t)0eβ(t)0+β(t)1su].
    Step 9. Put t=t+1.
    Step 10. Redo Steps 3–8 H times to calculate:
    [θ(1),β(1)0,β(1)1,λ(1)u,R(1)u(x0)],,[θ(H),β(H)0,β(H)1,λ(H)u,R(H)u(x0)].

    Consequently, the Bayesian estimates of θ, β0 and β1 under the SELF can be obtained as follows:

    ˇθ=1HMHt=M+1θ(t),ˇβ0=1HMHt=M+1β(t)0andˇβ1=1HMHt=M+1β(t)1,

    where M is the burn-in period. Also, the Bayesian estimates of λu and RF at the designed stress level can be computed, respectively, as

    ˇλu=1HMHt=M+1λ(t)u,andˇRu(x0)=1HMHt=M+1R(t)u(x0).

    Moreover, Algorithm 2 offers the steps for creating a 100(1α)% BCI of ξ, where ξ=[θ,β0,β1,λu,Ru(x0)].

    Algorithm 2 The BCI procedure
    Step 1. From Step 10 in Algorithm 1, sort ξ(t), t=M+1,,H in ascending order as
    ξ[M+1],,ξ[H].
    Step 2. The 100(1α)% BCI of ξ is given by {ξ[α(HM)/2], ξ[(1α/2)(HM)]}.

    The Bayesian estimators of θ, β0, and β1 as well as λu and RF at the usual stress level are obtained using PS-based estimation. Merging the PS function in (4.2) with the joint prior distribution given by (5.1), the joint posterior distribution of θ, β0, and β1 takes the following form

    ϖ(θ,β0,β1)=Bθc11βc211exp[(β0μ)2/2σ2β1w2w1θki=1exp(β0+β1si)Qi(θ)]×ki=1Ji+1j=1[exp(eβ0+β1sixθi,j1)exp(eβ0+β1sixθi,j)], (5.8)

    where B is the normalized constant. Using the SELF (5.2) and the joint posterior PDF (5.8), one can obtain the Bayesian estimator using the PS-based of η(θ,β0,β1), denoted by ˘η(θ,β0,β1), as follows:

    ˘η(θ,β0,β1)=00η(θ,β0,β1)g(θ,β0,β1)P(θ,β0,β1)dθdβ0dβ100g(θ,β0,β1)P(θ,β0,β1)dθdβ0dβ1. (5.9)

    Similar to the case of Bayesian estimation using the likelihood-based method, it is not achievable to obtain (5.9) analytically. Hence, we suggest approximating it by employing the MCMC technique. To apply the MCMC steps, we first derive the conditional distributions of θ, β0 and β1, respectively, as

    ϖ1(θ|β0,β1)θc11exp[w1θki=1exp(β0+β1si)Qi(θ)]ki=1Ji+1j=1Δi,j(θ,β0,β1), (5.10)
    ϖ2(β0|β1,θ)exp[(β0μ)2/2σ2ki=1exp(β0+β1si)Qi(θ)]ki=1Ji+1j=1Δi,j(θ,β0,β1) (5.11)

    and

    ϖ3(β1|β0,θ)βc211exp[β1w2ki=1exp(β0+β1si)Qi(θ)]ki=1Ji+1j=1Δi,j(θ,β0,β1), (5.12)

    where Δi,j(θ,β0,β1)=Δi,j.

    Remark 2. The conditional distributions in (5.10)–(5.12) cannot be presented by any known distribution, hence samples from these distributions can be gained via the M-H technique. This enables the acquisition of the necessary Bayesian estimates for the various parameters. For this goal, the same procedures as are listed in Algorithms 1 and 2 can be carried out.

    By considering two sets of stress levels si, i=1,2, namely Stress-Ⅰ:(0.25, 0.75) and Stress-Ⅱ:(1.5, 2.5), a number of 1,000 IAPT2C samples are generated when the true value of parameters (θ,β0,β1) is taken as (0.8, 0.5, 0.2) for different combinations of (Ti,1,Ti,2), namely (0.1, 0.3) and (0.3, 0.7). To analyze the efficiency of the proposed estimators of θ, β0, β1, λu, λ1, λ2 and Ru(x0), we perform comparisons based on different choices of complete (effective) sample sizes ni(mi), two time thresholds Ti,1 and Ti,2, censoring schemes Ri,j's for i=1,2,,k and j=1,2,,mi. The design scenarios of this study are presented in Table 1. Here, we assume that the predetermined times Ti,1 and Ti,2 are equal for the different stress levels. Therefore, we use the notation (T1,T2) instead of Ti,1 and Ti,2 in this section. For each scenario, the actual values corresponding to the unknown parameters (λ1,λ2) with respect to stress sets Ⅰ and Ⅱ are (1.7333,1.9155) and (2.2255,2.7182), respectively. Furthermore, using su=0.1, the proposed estimates of λu and Ru(x0), for distinct time x0, are evaluated, while their true values are 1.6820 and 0.7660, respectively.

    Table 1.  Various scenarios of the numerical comparisons.
    Design (n1,m1) (n2,m2) (R1,1,R1,2,,R1,m1) (R2,1,R2,2,,R2,m2) S[CS]m1,m2
    1 (30, 15) (40, 20) (115) (120) S[1]15,20
    2 (15,014) (20,019) S[2]15,20
    3 (014,15) (019,20) S[3]15,20
    4 (7,013,8) (10,018,10) S[4]15,20
    5 (30, 20) (40, 20) (110,010) (110,020) S[1]20,30
    6 (10,019) (10,029) S[2]20,30
    7 (019,10) (029,10) S[3]20,30
    8 (5,018,5) (5,028,5) S[4]20,30
    9 (80, 40) (60, 30) (140) (130) S[1]40,30
    10 (40,039) (30,029) S[2]40,30
    11 (039,40) (029,30) S[3]40,30
    12 (20,038,20) (15,028,15) S[4]40,30
    13 (80, 60) (60, 45) (120,020) (115,030) S[1]60,45
    14 (20,059) (15,044) S[2]60,45
    15 (059,20) (044,15) S[3]60,45
    16 (10,058,10) (7,043,8) S[4]60,45

     | Show Table
    DownLoad: CSV

    To run a life-test experiment based on the IAPT2C with CSALTs, follow the steps in Algorithm 3.

    Algorithm 3 Sampling procedure of IAPT2C with Weibull CSALTs
    Step 1. Specify the quantities k, ni, mi, T1, T2 and Ri,j for i=1,,k,j=1,,mi.
    Step 2. Set the parameter values of θ, β0 and β1.
    Step 3. Obtain k random samples (of size mi) from U(0,1), (Ui,1,Ui,2,,Ui,mi), i=1,2,,k.
    Step 4. For Ri,j with i=1,2,,k and j=1,2,,mi, put Wi,j=U(j+mir=mij+1Ri,r)1i,j for i=1,,k,j=1,,mi.
    Step 5. Set Ui,j=1mir=mij+1Wi,r.
    Step 6. Use Step 5, generate PT2C samples of size mi from Weibull(θ,λi) distribution as
    Xi,j=[exp((β0+β1si))log(1Ui,j)]1θ, i=1,2,,k, j=1,2,,mi.
    Step 7. Use Step 6, find di and di at T1 and T2, respectively.
    Step 8. At T1, remove the remaining sample Xi,j, i=1,2,,k, j=di+2,,mi.
    Step 9. Obtain the first midi1 order statistics as Xdi+2,,Xmi with size nidi1dij=1Ri,j from a truncated distribution fi(x)[1Fi(xdi+1)]1, i=1,2,,k.
    Step 10. Specify the case type of the proposed scheme such that
                a. If Xi,mi<T1 (Case-Ⅰ), the experiment stops at mthi failure and this point the surviving live items Ri,mi=nimimi1j=1Ri,j are removed.
                b. If Xi,di<T1<Xi,di+1 (Case-Ⅱ), the experiment stops at Xi,mi with failure data Xi,j for i=1,,k,j=1,,mi and progressive censoring (Ri,1,Ri,2,,Ri,di,0,,0,Ri,mi). Here, the surviving live items Ri,mi=nimidij=1Ri,j are removed at the ending point.
                c. If Xi,mi>T2 (Case-Ⅲ), the experiment stops at T2 with failure data Xi,j for i=1,,k,j=1,,di, where di<mi, with the same progressive censoring of Case-Ⅱ. Here, the remaining live units Ri=nididij=1Ri,j are removed at the final point.

    The specification of hyper-parameter values is the main issue in a Bayesian setup. It is known that if improper prior knowledge on the unknown subjects is available, then the objective's posterior density goes down to its matching LF (or PS). Consequently, it is preferable to estimate the unknown parameters by any frequentist approach rather than the Bayesian approach due to the computational exhaustion of the latter. So, we take (c1,c2)=(8,2) and wi=10, i=1,2, for θ and β1 also take (μ,σ)=(0.5,1) for β0. Alternatively, one could determine the hyper-parameter values for the unknown parameters of interest using "past sample". Following Section 5, we set H=12,000 and M=2,000. Here, the MLE and MPSE are used as initial guesses for running the MCMC sampler. However, the average estimates (AvEs), root mean squared-errors (RMSEs), mean relative absolute biases (MRABs), average confidence lengths (ACLs), and coverage probabilities (CPs) of θ, β0, β1, λu, λ1, λ2, and Ru(x0) are calculated.

    All necessary computational algorithms are coded in R statistical programming language software version 4.0.4 via three packages: (ⅰ) 'coda' package proposed by Plummer et al.[45], (ⅱ) 'maxLik' package by Henningsen and Toomet[46], (ⅲ) 'GoFKernel' package by Pavia[47].

    The simulation results of θ, β0, β1, λu, λ1, λ2, and Ru(x0) are reported in the supplementary material. Briefly, the first part of the simulated results, when S[1]15,20 and S[1]20,20 for each Ti, i=1,2, values, is reported in Tables 2 and 3. In each Monte Carlo output table, for each scenario, the corresponding estimates of each parameter based on stresses Ⅰ and Ⅱ are tabulated in the first and second lines, respectively.

    Table 2.  The point estimations.
    (T1,T2) S[CS]m1,m2 Par. MLE MPSE MCMC-LF MCMC-PS
    AvE RMSE MRAB AvE RMSE MRAB AvE RMSE MRAB AvE RMSE MRAB
    (0.1, 0.3) S[1]15,20 θ 0.7833 0.1328 0.1304 0.8396 0.1515 0.1435 0.8701 0.1391 0.1215 0.9181 0.1717 0.1772
    0.7389 0.1257 0.1235 0.7826 0.1290 0.1310 0.8086 0.0983 0.0473 0.8416 0.1099 0.0840
    β0 0.2568 0.4544 0.7127 0.2653 0.4899 0.7609 0.5015 0.0484 0.0467 0.5885 0.1183 0.1788
    0.3094 0.6184 0.9737 0.3398 0.6570 1.0380 0.5250 0.0691 0.0715 0.6466 0.1647 0.2933
    β1 0.1884 0.6093 2.4065 0.2371 0.6777 2.6750 0.1546 0.0765 0.2357 0.1772 0.1157 0.5383
    0.1311 0.3065 1.2009 0.1335 0.3301 1.2968 0.1032 0.0591 0.3760 0.1392 0.0896 0.3091
    λu 1.3913 0.5543 0.2703 1.4292 0.6027 0.2855 1.7127 0.1499 0.0367 1.6832 0.1006 0.0251
    1.6106 0.9612 0.4237 1.7027 1.0880 0.4690 1.9445 0.3019 0.1560 1.8336 0.2402 0.0914
    λ1 1.4028 0.4965 0.2414 1.4443 0.5149 0.2441 1.8737 0.2584 0.0832 1.7408 0.1728 0.0409
    1.7042 0.6381 0.2465 1.7715 0.6564 0.2589 2.1714 0.3385 0.1002 2.4402 0.5979 0.0829
    λ2 1.5309 0.5141 0.2215 1.6097 0.5281 0.2347 1.8397 0.2889 0.0791 2.0172 0.3712 0.0597
    1.9714 0.9533 0.3075 2.0595 0.9431 0.2964 2.9168 1.3717 0.1316 2.6177 0.6466 0.1058
    Ru(x0) 0.7970 0.0680 0.0724 0.8151 0.0794 0.0870 0.7885 0.0965 0.0605 0.7961 0.1005 0.0700
    0.7540 0.1219 0.1215 0.7642 0.1269 0.1284 0.7362 0.0871 0.0418 0.7805 0.0839 0.0457
    S[1]20,30 θ 0.8127 0.1366 0.1320 0.8693 0.1669 0.1568 0.8181 0.0875 0.0401 0.8375 0.1057 0.0760
    0.8010 0.1125 0.1112 0.8477 0.1287 0.1238 0.7710 0.0847 0.0552 0.8035 0.0984 0.0556
    β0 0.3580 0.4365 0.6844 0.3627 0.4781 0.7476 0.5115 0.0494 0.0557 0.5584 0.0870 0.1298
    0.5816 0.7743 1.2523 0.6209 0.8321 1.3482 0.5758 0.0874 0.1516 0.3881 0.1310 0.2481
    β1 0.2561 0.6622 2.6246 0.3060 0.7336 2.9101 0.1616 0.0621 0.2436 0.1597 0.0642 0.2600
    0.1303 0.3869 1.5836 0.1300 0.4163 1.7039 0.1815 0.0536 0.1796 0.1679 0.0789 0.2505
    λu 1.5614 0.5546 0.2686 1.5985 0.6197 0.2968 1.7843 0.1720 0.0668 1.6971 0.1005 0.0287
    2.3465 1.9292 0.7472 2.5269 2.2543 0.8524 1.5027 0.2241 0.1224 1.8111 0.1653 0.0767
    λ1 1.5884 0.4691 0.2212 1.6307 0.5179 0.2430 1.8342 0.1861 0.0722 1.8584 0.1815 0.0641
    2.2733 0.6735 0.2436 2.3746 0.7521 0.2677 1.8988 0.4792 0.1792 2.1361 0.3435 0.0822
    λ2 1.7972 0.4865 0.2069 1.8867 0.5404 0.2271 2.0277 0.2807 0.0602 2.0123 0.2529 0.0613
    2.6269 0.9203 0.2705 2.7555 1.0349 0.2963 2.2537 0.7686 0.2186 2.5297 0.6642 0.1345
    Ru(x0) 0.7886 0.0704 0.0743 0.8078 0.0800 0.0870 0.7586 0.0780 0.0265 0.7491 0.0838 0.0331
    0.7165 0.1647 0.1624 0.7265 0.1680 0.1669 0.7716 0.0798 0.0352 0.7773 0.0826 0.0415
    (0.3, 0.7) S[1]15,20 θ 0.7170 0.1249 0.1264 0.7564 0.1341 0.1402 0.8823 0.1253 0.1009 0.8507 0.1396 0.1329
    0.7197 0.1157 0.1157 0.7629 0.1267 0.1356 0.8058 0.0826 0.0449 0.8281 0.0855 0.0615
    β0 0.4397 0.5166 0.8222 0.4618 0.5495 0.8680 0.4840 0.0532 0.0780 0.5468 0.0669 0.1060
    0.6623 0.7447 1.1670 0.7183 0.8219 1.2889 0.5372 0.0705 0.0875 0.5844 0.1099 0.1715
    β1 0.6583 0.8447 3.3263 0.7060 0.9016 3.5181 0.1405 0.0959 0.3686 0.1028 0.1172 0.5428
    0.3134 0.3890 1.5435 0.3511 0.4258 1.6915 0.1911 0.0408 0.1299 0.1860 0.0573 0.1581
    λu 1.4702 0.7128 0.3218 1.5097 0.8374 0.3471 1.7627 0.1292 0.0552 1.6563 0.0982 0.0401
    2.0254 3.1097 0.6561 2.1920 4.0312 0.7730 1.8247 0.2141 0.0867 1.7329 0.1429 0.0416
    λ1 1.4515 0.5776 0.2723 1.4895 0.6451 0.2861 1.8648 0.2280 0.0786 1.7611 0.1612 0.0404
    1.8770 0.8160 0.2847 1.9836 0.9328 0.2949 2.3063 0.4154 0.0819 2.1727 0.2695 0.0629
    λ2 1.5797 0.7426 0.3241 1.6548 0.8040 0.3241 2.0076 0.3252 0.0554 1.8604 0.2693 0.0720
    2.1956 1.2974 0.3766 2.3967 1.5093 0.3831 2.8136 0.8642 0.1146 2.6447 0.4994 0.0855
    Ru(x0) 0.7585 0.0877 0.0889 0.7731 0.0888 0.0914 0.7827 0.0919 0.0497 0.7785 0.0929 0.0536
    0.7171 0.1680 0.1592 0.7296 0.1744 0.1668 0.7560 0.0710 0.0254 0.7787 0.0669 0.0378
    S[1]20,30 θ 0.7911 0.0962 0.0951 0.8336 0.1079 0.1049 0.8239 0.0759 0.0538 0.8964 0.1363 0.1447
    0.7815 0.0889 0.0891 0.8272 0.0979 0.0947 0.7805 0.0825 0.0421 0.8359 0.0835 0.0693
    β0 0.5416 0.3997 0.6244 0.5675 0.4393 0.6880 0.5036 0.0472 0.0426 0.5084 0.0520 0.0432
    0.6540 0.5839 0.9283 0.6734 0.6366 1.0080 0.5317 0.0680 0.0834 0.5349 0.0729 0.0938
    β1 0.5227 0.6628 2.6255 0.5711 0.7157 2.8350 0.2299 0.0606 0.1918 0.2485 0.0721 0.2543
    0.2442 0.2898 1.1557 0.2818 0.3178 1.2627 0.2167 0.0564 0.1279 0.2086 0.0575 0.2276
    λu 1.7415 0.5921 0.2678 1.7887 0.6771 0.3018 1.7074 0.1154 0.0265 1.6918 0.0973 0.0239
    2.0593 1.3475 0.5182 2.1004 1.5785 0.5704 1.7515 0.1592 0.0467 1.7430 0.1414 0.0512
    λ1 1.7242 0.4416 0.1996 1.7696 0.5017 0.2252 1.8140 0.1849 0.0503 1.7731 0.1387 0.0328
    2.1354 0.4587 0.1626 2.2278 0.5153 0.1733 2.3832 0.5089 0.0891 2.2788 0.3154 0.0786
    λ2 1.7853 0.4060 0.1680 1.8505 0.4355 0.1766 2.0401 0.2922 0.0662 2.0120 0.2384 0.0583
    2.4105 0.5732 0.1729 2.6279 0.6881 0.1919 3.0023 1.0799 0.1290 2.8317 0.6005 0.1290
    Ru(x0) 0.7575 0.0724 0.0738 0.7727 0.0740 0.0768 0.7711 0.0646 0.0304 0.7963 0.0856 0.0647
    0.7257 0.1322 0.1265 0.7462 0.1327 0.1297 0.7462 0.0650 0.0288 0.7783 0.0625 0.0369

     | Show Table
    DownLoad: CSV
    Table 3.  The interval estimations.
    (T1,T2) S[CS]m1,m2 Par. 95% ACI-LF 95% ACI-PS 95% BCI-LF 95% BCI-PS
    ACL CP ACL CP ACL CP ACL CP
    (0.1, 0.3) S[1]15,20 θ 0.5560 0.952 0.5660 0.948 0.3596 0.999 0.3897 0.999
    0.4510 0.960 0.4881 0.955 0.2553 0.999 0.2892 0.999
    β0 2.0516 0.978 2.0764 0.966 0.1610 0.985 0.2462 0.975
    3.0210 0.961 3.1012 0.944 0.2089 0.982 0.2637 0.980
    β1 3.2354 0.916 3.2354 0.914 0.2431 0.979 0.2526 0.975
    1.4690 0.929 1.5075 0.925 0.2013 0.987 0.1947 0.985
    λu 2.5371 0.905 2.5571 0.893 0.4347 0.948 0.5659 0.932
    4.6342 0.889 5.0269 0.891 0.4996 0.936 0.3104 0.929
    λ1 2.2143 0.914 2.3832 0.911 0.5059 0.948 0.6173 0.941
    2.7200 0.876 2.9487 0.871 1.4813 0.927 1.0118 0.925
    λ2 2.2231 0.883 2.4401 0.880 0.7639 0.939 0.8845 0.927
    3.4784 0.916 3.7948 0.910 2.2483 0.949 1.9400 0.934
    Ru(x0) 0.2794 0.916 0.2794 0.918 0.2444 0.999 0.2511 0.999
    0.5673 0.936 0.5574 0.946 0.2130 0.999 0.1984 0.999
    S[1]20,30 θ 0.5298 0.954 0.5798 0.950 0.2880 0.999 0.2409 0.999
    0.4725 0.958 0.5090 0.958 0.2752 0.999 0.2806 0.999
    β0 1.9946 0.954 2.0821 0.937 0.1547 0.984 0.2373 0.980
    2.9102 0.971 2.9843 0.952 0.1604 0.988 0.2024 0.978
    β1 3.0813 0.942 3.1816 0.944 0.1739 0.989 0.2299 0.991
    1.4152 0.969 1.4500 0.970 0.1794 0.994 0.1792 0.990
    λu 2.6788 0.927 2.8572 0.915 0.3789 0.978 0.3131 0.937
    6.4786 0.926 7.1540 0.902 0.4694 0.976 0.3298 0.933
    λ1 2.0886 0.917 2.0886 0.915 0.4951 0.951 0.3890 0.950
    2.0364 0.926 2.2016 0.918 1.0571 0.956 1.0057 0.967
    λ2 2.0727 0.923 2.0727 0.911 0.6826 0.961 0.6980 0.960
    2.5857 0.913 2.8236 0.913 2.1528 0.947 1.8802 0.942
    Ru(x0) 0.2976 0.918 0.2838 0.922 0.2201 0.999 0.1824 0.999
    0.5899 0.941 0.5812 0.943 0.1988 0.999 0.1951 0.999
    (0.3, 0.7) S[1]15,20 θ 0.3919 0.957 0.4224 0.953 0.3395 0.999 0.3355 0.999
    0.3766 0.965 0.4091 0.959 0.2376 0.999 0.2405 0.999
    β0 1.7094 0.984 1.7625 0.959 0.1766 0.988 0.1787 0.960
    2.7713 0.985 2.8548 0.968 0.2421 0.985 0.2043 0.975
    β1 2.8183 0.975 2.8960 0.935 0.2072 0.980 0.2552 0.985
    1.3741 0.974 1.4215 0.944 0.1415 0.985 0.1833 0.986
    λu 2.1840 0.914 2.3305 0.911 0.3548 0.960 0.3232 0.958
    5.5395 0.910 6.2470 0.903 0.5024 0.962 0.4191 0.955
    λ1 1.6722 0.932 1.7866 0.930 0.5508 0.966 0.4795 0.961
    1.9681 0.889 2.1854 0.885 1.1993 0.934 0.7921 0.931
    λ2 1.6436 0.900 1.7969 0.892 0.7994 0.948 0.7396 0.931
    2.6692 0.926 3.1250 0.925 2.3645 0.963 1.4310 0.959
    Ru(x0) 0.3009 0.926 0.2944 0.928 0.2354 0.999 0.2343 0.999
    0.5680 0.945 0.5557 0.946 0.1769 0.999 0.1662 0.999
    S[1]20,30 θ 0.4011 0.960 0.4279 0.955 0.2133 0.999 0.2925 0.999
    0.3664 0.968 0.3928 0.961 0.2310 0.999 0.2300 0.999
    β0 1.6277 0.985 1.6672 0.971 0.1633 0.985 0.2002 0.975
    2.4509 0.952 2.4873 0.949 0.2062 0.978 0.1557 0.973
    β1 2.5975 0.981 2.6477 0.952 0.1781 0.982 0.1881 0.988
    1.2267 0.979 1.2510 0.961 0.1641 0.986 0.2202 0.986
    λu 2.4141 0.924 2.5375 0.913 0.3384 0.973 0.2961 0.962
    4.7838 0.918 4.9533 0.907 0.4156 0.966 0.4161 0.959
    λ1 1.8599 0.948 1.9577 0.934 0.3982 0.981 0.4704 0.963
    1.8658 0.930 1.9847 0.926 1.3222 0.967 1.0281 0.955
    λ2 1.5677 0.931 1.6583 0.922 0.6432 0.961 0.7273 0.952
    2.4496 0.943 2.7841 0.941 2.6520 0.978 2.0082 0.961
    Ru(x0) 0.2901 0.931 0.2814 0.939 0.1687 0.999 0.2011 0.999
    0.5186 0.947 0.4934 0.948 0.1789 0.999 0.1602 0.999

     | Show Table
    DownLoad: CSV

    Now, the following conclusions on the unknown parameters θ, β0, β1, λu, λ1, λ2, and Ru(x0) are made:

    ● Both frequentist and Bayesian estimates of θ, β0, β1, λu, λ1, λ2, and Ru(x0) are showing satisfactory behavior based on minimum RMSEs, MRABs, and ACLs as well as maximum CPs.

    ● As kini (or kimi) increases, the RMSEs and MRABs decrease of all estimates in most cases as expected.

    ● As Ti, i=1,2, increase, the RMSEs and MRABs of θ and β0 decrease while those associated with others increase.

    ● As Ti, i=1,2, increases, in almost all cases, the ACLs narrow down while the CPs achieve the specified nominal level for all unknown parameters.

    ● As si, i=1,2, grow, the RMSEs and MRABs of θ and β1 decrease while those associated with others increase.

    ● As si, i=1,2, grow, the ACLs decreased while the CPs increase for θ and β1 unlike other unknown parameters.

    ● Comparing the investigated techniques, the simulation results showed that:

    – The LF (along with the MCMC-LF) method is the best for estimating θ, β0, β1, and Ru(x0).

    – The LF of λu, λ1, and λ2 performs satisfactorily compared to the PS in respect of classical estimates, while the MCMC-PS performs better compared with the MCMC-LF in respect of Bayes' estimates.

    – Comparing the performance of the interval methodologies on the basis of smallest ACLs and highest CPs, in most cases, it can be seen that the LF (along with MCMC-LF) method is the best for estimating all unknown parameters except Ru(x0).

    – Because prior knowledge about the unknown parameters is available, the Bayes estimates as well as associated BCI estimates outperform those obtained using the frequentist methods. As a result, the investigated priors are very adaptable in both nature and application.

    ● To appreciate the convergence of the simulated MCMC draws, Brooks–Gelman–Rubin (BGR) diagnostic (when S[1]15,20, (T1,T2)=(0.1,0.3), and (s1,s2)=(0.25,0.75) as an example) is plotted in Figure 2. The BGR assesses the degree of convergence of Markovian sequences by comparing the variance-within and variance-between chains for each model parameter simultaneously. Recently, this diagnostic has also been discussed by Nassar and Elshahhat[48]. We found that the BGR metric indicates that there are certainly no significant variations within the replicated chains. Therefore, one can conclude that the MCMC draws are appropriately mixed.

    Figure 2.  The BGR diagnostic plots for MCMC draws in Monte Carlo simulation.

    ● Ultimately, depending on different accuracy criteria, namely: RMSE and MRAB (for point estimate) as well as ACL and CP (for interval estimate), simulation findings showed that the proposed Bayes (using LF) method via the M-H sampler is significantly better than other competitive methods.

    We analyzed two data sets to determine the practicality of the inferred strategies. The functionality and user-friendliness of these examples have validated the effectiveness of the suggested techniques in practical usage.

    This application deals with the analysis of the lifetime (in hours) of the M00071 white organic light-emitting diode (OLED) mixed with different colors; see Zhang et al.[49]. Recently, OLED data was also discussed by Lin et al.[50] and Nassar et al.[8]. The calculations involved subtracting 1500 and 500 from the lifetime points at s1 and s2, and then dividing the results by their standard deviations. Table 4 presents the newly updated OLED information. According to Zhang et al.[49], there are two stress levels, namely s1=9.64 mA and s2=17.09 mA. At each stress level, the MLEs with their standard-errors (SEs) of θ and λi, i=1,2, as well as the Kolmogorov-Smirnov (KS) with its P-value are calculated; see Table 4. This result indicates that the Weibull distribution fits the OLED data set well. In order to prove the existence and uniqueness of the MLEs ˆθ and ˆλi, i=1,2, the contours of θ and λi, i=1,2, are provided in Figure 3. It indicates that the MLEs of θ and λi, i=1,2, exist and are also unique. The likelihood ratio (LR) test can be used to evaluate the assumption of a common shape parameter across data collected at different stress levels. The test statistic in this case is Λ=2(1+2c), where 1 and 2 correspond to the likelihood values acquired at stress levels 1 and 2, respectively, and c is the likelihood value achieved by fitting a model with a common shape parameter θ. The distribution of Λ is approximately chi-square with 1 degree of freedom. From the original data, we have Λ=1.283 with P-value = 0.257. This result indicates that shape parameters do not differ significantly for any significance level less than 0.257.

    Table 4.  The OLED data set, MLEs(SEs), and KS(P-value).
    Stress Failure times MLE(SE) KS(P-value)
    θ λ
    9.46 mA 0.5050, 1.5419, 1.5831, 2.3062, 2.4301, 2.8922(0.7842) 0.0540(0.0505) 0.1778(0.8569)
    2.8639, 2.9575, 3.1132, 3.6076, 3.6379
    17.09 mA 0.4591, 0.8581, 0.8925, 0.9793, 1.2915, 1.8965(0.4713) 0.2922(0.1524) 0.1698(0.8906)
    1.6036, 1.7619, 2.7852, 2.8557, 3.3995

     | Show Table
    DownLoad: CSV
    Figure 3.  Contour plot of θ and λi, i=1,2, under OLED data.

    Now, from the complete failure times at both stress levels si, i=1,2, two IAPT2C samples using mi=5, i=1,2, Ri,j=1, j=1,,mi, and some choices of Ti,1 and Ti,2, i=1,2, are generated and reported in Table 5.

    Table 5.  Improved Type-Ⅱ adaptive progressively censored samples from the OLED data.
    Stress Generated Samples Ti,1 Ti,2 Ri Ti
    9.46 mA 0.5050, 1.5831, 2.4301, 2.9575 2.5 3 3 3
    17.09 mA 0.4591, 0.8925, 1.2915, 1.6036, 1.7619 1 2 3 1.7619

     | Show Table
    DownLoad: CSV

    Using information in Table 5, the various estimations of θ, β0, β1, λu, λ1, λ2, and Ru(x0) are computed. Using the design stress level su=5 mA, the different estimates of λu and the RF (for x0=1) are obtained. Following Section 5, the first 5000 samples are removed out of 30,000 MCMC draws. Furthermore, we computed all Bayes estimates using non-informative priors. We chose to use 0.001 for all the hyper-parameters in our calculations. However, Tables 6 and 7 display the calculated classical/Bayes estimates (along their SEs) and 95% asymptotic/credible interval estimates (along their lengths) of θ, β0, β1, λu, λ1, λ2, and Ru(x0). Since Bayes' findings are calculated without any additional information, Tables 6 demonstrates the similarity between the frequentist and Bayes estimates. Additionally, BCIs of all parameters perform better than others; see Table 7. Moreover, in terms of the lowest SE and shortest interval length values, the Bayes' results reported in Tables 6 and 7 showed that Bayesian point (or credible) estimates outperformed compared to others. Some important statistics of θ, β0, β1, λu, λ1, λ2, and Ru(x0) are computed and provided in Table 8.

    Table 6.  Point estimates from OLED data.
    Par. MLE MPSE MCMC-LF MCMC-PS
    Estimate SE Estimate SE Estimate SE Estimate SE
    β0 -4.5222 1.6212 -5.9221 2.2339 -4.5198 0.0990 -4.5219 0.0991
    β1 0.1817 0.0976 0.2378 0.1231 0.1757 0.0251 0.1637 0.0340
    θ 2.2224 0.6483 2.9023 1.0272 2.2045 0.0992 2.2107 0.0990
    λu 0.0270 0.0315 0.0270 0.0448 0.0264 0.0035 0.0249 0.0043
    λ1 0.0606 0.0487 0.0606 0.0719 0.0588 0.0131 0.0530 0.0158
    λ2 0.2426 0.1299 0.2426 0.1702 0.2368 0.0930 0.1990 0.1023
    Ru(x0) 0.9734 0.0307 0.9734 0.0436 0.9739 0.0035 0.9754 0.0042

     | Show Table
    DownLoad: CSV
    Table 7.  Asymptotic/credible interval estimates under OLED data.
    Par. ACI-LF BCI-LF
    Lower Upper Length Lower Upper Length
    β0 -7.6996 -1.3448 6.3548 -4.7211 -4.3292 0.3919
    β1 -0.0095 0.3730 0.3825 0.1253 0.2199 0.0946
    θ 0.9518 3.4930 2.5412 2.0168 2.3939 0.3772
    λu 0.0000 0.0887 0.0887 0.0199 0.0337 0.0138
    λ1 0.0000 0.1560 0.1560 0.0361 0.0866 0.0505
    λ2 0.0000 0.4972 0.4972 0.0947 0.4533 0.3586
    Ru(x0) 0.9133 0.9992 0.0859 0.9669 0.9803 0.0134
    ACI-PS BCI-PS
    β0 -8.9006 -0.1439 8.7566 -4.7225 -4.3258 0.3966
    β1 -0.0596 0.4230 0.4826 0.1019 0.2157 0.1138
    θ 0.2090 4.2357 4.0267 2.0152 2.4062 0.3910
    λu 0.0000 0.0887 0.0887 0.0178 0.0328 0.0150
    λ1 0.0000 0.1560 0.1560 0.0290 0.0827 0.0536
    λ2 0.0000 0.4972 0.4972 0.0635 0.4219 0.3584
    Ru(x0) 0.8880 0.9881 0.1001 0.9677 0.9823 0.0146

     | Show Table
    DownLoad: CSV
    Table 8.  Vital statistics of MCMC draws under OLED data.
    Par. Mean Median Mode St.D Skewness
    MCMC-LF
    β0 -4.5198 -4.5198 -4.3307 0.0990 -0.0156
    β1 0.1757 0.1773 0.1714 0.0243 -0.2656
    θ 2.2045 2.2043 2.0920 0.0976 -0.0092
    λu 0.0264 0.0263 0.0310 0.0035 0.2271
    λ1 0.0588 0.0579 0.0666 0.0129 0.3917
    λ2 0.2368 0.2249 0.2463 0.0929 0.8489
    Ru(x0) 0.9739 0.9740 0.9695 0.0034 -0.2163
    MCMC-PS
    β0 -4.5219 -4.5223 -4.5344 0.0991 -0.0295
    β1 0.1637 0.1656 0.1800 0.0289 -0.3703
    θ 2.2107 2.2096 2.1644 0.0983 -0.0004
    λu 0.0249 0.0248 0.0264 0.0038 0.2006
    λ1 0.0530 0.0520 0.0589 0.0138 0.4247
    λ2 0.1990 0.1839 0.2326 0.0926 0.9968
    Ru(x0) 0.9754 0.9755 0.9739 0.0037 -0.1894

     | Show Table
    DownLoad: CSV

    Furthermore, to show the convergence of drawn samples from both types of 25,000 MCMC variates, the trace and marginal density plots (with their histograms using the Gaussian kernel) of θ, β0, β1, λu, λ1, λ2, and Ru(x0) are displayed in Figure 4. In each trace (or density) plot, the Bayes estimate of each subject is displayed as a horizontal solid line, while its BCI limits are represented with horizontal dotted lines. It indicates that all the generated samples collected from the MCMC-LF (or MCMC-PS) sampler converged satisfactorily. Furthermore, Figure 4 shows that the generated variates of θ and β0 are fairly symmetric, those of β1 and Ru(x0) are negatively skewed, while those of λu, λ1 and λ2 are positively skewed. Also, Figure 4 supports our numerical findings presented in Table 8. In Figure 5, based on both stress (9.46 mA and 17.09 mA) data, the plots of fitted and empirical RFs of the Weibull life distribution using the proposed methodologies are provided.

    Figure 4.  Density (left) and histograms (right) for MCMC-LF and -PS drawn from OLED data.
    Figure 5.  The fitted Weibull RFs from OLED data.

    This application considers an engineering data set to examine the practical utility of the proposed methodologies. This data demonstrates the operational lifespan (in hours) of a pump motor. It was originally reported by the ReliaSoft website (http://www.reliasoft.com/newsletter/1q2002/qalt.htm) and later analyzed by Dey and Nassar [9]. The data were obtained based on two specified stress levels of the liquid density, namely s1=1.0 g/mL and s2=1.4 g/mL, where the failure times at each stress level are recorded. For computational convenience, we simplified the numbers by subtracting 500 from each data point and then dividing the result by 1000. This subtraction is done for computational purposes, because dealing with the same actual time points for the pump motor is not appropriate. The transformed data values are listed in Table 9.

    Table 9.  Summary fitting under pump motor data.
    Stress Failure times MLE(SE) KS(P-value)
    θ λ
    1.0 g/mL 0.92 1.36 1.79 1.90 2.38 5.1812(1.3639) 0.0143(0.0176) 0.3223(0.2499)
    2.40 2.50 2.50 2.50 2.50
    1.4 g/mL 0.400 0.630 0.700 0.895 1.160 2.3305(0.5921) 0.4592(0.2015) 0.1896(0.8015)
    1.180 1.330 1.960 1.990 2.080

     | Show Table
    DownLoad: CSV

    Table 9 provides evidence that the Weibull model fits the pump motor data sets well. Contour plots, based on two stress levels, are plotted in Figure 6. It indicates that the MLEs ˆθ and ˆλi, i=1,2, exist and are also unique. Using the LR test, we compute Λ=4.179 with P-value=0.041. This finding indicates that the shape parameters do not differ significantly at any significance level lower than 0.041. Although the P-value is small, we can continue our analysis by assuming common shape parameters, especially for illustration purposes, taking into account the lack of available data sets in the literature.

    Figure 6.  Contour plot of θ and λi, i=1,2, under pump motor data.

    Using mi=5, i=1,2, and Ri,j=1, j=1,,mi, two IAPT2C samples, for various choices of (Ti,1,Ti,1), i=1,2, are gathered; see Table 10. The calculated estimates of θ, β0, β1, λu, λ1, λ2 and Ru(x0), based on the data sets reported in Table 10, are obtained. Also, by running the MCMC algorithm 30,000 times (when M=5000), using non-informative priors, the Bayesian calculations of the considered parameters are developed. The estimated RF (for x0=1) using both classical and Bayes methods, when the normal stress level su is taken as 0.75 g/mL, is obtained. All point and interval estimates of θ, β0, β1, λu, λ1, λ2 and Ru(x0) are presented in Tables 11 and 12, respectively. These tables showed that Bayesian point (or interval) estimates perform better than other frequentist point (or interval) results in terms of minimum SEs and interval lengths. Several statistics for MCMC posterior distributions of θ, β0, β1, λu, λ1, λ2 and Ru(x0) are also computed; see Table 13. In this table, the statistics MCMC drawn based on LF and PS approaches are listed in the first and second rows, respectively.

    Table 10.  Improved Type-Ⅱ adaptive progressively censored samples from the pump motor data.
    Stress Generated Samples T1 T2 Ri Ti
    1.0 g/mL 0.92 1.79 2.38 2.40 2.50 2(2) 2.6 3 2.5
    1.4 g/mL 0.92 1.79 1.90 2.38 1(1) 2.4 5 2.4

     | Show Table
    DownLoad: CSV
    Table 11.  Point estimates from pump motor data.
    Par. MLE MPSE MCMC-LF MCMC-PS
    Estimate SE Estimate SE Estimate SE Estimate SE
    β0 -3.1106 2.2293 -4.7027 3.0325 -4.4493 0.1225 -4.4678 0.1126
    β1 -0.4820 1.6496 -0.5106 1.9164 0.2194 0.1082 0.1993 0.1038
    θ 3.6623 1.1021 5.3652 2.0576 2.2777 0.1131 2.2636 0.1076
    λu 0.0125 0.0336 0.0125 0.0557 0.0139 0.0132 0.0134 0.0136
    λ1 0.0130 0.0636 0.0130 0.1141 0.0147 0.0460 0.0141 0.0465
    λ2 0.0140 0.2516 0.0140 0.4432 0.0161 0.2265 0.0154 0.2272
    Ru(x0) 0.9734 0.0151 0.9734 0.0250 0.9862 0.0129 0.9867 0.0134

     | Show Table
    DownLoad: CSV
    Table 12.  Asymptotic/credible interval estimates under pump motor data.
    Par. ACI-LF BCI-LF
    Lower Upper Length Lower Upper Length
    β0 -8.8916 -0.1528 8.7388 -4.6433 -4.2662 0.3771
    β1 -3.0513 3.4148 6.4661 0.0241 0.4259 0.4018
    θ 0.0624 4.3824 4.3200 2.0826 2.4716 0.3890
    λu 0.0000 0.0929 0.0929 0.0108 0.0176 0.0068
    λ1 0.0000 0.1853 0.1853 0.0110 0.0192 0.0082
    λ2 0.0000 0.7357 0.7357 0.0114 0.0222 0.0108
    Ru(x0) 0.9438 0.9993 0.0555 0.9826 0.9893 0.0067
    ACI-PS BCI-PS
    β0 -10.466 1.4214 11.887 -4.6631 -4.2771 0.3860
    β1 -3.5743 3.9378 7.5121 0.0092 0.4035 0.3943
    θ 0.0000 6.2551 6.2551 2.0711 2.4632 0.3921
    λu 0.0000 0.1361 0.1361 0.0105 0.0171 0.0066
    λ1 0.0000 0.2843 0.2843 0.0107 0.0186 0.0079
    λ2 0.0000 1.1112 1.1112 0.0110 0.0215 0.0105
    Ru(x0) 0.9243 0.9987 0.0744 0.9831 0.9896 0.0065

     | Show Table
    DownLoad: CSV
    Table 13.  Vital statistics of MCMC drawn under pump motor data.
    Par. Mean Median Mode St.D Skewness
    MCMC-LF
    β0 -4.4493 -4.4503 -4.3087 0.0984 -0.0465
    β1 0.2194 0.2186 0.3569 0.1014 0.1050
    θ 2.2777 2.2782 2.4168 0.0986 -0.0280
    λu 0.0139 0.0138 0.0176 0.0017 0.3207
    λ1 0.0147 0.0146 0.0192 0.0021 0.3821
    λ2 0.0161 0.0159 0.0222 0.0028 0.4873
    Ru(x0) 0.9862 0.9863 0.9826 0.0017 -0.3157
    MCMC-PS
    β0 -4.4678 -4.4681 -4.3706 0.0986 -0.0195
    β1 0.1993 0.1982 0.0003 0.1023 0.1723
    θ 2.2636 2.2627 2.3650 0.0994 0.0827
    λu 0.0134 0.0133 0.0126 0.0017 0.4300
    λ1 0.0141 0.0139 0.0126 0.0020 0.5062
    λ2 0.0154 0.0151 0.0126 0.0027 0.6213
    Ru(x0) 0.9867 0.9868 0.9874 0.0016 -0.4247

     | Show Table
    DownLoad: CSV

    The density and histogram plots of θ, β0, β1, λu, λ1, λ2 and Ru(x0) from MCMC-LF and MCMC-PS approaches are displayed in Figure 7. It represents that the offered MCMC-LF (or MCMC-PS) sampler converges adequately. It is also noted, for both MCMC-LF and -PS approaches, that variates of θ, β0, β1 are fairly symmetric; the generated posterior estimates of λu, λ1, λ2 are positively skewed, while the generated posterior estimates of Ru(x0) are negatively skewed. Figure 8 shows the plots of fitted and empirical RFs (for 1.0 g/mL and 1.4 g/mL data sets) using the computed estimates based on each considered method.

    Figure 7.  Density (left) and histograms (right) for MCMC-LF and -PS drawn from pump motor data.
    Figure 8.  The fitted Weibull RFs from pump motor data.

    In this paper, through a constant-stress accelerated life test model based on improved Type-Ⅱ adaptive progressive censoring, various estimation challenges for the Weibull parameters of lifetime have been investigated. Assuming a log-linear acceleration model, different point estimations of the Weibull's parameters and its reliability at normal use conditions have been studied using two classical methods, namely the maximum likelihood and the maximum product of spacings approaches. The approximate confidence intervals of all unknown subjects have been obtained using the asymptotic properties of the two frequentist estimation methods. Also, Bayesian point and interval estimators have been studied using both likelihood and the product of spacings functions. It has been observed that Bayes' results cannot be acquired in explicit expressions; therefore, the Metropolis–Hastings technique has been employed to get the required estimates. To highlight the behavior of the various estimates proposed in this study, a wide simulation comparison has been implemented. Additionally, two actual sets of data were used to show how the different approaches can be used. These applications support the numerical findings of the proposed estimators obtained from simulation studies in terms of the estimated standard errors. Generally, Bayes' setup using the likelihood function has been recommended to evaluate the shape parameter and reliability function under normal use conditions, while Bayes estimates using the product of spacings function have also been recommended to evaluate the scale parameters, which behave well compared with their counterparts. For future work, it is of interest to investigate the estimation methods for Weibull distribution using other kinds of accelerated life tests, for example, step-stress-accelerated life tests using improved Type-Ⅱ adaptive progressive censoring data

    Mazen Nassar: Conceptualization, Methodology, Investigation, Writing-review & editing; Refah Alotaibi: Methodology, Investigation, Funding acquisition, Writing-original draft; Ahmed Elshahhat: Methodology, Software, Data curation, Writing-original draft. All authors have read and approved the final version of the manuscript for publication.

    The authors declare they have not used Artificial Intelligence (AI) tools in the creation of this article.

    The authors would like to express their gratitude to the editor and the five anonymous referees for their helpful suggestions and valuable comments. This research was funded by Princess Nourah bint Abdulrahman University Researchers Supporting Project number (PNURSP2024R50), Princess Nourah bint Abdulrahman University, Riyadh, Saudi Arabia.

    There is no conflict of interest.


    [1] Assessment and Reporting Authority (ACARA), Australian Curriculum: Mathematics Year 4. 2021. https://www.australiancurriculum.edu.au/f-10-curriculum/mathematics/
    [2] Mental arithmetic and strategy use with indirect number problems up to one hundred. Learning and Instruction (1997) 7: 87-106.
    [3] (1993) Mathemagics: How to look like a genius without really trying. Chicago, IL: Contemporary Books.
    [4] The exemplar methodology: An approach to studying the leading edge of development. Psychology of Well-Being: Theory, Research and Practice (2012) 2: 5.
    [5] (1999) Philosophy of mathematics: The world of proofs and pictures. New York: Routledge.
    [6] (2007) The Science of Leonardo. New York, NY: DoubleDay Press.
    [7] Pictures and proofs. Notices of the AMS (2000) 47: 1257-1266.
    [8] Common Core State Standards Initiative, Grade 4, Number & Operations in Base Ten. 2021. http://www.corestandards.org/Math/Content/4/NBT/
    [9] (1998) The foundations of social research: meaning and perspective in the research process. London: SAGE.
    [10] Da Vinci, Leonardo, Codex Atlanticus. 1478-1519, Milan: Biblioteca Ambrosiana. https://www.codex-atlanticus.it/#/Detail?detail=820
    [11] (2007) Codex Madrid II. Madrid: Biblioteca Nacional 1503. http://leonardo.bne.es/index.html
    [12] Da Vinci, Leonardo, Studies of geometry. RCIN 919145, 1509, Windsor, UK: Royal Collection Trust. https://www.rct.uk/collection/search#/12/collection/919145/studies-of-geometry
    [13] Day A. L., Case Study Research, in Research Methods & Methodologies in Education, 2nd ed. R. Coe, M. Waring, L.V. Hedges & J. Arthur Ed. 2017, pp. 114-121. Los Angeles, CA: SAGE.
    [14] Department for Education, National curriculum in England: mathematics programmes of study. 2021. https://www.gov.uk/government/publications/national-curriculum-in-england-mathematics-programmes-of-study/national-curriculum-in-england-mathematics-programmes-of-study
    [15] (1993) Dead Reckoning: Calculating Without Instruments. Houston TX: Gulf Publishing Company.
    [16] (2005) Individual differences in arithmetic: Implications for psychology, neuroscience, and education. New York: Psychology Press.
    [17] Associating mathematics to its history: Connecting the mathematics we teach to its past. Transformations (2016) 2: Article 2. https://nsuworks.nova.edu/transformations/vol2/iss2/2
    [18] (2007) Visual thinking in mathematics. Oxford: Oxford Univ. Press.
    [19] An example of using history of mathematics in classes. European Journal of Science and Mathematics Education (2013) 1: 125-136.
    [20] (2000) Speed mathematics: Secret skills for quick calculation. Hoboken, NJ: John Wiley & Sons.
    [21] (2005) Speed maths for kids. Milton, Qld: John Wiley & Sons..
    [22] Visualisation and proof: a brief survey of philosophical Perspectives. ZDM Mathematics Education (2007) 39: 73-78.
    [23] Hatano, G., Foreword, in A The development of arithmetic concepts and skills: Constructing adaptive expertise. J. Baroody & A. Dowker Ed. 2003, pp. xi-xiii. Mahwah: Lawrence Erlbaum Associates. DOI: 10.4324/9781410607218
    [24] (2019) The Innovators Behind Leonardo. Cham, Switzerland: Springer International Publishing.
    [25] Teaching and Learning Two-Digit Multiplication: Coordinating Analyses of Classroom Practices and Individual Student Learning. Mathematical Thinking and Learning (2004) 6: 37-79.
    [26] Jahnke, H.N., The use of original sources in the mathematics classroom, in History in mathematics education, the ICMI study. J. Fauvel & J. van Maanen Ed. 2000, pp. 291-328. Dordrecht: Kluwer Academic.
    [27] A categorization of the pwhysq and phowsq of using history in mathematics education. Educ Stud Math (2009) 71: 235-261.
    [28] (2006) Leonardo da Vinci: Experience, Experiment, and Design. Princeton NJ: Princeton University Press.
    [29] The Symbolic and Mathematical Influence of Diophantus's Arithmetica. Journal of Humanistic Mathematics (2015) 5: 139-166.
    [30] Exploring studentso strategies in area conservation geometrical tasks. Educ Stud Math (2011) 77: 105-127.
    [31] Larsson, K., Connections for learning multiplication, in Proceedings from Symposium Elementary Mathematics Education: Developing mathematical language and reasoning. J. Novotná & H. Moraová Ed, 2015, pp. 202-211. Prague: Charles University, Faculty of Education
    [32] Studentso conceptualisations of multiplication as repeated addition or equal groups in relation to multi-digit and decimal numbers. The Journal of Mathematical Behavior (2017) 48: 1-13.
    [33] (1953) A Mathematicianos Miscellany. London: Methuen & Co. Ltd..
    [34] The Role of History in a Mathematics Class. Mathematics Teacher (2000) 93: 704-706.
    [35] A proposed framework for examining basic number sense. For the Learning of Mathematics (1992) 12: 2-44.
    [36] Mental Calculation World Cup, 2021. https://en.wikipedia.org/wiki/Mental_Calculation_World_Cup
    [37] The experience of history in mathematics education. For the Learning of Mathematics (1991) 11: 7-16.
    [38] Learning multiplication: An integrated analysis of the multiplication ability of primary school children and the difficulty of single digit and multidigit multiplication problems. Learning and Individual Differences (2015) 43: 48-62.
    [39] Santhamma, C., Vedic mathematics. lecture notes 1 - multiplication. 2021. Retrieved from http://mathlearners.com/vedic-mathematics/multiplication-in-vedic-mathematics/
    [40] Siu, M. -K., The ABCD of using history of mathematics in the (undergraduate) classroom, in Using history to teach mathematics—an international perspective, V. Katz Ed. MAA notes, 2000, 51: 3-9. Washington, DC: The Mathematical Association of America.
    [41] (1983) The Great Mental Calculators: The Psychology, Methods, and Lives of Calculating Prodigies Past and Present. New York: Columbia Univ Press.
    [42] (1990) Mathematical knowledge of Japanese, Chinese, and American elementary school children. Reston, VA: National Council of Teachers of Mathematics.
    [43] Swetz, F., Using problems from the history of mathematics in classroom instruction, in Learn from the masters, F. Swetz, J. Fauvel, O. Bekken, B. Johansson & V. Katz Eds. 1995, pp. 25- 38. Washington, DC: The Mathematical Association of America.
    [44] Swetz, F., Problem solving from the history of mathematics, in Using history to teach mathematics—an international perspective. V. Katz Ed. MAA notes, 2000, 51, pp. 59-65. Washington, DC: The Mathematical Association of America.
    [45] (2017) How to Do Your Research Project: A Guide for Students.. London: SAGE Publications Ltd..
    [46] Schoenfeld's problem-solving models viewed through the lens of exemplification. For the Learning of Mathematics (2019) 39: 24-26.
    [47] Tic-Tac-Toe and repeated integration by parts: alternative pedagogical perspectives to Lima's integral challenge. International Journal of Mathematical Education in Science and Technology (2020) 51: 424-430.
    [48] Why do nfasto multiplication algorithms work? Opportunities for understanding within younger children via geometric pedagogy. International Journal of Mathematical Education in Science and Technology (2021) 52: 527-549.
    [49] (1983) The visual display of quantitative information. Cheshire, CT: Graphic Press.
    [50] Tzanakis, C. and Arcavi, A., Integrating history of mathematics in the classroom: An analytic survey, in History in mathematics education. J. Fauvel & J. van Maanen Ed. 2000, pp. 201-240. The ICMI Study. Dordrecht: Kluwer Academic Publishers.
    [51] Verschaffel, L., Greer, B. and De Corte, E., Whole number concepts and operations, in Second handbook of research on mathematics teaching and learning. F.K. Lester Jr Ed. 2007, pp. 557-628. Charlotte, NC: Information Age Publishing Inc
    [52] West, L., An Introduction to Various Multiplication Strategies. Thesis, 2011, Lincoln, NE: University of Nebraska at Lincoln.
  • This article has been cited by:

    1. Refah Alotaibi, Mazen Nassar, Zareen A. Khan, Wejdan Ali Alajlan, Ahmed Elshahhat, Analysis and data modelling of electrical appliances and radiation dose from an adaptive progressive censored XGamma competing risk model, 2025, 18, 16878507, 101188, 10.1016/j.jrras.2024.101188
  • Reader Comments
  • © 2021 the Author(s), licensee AIMS Press. This is an open access article distributed under the terms of the Creative Commons Attribution License (http://creativecommons.org/licenses/by/4.0)
通讯作者: 陈斌, bchen63@163.com
  • 1. 

    沈阳化工大学材料科学与工程学院 沈阳 110142

  1. 本站搜索
  2. 百度学术搜索
  3. 万方数据库搜索
  4. CNKI搜索

Metrics

Article views(2096) PDF downloads(272) Cited by(0)

Other Articles By Authors

/

DownLoad:  Full-Size Img  PowerPoint
Return
Return

Catalog