Stigmatization of persons living with obesity is an important public health issue. In 2015, Obesity Canada adopted person-first language in all internal documentation produced by the organization, and, from 2017, required all authors to use person-first language in abstract submissions to Obesity Canada hosted conferences. The impact of this intentional shift in strategic focus is not known. Therefore, the aim of this study was to conduct a content analysis of proceedings at conferences hosted by Obesity Canada to identify whether or how constructs related to weight bias and obesity stigma have changed over time.
Of 1790 abstracts accepted to conferences between 2008–2019, we excluded 353 abstracts that featured animal or cellular models, leaving 1437 abstracts that were reviewed for the presence of five constructs of interest and if they changed over time: 1) use of person-first versus use of disease-first terminology, 2) incorporation of lived experience of obesity, 3) weight bias and stigma, 4) aggressive or alarmist framing and 5) obesity framed as a modifiable risk factor versus as a disease. We calculated and analyzed through linear regression: 1) the overall frequency of use of each construct over time as a proportion of the total number of abstracts reviewed, and 2) the ratio of abstracts where the construct appeared at least once based on the total number of abstracts.
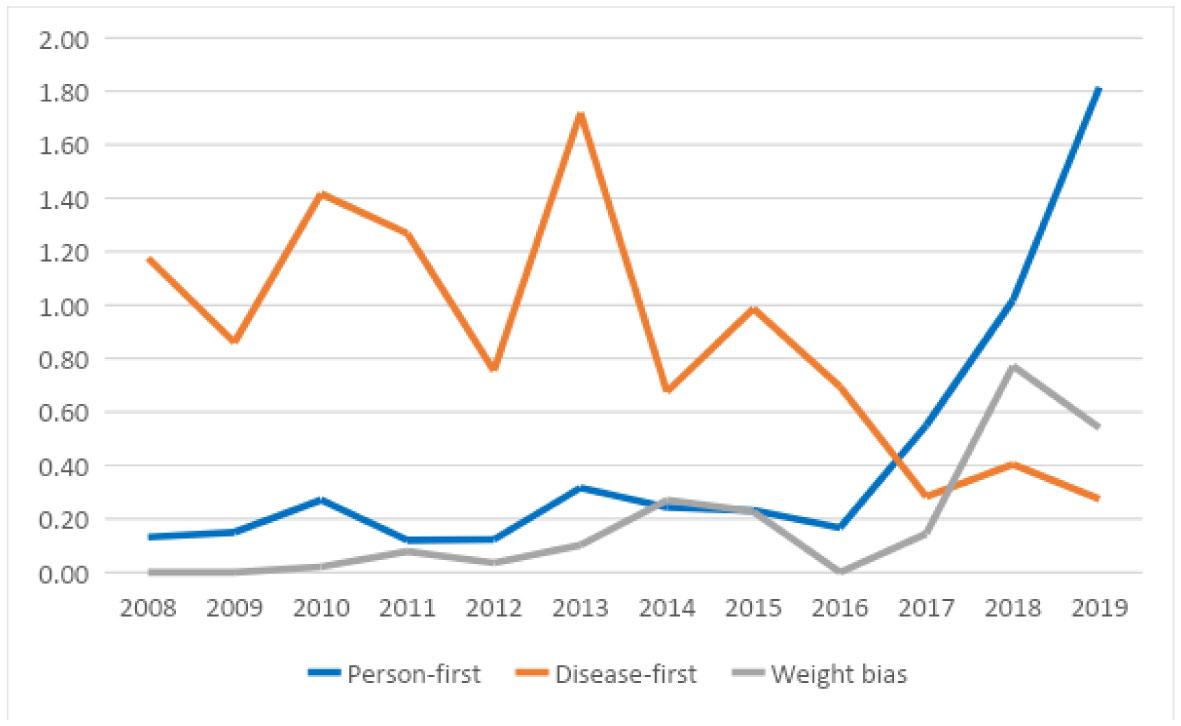
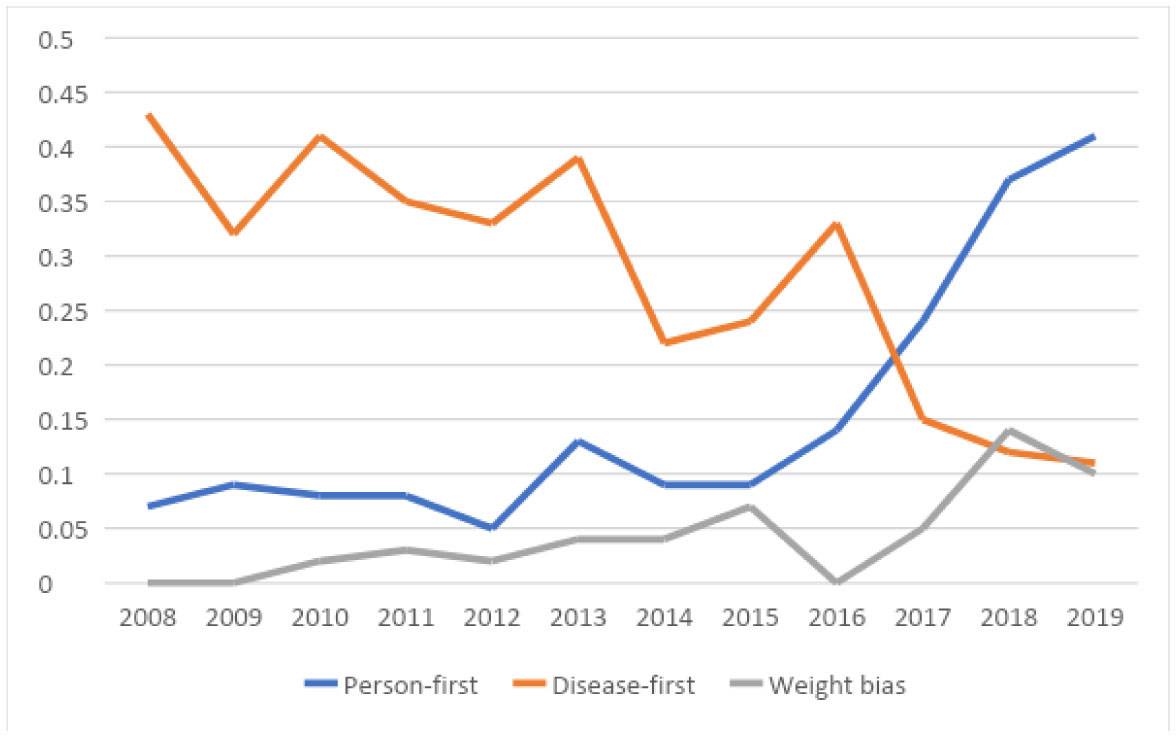
We found a significant positive correlation between use of person-first language in abstracts and time (R2 = 0.51, p < 0.01 for frequency, R2 = 0.65, p < 0.05 for ratio) and a corresponding negative correlation for the use of disease-first terminology (R2 = 0.48, p = 0.01 for frequency, R2 = 0.75, p < 0.001 for ratio). There was a significant positive correlation between mentions of weight bias and time (R2 = 0.53 and 0.57, p < 0.01 for frequency and ratio respectively).
Use of person-first language and attention to weight bias increased, while disease-first terminology decreased in accepted abstracts over the past 11 years since Obesity Canada began hosting conferences and particularly since more explicit actions for expectations to use person-first language were put in place in 2015 and 2017.
Citation: Sara FL Kirk, Mary Forhan, Joshua Yusuf, Ashly Chance, Kathleen Burke, Nicole Blinn, Stephanie Quirke, Ximena Ramos Salas, Angela Alberga, Shelly Russell-Mayhew. Mapping changes in the obesity stigma discourse through Obesity Canada: a content analysis[J]. AIMS Public Health, 2022, 9(1): 41-52. doi: 10.3934/publichealth.2022004
Stigmatization of persons living with obesity is an important public health issue. In 2015, Obesity Canada adopted person-first language in all internal documentation produced by the organization, and, from 2017, required all authors to use person-first language in abstract submissions to Obesity Canada hosted conferences. The impact of this intentional shift in strategic focus is not known. Therefore, the aim of this study was to conduct a content analysis of proceedings at conferences hosted by Obesity Canada to identify whether or how constructs related to weight bias and obesity stigma have changed over time.
Of 1790 abstracts accepted to conferences between 2008–2019, we excluded 353 abstracts that featured animal or cellular models, leaving 1437 abstracts that were reviewed for the presence of five constructs of interest and if they changed over time: 1) use of person-first versus use of disease-first terminology, 2) incorporation of lived experience of obesity, 3) weight bias and stigma, 4) aggressive or alarmist framing and 5) obesity framed as a modifiable risk factor versus as a disease. We calculated and analyzed through linear regression: 1) the overall frequency of use of each construct over time as a proportion of the total number of abstracts reviewed, and 2) the ratio of abstracts where the construct appeared at least once based on the total number of abstracts.
We found a significant positive correlation between use of person-first language in abstracts and time (R2 = 0.51, p < 0.01 for frequency, R2 = 0.65, p < 0.05 for ratio) and a corresponding negative correlation for the use of disease-first terminology (R2 = 0.48, p = 0.01 for frequency, R2 = 0.75, p < 0.001 for ratio). There was a significant positive correlation between mentions of weight bias and time (R2 = 0.53 and 0.57, p < 0.01 for frequency and ratio respectively).
Use of person-first language and attention to weight bias increased, while disease-first terminology decreased in accepted abstracts over the past 11 years since Obesity Canada began hosting conferences and particularly since more explicit actions for expectations to use person-first language were put in place in 2015 and 2017.

| [1] | The Lancet Public Health (2019) Addressing weight stigma. Lancet Public Health 4: e168. |
| [2] |
Alberga AS, Pickering BJ, Alix Hayden K, et al. (2016) Weight bias reduction in health professionals: a systematic review. Clin Obes 6: 175-188. doi: 10.1111/cob.12147

|
| [3] |
Nutter S, Russell-Mayhew S, Alberga AS, et al. (2016) Positioning of weight bias: moving towards social justice. J Obes 2016: 1-10. doi: 10.1155/2016/3753650
|
| [4] |
Teachman B, Brownell K (2001) Implicit anti-fat bias among health professionals: is anyone immune? Int J Obes Relat Metab Disord 25: 1525-1531. doi: 10.1038/sj.ijo.0801745
|
| [5] |
Hayward LE, Vartanian LR, Pinkus RT (2018) Weight stigma predicts poorer psychological well-being through internalized weight bias and maladaptive coping responses. Obesity 26: 755-761. doi: 10.1002/oby.22126
|
| [6] |
Jackson SE, Steptoe A (2018) Obesity, perceived weight discrimination, and hair cortisol: a population-based study. Psychoneuroendocrinology 98: 67-73. doi: 10.1016/j.psyneuen.2018.08.018
|
| [7] |
Major B, Hunger JM, Bunyan DP, et al. (2014) The ironic effects of weight stigma. J Exp Soc Psychol 51: 74-80. doi: 10.1016/j.jesp.2013.11.009
|
| [8] |
Tomiyama AJ, Carr D, Granberg EM, et al. (2018) How and why weight stigma drives the obesity ‘epidemic’ and harms health. BMC Med 16: 123. doi: 10.1186/s12916-018-1116-5
|
| [9] |
Sutin AR, Stephan Y, Terracciano A (2015) Weight discrimination and risk of mortality. Psychol Sci 26: 1803-1811. doi: 10.1177/0956797615601103
|
| [10] | Government of Canada Addressing stigma: towards a more inclusive health system, 2020 Available from: https://www.canada.ca/en/public-health/corporate/publications/chief-public-health-officer-reports-state-public-health-canada/addressing-stigma-toward-more-inclusive-health-system.html. |
| [11] |
Rubino F, Puhl RM, Cummings DE, et al. (2020) Joint international consensus statement for ending stigma of obesity. Nat Med 26: 485-97. doi: 10.1038/s41591-020-0803-x
|
| [12] |
Ramos Salas X, Alberga AS, Cameron E, et al. (2017) Addressing weight bias and discrimination: moving beyond raising awareness to creating change. Obes Rev 18: 1323-1335. doi: 10.1111/obr.12592
|
| [13] |
Sharma AM, Ramos Salas X (2018) Obesity prevention and management strategies in Canada: shifting paradigms and putting people first. Curr Obes Rep 7: 89-96. doi: 10.1007/s13679-018-0309-8
|
| [14] |
Alberga AS, Russell-Mayhew S, von Ranson KM, et al. (2016) Future research in weight bias: what next? Obesity 24: 1207-1209. doi: 10.1002/oby.21480
|
| [15] | Obesity Canada Person first language, 2019 Available from: http://obesitycanada.ca/wp-content/uploads/2019/12/Weight-Bias-Person-First-Language_Brief.docx.pdf. |
| [16] |
Heuer CA, McClure KJ, Puhl RM (2011) Obesity stigma in online news: a visual content analysis. J Health Commun 16: 976-987. doi: 10.1080/10810730.2011.561915
|
| [17] |
Alberga AS, McLaren L, Russell-Mayhew S, et al. (2018) Canadian senate report on obesity: focusing on individual behaviours versus social determinants of health may promote weight stigma. J Obes 2018: 8645694. doi: 10.1155/2018/8645694
|
| [18] |
Elo S, Kyngäs H (2008) The qualitative content analysis process. J Adv Nurs 62: 107-115. doi: 10.1111/j.1365-2648.2007.04569.x
|
| [19] |
Puhl R, Peterson JL, Luedicke J (2013) Motivating or stigmatizing? Public perceptions of weight-related language used by health providers. Int J Obes 37: 612-619. doi: 10.1038/ijo.2012.110
|
| [20] |
Moone RP, Cagle JG (2009) A content analysis of aging network conference proceedings. Educ Gerontol 37: 995-1008. doi: 10.1080/03601277.2010.495557
|
| [21] |
Greve Spees JM, Zimmerman TS (2003) Gender messages in parenting magazines: a content analysis. J Fem Fam Ther 14: 73-100. doi: 10.1300/J086v14n03_05
|
| [22] |
Roberts M, Pettigrew S (2007) A thematic content analysis of children's food advertising. Int J Advert 26: 357-367. doi: 10.1080/02650487.2007.11073018
|
| [23] |
Morris ZS, Wooding S, Grant J (2011) The answer is 17 years, what is the question: understanding time lags in translational research. J R Soc Med 104: 510-520. doi: 10.1258/jrsm.2011.110180
|
| [24] |
Hatzenbuehler ML, Phelan JC, Link BG (2013) Stigma as a fundamental cause of population health inequalities. Am J Public Health 103: 813-821. doi: 10.2105/AJPH.2012.301069
|
| [25] |
Ramos Salas X, Forhan M, Caulfield T, et al. (2019) Addressing internalized weight bias and changing damaged social identities for people living with obesity. Front Psychol 10: 1409. doi: 10.3389/fpsyg.2019.01409
|
| [26] |
Wharton S, Lau DCW, Vallis M, et al. (2020) Obesity in adults: a clinical practice guideline. CMAJ 192: E875-E891. doi: 10.1503/cmaj.191707
|
| [27] | Obesity Canada Canadian Obesity Advocacy Network Available from: https://obesitycanada.ca/coan/. |
| [28] |
MacInnis CC, Alberga AS, Nutter S, et al. (2020) Regarding obesity as a disease is associated with lower weight bias among physicians: a cross-sectional survey study. Stigma Health 5: 114-122. doi: 10.1037/sah0000180
|
| [29] |
Nutter S, Alberga AS, MacInnis C, et al. (2018) Framing obesity a disease: indirect effects of affect and controllability beliefs on weight bias. Int J Obes 42: 1804-1811. doi: 10.1038/s41366-018-0110-5
|
Figures(2) / Tables(3)

Sara FL Kirk, Mary Forhan, Joshua Yusuf, Ashly Chance, Kathleen Burke, Nicole Blinn, Stephanie Quirke, Ximena Ramos Salas, Angela Alberga, Shelly Russell-Mayhew. Mapping changes in the obesity stigma discourse through Obesity Canada: a content analysis[J]. AIMS Public Health, 2022, 9(1): 41-52. doi: 10.3934/publichealth.2022004


 DownLoad: