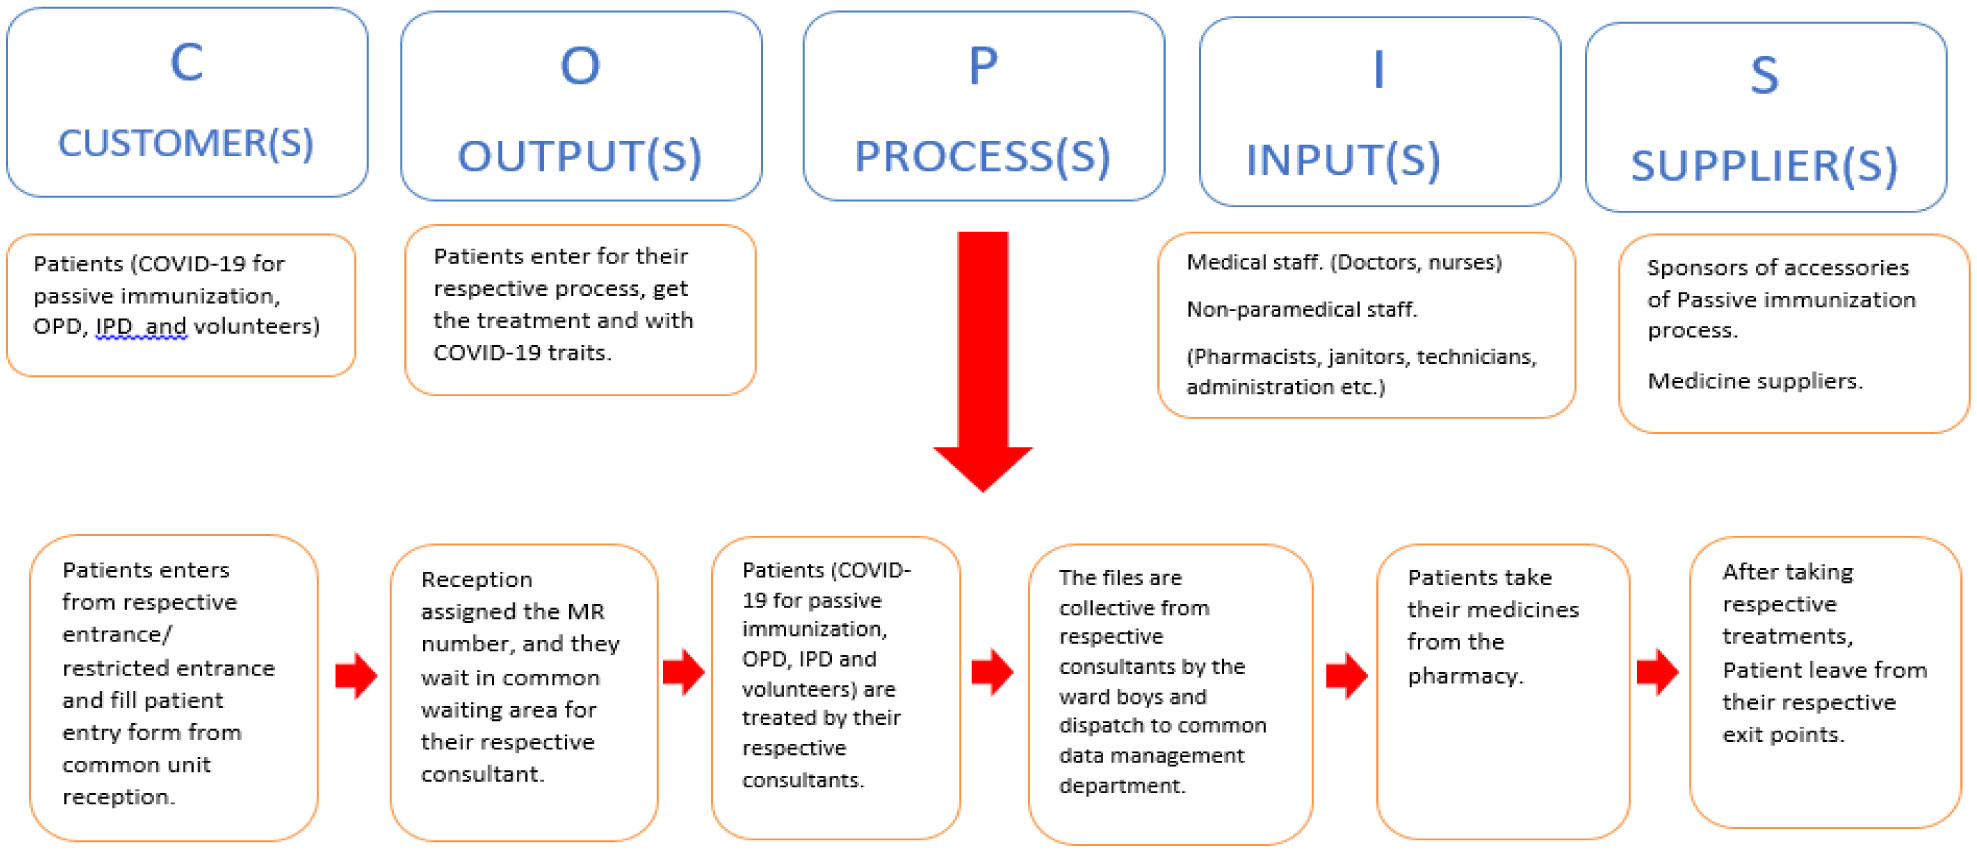
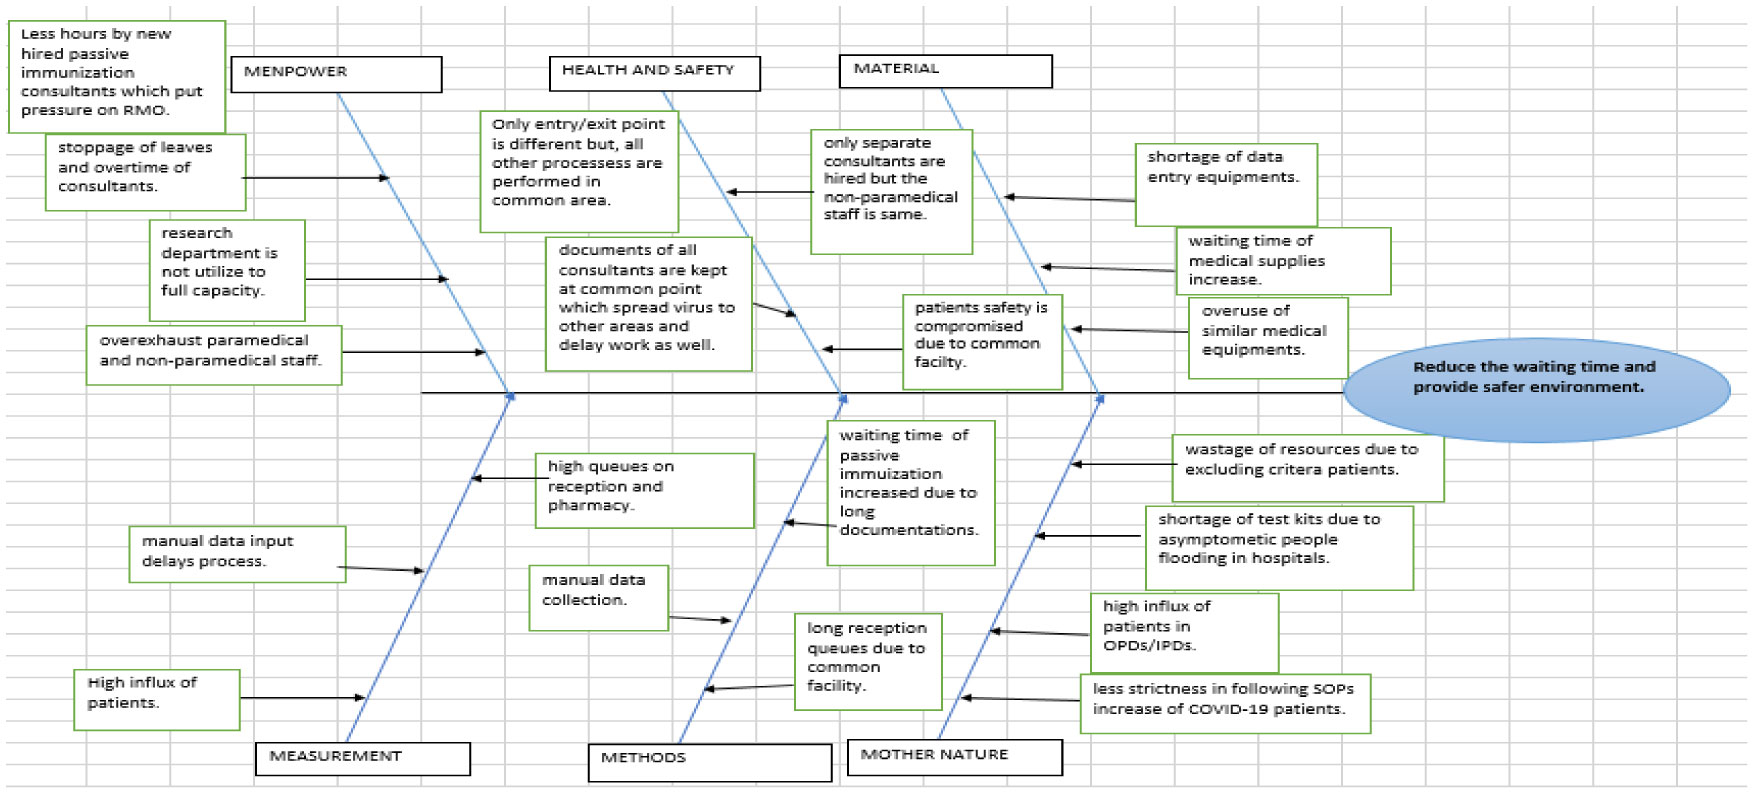
The recent outbreak of coronavirus (COVID-19) pandemic has exposed the weakness of the existing healthcare facilities in developing countries, and Pakistan has no exception. The increasing amount of patients has made this condition more vulnerable to failure. It became difficult for health care management to handle the surge of patients. This case study is based on the XYZ hospital system of Pakistan. The hospital initiates passive immunization as a savior in the absence of a vaccine. The process initiates numerous challenges as the same facility was using for passive immunization and routine operations of the hospital. DMAIC lean sig-sigma problem-solving methodology has been adopted to Define, Measure, Analyze, Implement and Control the improvement process for smooth special and routine activities. The staff and patients were interviewed, their issues were listed, and a comprehensive solution was suggested to deal with operational uncertainties. The results identified various factors through VOC and SIPOC processes, prioritized using fishbone diagram, analyzed through Kano model, and finally proposed process improvement by incorporating Kaizen process improvement methodology. Other industries could use this set of tools to evaluate and optimize routine problems, which ultimately enhances the quality and reduces cost.
Citation: Muhammad Mutasim Billah Tufail, Muhammad Shakeel, Faheem Sheikh, Nuzhat Anjum. Implementation of lean Six-Sigma project in enhancing health care service quality during COVID-19 pandemic[J]. AIMS Public Health, 2021, 8(4): 704-719. doi: 10.3934/publichealth.2021056
The recent outbreak of coronavirus (COVID-19) pandemic has exposed the weakness of the existing healthcare facilities in developing countries, and Pakistan has no exception. The increasing amount of patients has made this condition more vulnerable to failure. It became difficult for health care management to handle the surge of patients. This case study is based on the XYZ hospital system of Pakistan. The hospital initiates passive immunization as a savior in the absence of a vaccine. The process initiates numerous challenges as the same facility was using for passive immunization and routine operations of the hospital. DMAIC lean sig-sigma problem-solving methodology has been adopted to Define, Measure, Analyze, Implement and Control the improvement process for smooth special and routine activities. The staff and patients were interviewed, their issues were listed, and a comprehensive solution was suggested to deal with operational uncertainties. The results identified various factors through VOC and SIPOC processes, prioritized using fishbone diagram, analyzed through Kano model, and finally proposed process improvement by incorporating Kaizen process improvement methodology. Other industries could use this set of tools to evaluate and optimize routine problems, which ultimately enhances the quality and reduces cost.

| [1] |
Lai CC, Shih TP, Ko WC, et al. (2020) Severe acute respiratory syndrome coronavirus 2 (SARS-CoV-2) and coronavirus disease-2019 (COVID-19): The epidemic and the challenges. Int J Antimicrob Agents 55: 105924. doi: 10.1016/j.ijantimicag.2020.105924

|
| [2] | World Health Organization Coronavirus disease (COVID-19) outbreak situation (2021) .Available from: https://www.who.int/emergencies/diseases/novel-coronavirus-2019. |
| [3] |
Bai Y, Yao L, Wei T, et al. (2020) Presumed asymptomatic carrier transmission of COVID-19. JAMA 323: 1406-1407. doi: 10.1001/jama.2020.2565
|
| [4] |
Minhas S, Chaudhry RM, Sajjad A, et al. (2020) Corona pandemic: awareness of health care providers in Pakistan. AIMS Public Health 7: 548-561. doi: 10.3934/publichealth.2020044
|
| [5] |
Robinson S, Radnor ZJ, Burgess N, et al. (2012) SimLean: Utilising simulation in the implementation of lean in healthcare. Eur J Oper Res 219: 188-197. doi: 10.1016/j.ejor.2011.12.029
|
| [6] |
Radnor Z, Osborne D (2013) Lean: a failed theory for public services? Public Manage Rev 15: 265-287. doi: 10.1080/14719037.2012.748820
|
| [7] |
de Souza LB (2009) Trends and approaches in lean healthcare. Leadersh Health Serv 22: 121-139. doi: 10.1108/17511870910953788
|
| [8] | Kumaraswamy S (2012) Service quality in health care centres: An empirical study. Int J Bus Soc Sci 3: 141-150. |
| [9] |
Kimsey DB (2010) Lean Methodology in Healthcare. AORN J 92: 53-60. doi: 10.1016/j.aorn.2010.01.015
|
| [10] |
Holden RJ (2011) Lean Thinking in Emergency Departments: A Critical Review. Ann Emerg Med 57: 265-278. doi: 10.1016/j.annemergmed.2010.08.001
|
| [11] |
Albliwi SA, Antony J, Lim SAH (2015) A systematic review of Lean Six Sigma for the manufacturing industry. Bus Process Manag J 21: 665-691. doi: 10.1108/BPMJ-03-2014-0019
|
| [12] |
Young T, Brailsford S, Connell C, et al. (2004) Using industrial processes to improve patient care. Br Med J 328: 162-164. doi: 10.1136/bmj.328.7432.162
|
| [13] |
Ponsiglione AM, Ricciardi C, Improta G, et al. (2021) A Six Sigma DMAIC methodology as a support tool for Health Technology Assessment of two antibiotics. Math Biosci Eng 18: 3469-3490. doi: 10.3934/mbe.2021174
|
| [14] | Improta G, Ricciardi C, Borrelli A, et al. (2019) The application of Six Sigma to reduce the pre-operative length of hospital stay at the hospital Antonio Cardarelli. Int J Lean Six Sigm . |
| [15] | Pande PS, Neuman RP, Cavanagh RR (2000) The Six Sigma Way: How GE, Motorola, and Other Top Companies are Honing their Performance USA, New York: McGraw-Hill. |
| [16] | Conceição ACMD, Major MJMF (2011) Adoção do Six Sigma pelas 500 maioresempresasem Portugal. Revista Brasileira de Gestão de Negócios 13: 312-331. |
| [17] |
Converso G, Improta G, Mignano M, et al. (2015) A simulation approach for agile production logic implementation in a hospital emergency unit. International conference on intelligent software methodologies, tools, and techniques Cham: Springer, 623-634. doi: 10.1007/978-3-319-22689-7_48
|
| [18] | Sampson M (2004) Nonprofit, payload process improvement through Lean management USA: University of Colorado. |
| [19] |
Hussain M, Al-Aomar R, Melhem H (2019) Assessment of lean-green practices on thesustainable performance of hotel supply chains. Int J Contemp Hospitality Manage 31: 2448-2467. doi: 10.1108/IJCHM-05-2018-0380
|
| [20] |
Vlachos I, Bogdanovic A (2013) Lean thinking in the European hotel industry. Tourism Manage 36: 354-363. doi: 10.1016/j.tourman.2012.10.007
|
| [21] | Sá JC, Vaz S, Carvalho O, et al. (2020) A model of integration ISO 9001 with Lean Six Sigma and main benefits achieved. Total Qual Manage Bus Excell 1-25. |
| [22] |
Antony J, Forthun SC, Trakulsunti Y, et al. (2019) An exploratory study into the use of lean Six Sigma to reduce medication errors in the Norwegian public healthcare context. Leadersh Health Serv (Bradf Engl) 32: 509-524. doi: 10.1108/LHS-12-2018-0065
|
| [23] |
George A, Joseph AM, Kolencherry S, et al. (2018) Application of Six Sigma DMAIC methodology to reduce medication errors in a major trauma care centre in India. Indian J Pharm Pract 11: 182-187. doi: 10.5530/ijopp.11.4.38
|
| [24] |
Kwak YH, Anbari FT (2004) Benefits, obstacles, and future of Six Sigma approach. Technovation 26: 708-715. doi: 10.1016/j.technovation.2004.10.003
|
| [25] | Radnor Z, Boaden R (2008) Editorial: Does lean enhance public services? Public Money Manage 28: 3-6. |
| [26] |
Fillingham D (2007) Can lean save lives? Leadersh Health Serv 20: 231-241. doi: 10.1108/17511870710829346
|
| [27] | Antony J, Antony F, Taner T (2006) The secret of success Public Service Review: Trade and Industry, 12-14. |
| [28] | Jimmerson C, Weber D, Sobek DK (2005) Reducing Waste and Errors: piloting Lean principles at Intermountain Healthcare. Jt Comm J Qual Patient Saf 31: 249-257. |
| [29] | Manos A, Sattler M, Alukal G (2006) Make Healthcare Lean. Qual Prog 39: 24-30. |
| [30] | Thomerson LD (2001) Journey for excellence: Kentucky's Commonwealth Health Corporation adopts Six Sigma approach. Ann Qual Congr Proc 55: 152-158. |
| [31] |
Sehwail L, De Yong C (2003) Six Sigma in health care. Leadersh Health Serv 16: 1-5. doi: 10.1108/13660750310500030
|
| [32] |
Van den Heuvel J, Does RJMM, Verver JPS (2005) Six Sigma in healthcare: lessons learned from a hospital. Int J Six Sigma Compet Advantage 1: 380-388. doi: 10.1504/IJSSCA.2005.008504
|
| [33] |
Van den Heuvel J, Does RJMM, Vermaat MB (2004) Six Sigma in a Dutch hospital: does it work in the nursing department? Qual Reliab Eng Int 20: 419-426. doi: 10.1002/qre.656
|
| [34] | Proudlove N, Moxham C, Boaden R (2008) Lessons for Lean in Healthcare from using Six Sigma in the NHS. Public Money Manage 28: 27-34. |
| [35] | Ettinger W (2001) Six Sigma adapting GE's lesson to health care. Trustee 54: 10-16. |
| [36] |
Revere L, Black K (2003) Integrating Six Sigma with total quality management: a case example for measuring medication errors. J Healthcare Manage 48: 377-391. doi: 10.1097/00115514-200311000-00007
|
| [37] |
Improta G, Balato G, Romano M, et al. (2017) Improving performances of the knee replacement surgery process by applying DMAIC principles. J Eval Clin Pract 23: 1401-1407. doi: 10.1111/jep.12810
|
| [38] |
Ricciardi C, Balato G, Romano M, et al. (2020) Fast track surgery for knee replacement surgery: a lean Six Sigma approach. TQM J 32: 461-474. doi: 10.1108/TQM-06-2019-0159
|
| [39] |
Taner MT, Sezen B, Antony J (2007) An overview of Six Sigma applications in healthcare industry. Int J Health Care Qual Assur 20: 329-340. doi: 10.1108/09526860710754398
|
| [40] |
Scala A, Ponsiglione AM, Loperto I, et al. (2021) Lean Six Sigma approach for reducing length of hospital stay for patients with femur fracture in a university hospital. Int J Environ Res Public Health 18: 2843. doi: 10.3390/ijerph18062843
|
| [41] |
Mandahawi N, Al-Araidah O, Boran A, et al. (2011) Application of Lean Six Sigma tools to minimize length of stay for ophthalmology day case surgery. Int J Six Sigm Compet Advantage 6: 156-172. doi: 10.1504/IJSSCA.2011.039716
|
| [42] |
Gijo ES (1993) Application of Six Sigma methodology to reducedefects of a grinding process. Qual Reliab Eng Int 27: 1221-1234. doi: 10.1002/qre.1212
|
| [43] |
Griffin A, Hauser JR (1993) The voice of the customer. Mark Sci 12: 1-27. doi: 10.1287/mksc.12.1.1
|
| [44] | Glover J (2005) Six Sigma for Green Belts and Champions. Qual Prog 38: 88. |
| [45] | Omachonu VK, Ross JE Principles of total quality (2004) .Available from: https://www.etechgs.com/blog/principles-total-quality-management-tqm/. |
| [46] | Stamatis D (2004) Six Sigma Fundamentals: A Complete Guide to the System, Methods and Tools New York: Productivity Press. |
| [47] | Slack N, Chambers S, Johnston R (2010) Operations management New York: Pearson Education. |
| [48] | Cheng JL (2017) Integrating DMAIC with Kaizen Events Ensures Continuous Improvement. Int J Sci Res . |
| [49] | Katanani M KAIZEN: How does it aid in Continuous Improvement projects (2019) .Available from: https://www.greycampus.com/blog/quality-management/kaizen-in-continuous-improvement-projects. |
| [50] | Quality One 5 Why & 5 How (2021) .Available from: https://quality-one.com/5-why-5-how/. |
| [51] | Six Sigma Six Sigma DMAIC—Control Phase (2021) .Available from: https://www.whatissixsigma.net/six-sigma-dmaic-control-phase/. |

Figures(3) / Tables(10)

Muhammad Mutasim Billah Tufail, Muhammad Shakeel, Faheem Sheikh, Nuzhat Anjum. Implementation of lean Six-Sigma project in enhancing health care service quality during COVID-19 pandemic[J]. AIMS Public Health, 2021, 8(4): 704-719. doi: 10.3934/publichealth.2021056


 DownLoad: