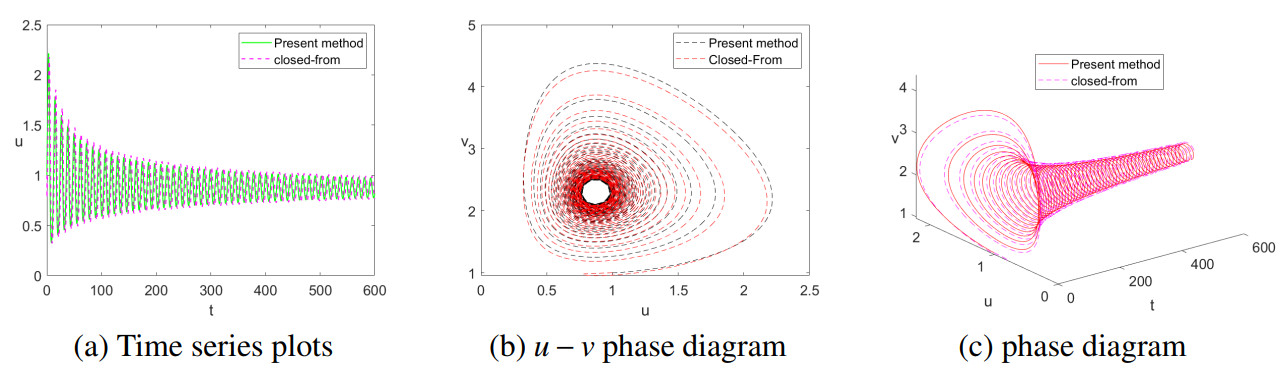
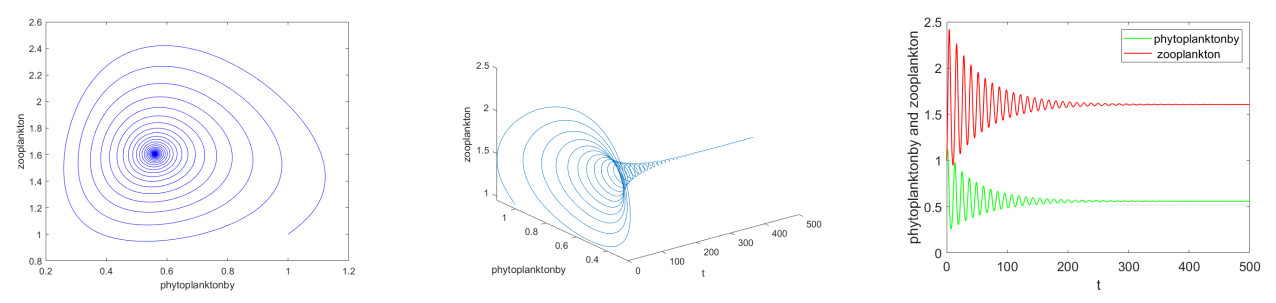
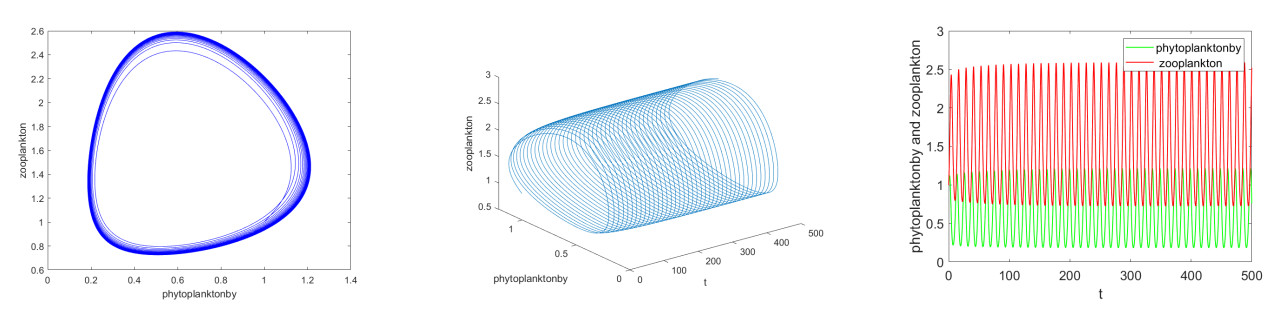
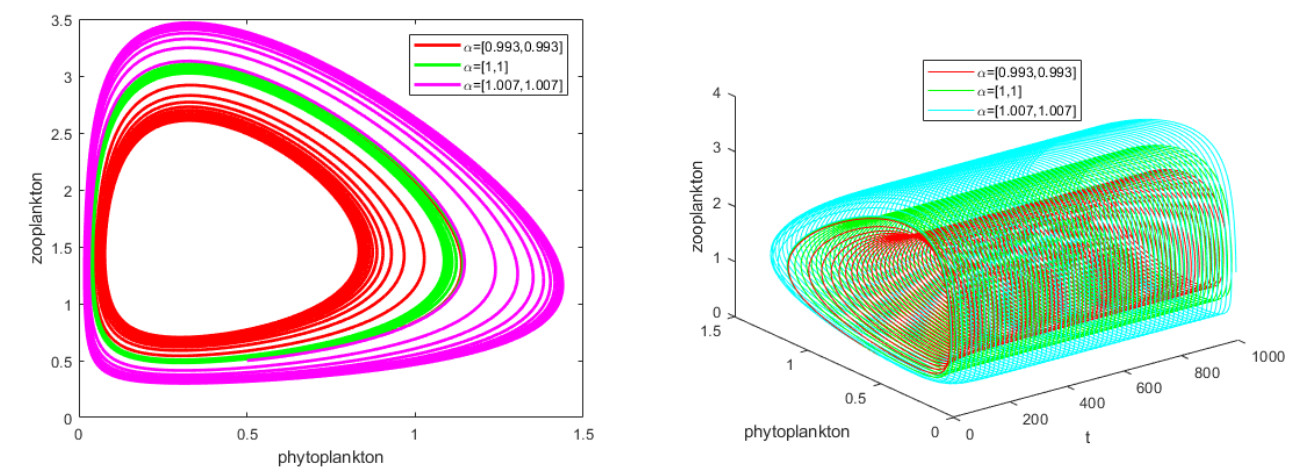
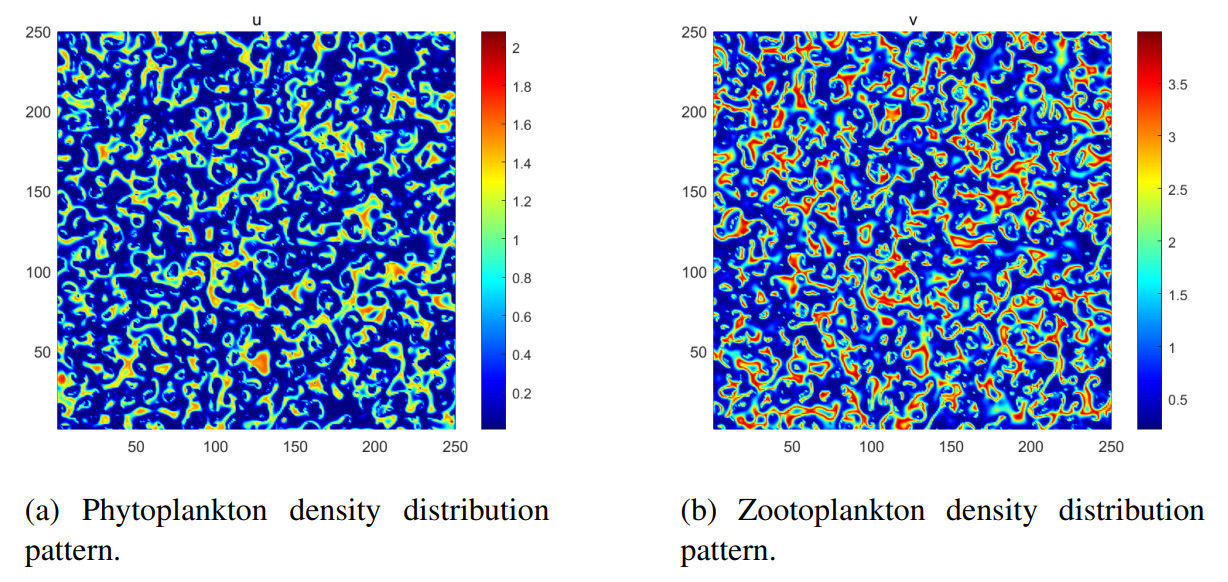
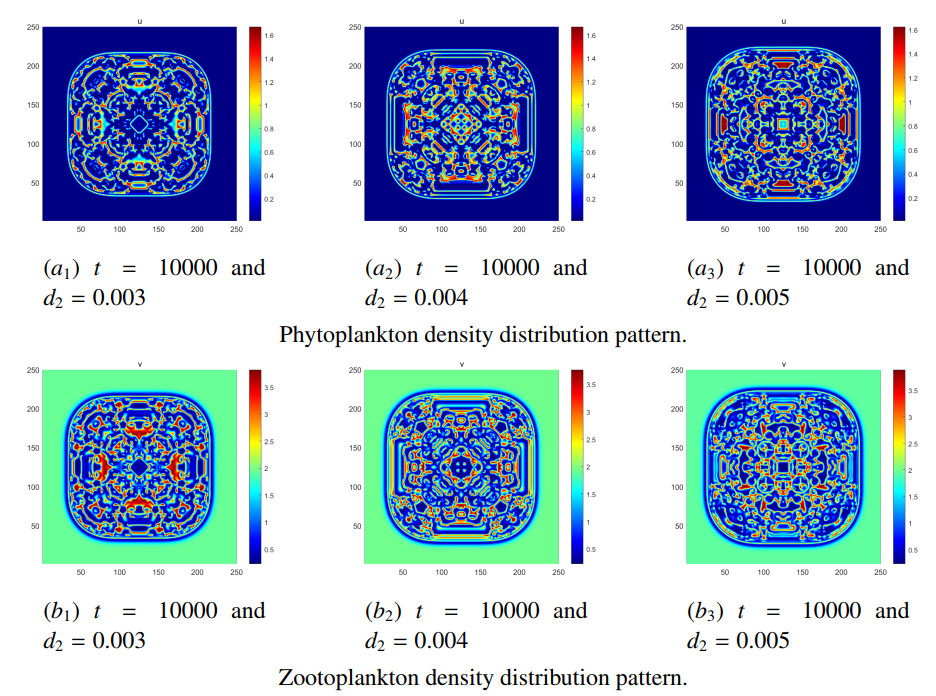
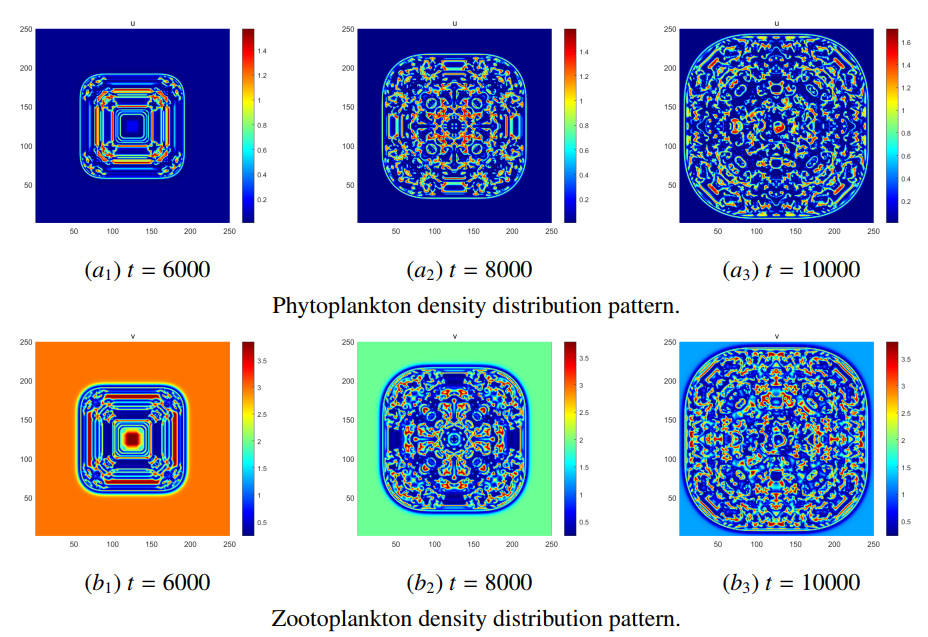
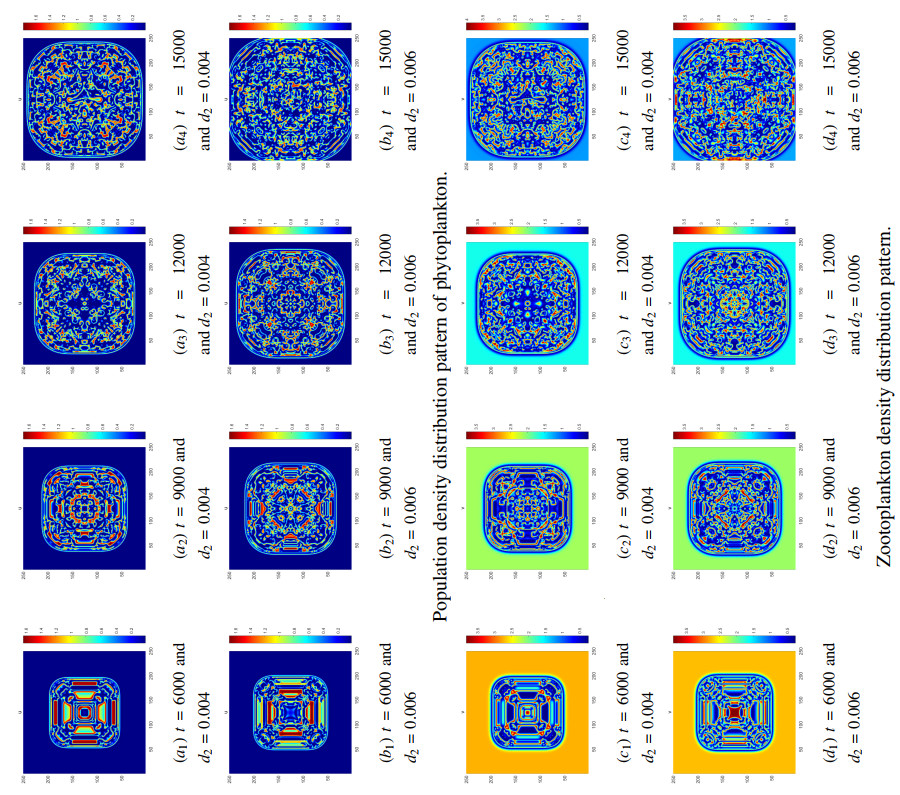
It is always a difficult and hot topic to effectively explore the dynamic behavior of phytoplankton-zooplankton models. Thus, we investigated dynamic properties and a numerical solution of a fractional-order phytoplankton-zooplankton ecological model (PZEM) that incorporates the effects of toxic substances and additional food transmission in the environment. First, stability, Turing instability, Hopf bifurcation, and weakly nonlinear analysis were analyzed for the PZEM. Second, a new high-precision numerical method was developed for the fractional PZEM without diffusion terms. We compared the method with other methods to determine the effectiveness of the present method. A discretization method was established for the PZEM with diffusion term. Finally, numerical simulation verified the feasibility of the theory. Numerical simulations showed the chaotic attractor and some novel pattern dynamical behaviors of the PZEM.
Citation: Shuai Zhang, Haolu Zhang, Yulan Wang, Zhiyuan Li. Dynamic properties and numerical simulations of a fractional phytoplankton-zooplankton ecological model[J]. Networks and Heterogeneous Media, 2025, 20(2): 648-669. doi: 10.3934/nhm.2025028
It is always a difficult and hot topic to effectively explore the dynamic behavior of phytoplankton-zooplankton models. Thus, we investigated dynamic properties and a numerical solution of a fractional-order phytoplankton-zooplankton ecological model (PZEM) that incorporates the effects of toxic substances and additional food transmission in the environment. First, stability, Turing instability, Hopf bifurcation, and weakly nonlinear analysis were analyzed for the PZEM. Second, a new high-precision numerical method was developed for the fractional PZEM without diffusion terms. We compared the method with other methods to determine the effectiveness of the present method. A discretization method was established for the PZEM with diffusion term. Finally, numerical simulation verified the feasibility of the theory. Numerical simulations showed the chaotic attractor and some novel pattern dynamical behaviors of the PZEM.

| [1] |
J. C. Macdonald, H. Gulbudak, Forward hysteresis and Hopf bifurcation in an Npzd model with application to harmful algal blooms, J. Math. Biol., 87 (2023), 45. https://doi.org/10.1007/s00285-023-01969-7 doi: 10.1007/s00285-023-01969-7

|
| [2] |
H. Liu, C. J. Dai, H. G. Yu, Q. Guo, J. B. Li, A. M. Hao, et al. Dynamics of a stochastic non-autonomous phytoplankton-zooplankton system involving toxin-producing phytoplankton and impulsive perturbations, Math. Comput. Simul., 203 (2023), 368–386. https://doi.org/10.1016/j.matcom.2022.06.012 doi: 10.1016/j.matcom.2022.06.012
|
| [3] |
K. Dehingia, A. Das, E. Hincal, K. Hosseini, The effect of time delay on the dynamics of a plankton-nutrient system with refuge, Braz. J. Phys., 55 (2025), 28. https://doi.org/10.1007/s13538-024-01670-0 doi: 10.1007/s13538-024-01670-0
|
| [4] |
M. Xu, Y. Liu, Z. Zhao, K. Fu, X. Lv, Advancing parameter estimation with characteristic finite difference method (CFDM) for a marine ecosystem model by assimilating satellite observations: Spatial distributions, Front. Mar. Sci., 9 (2022), 997537. https://doi.org/10.3389/fmars.2022.997537 doi: 10.3389/fmars.2022.997537
|
| [5] |
A. W. Omta, E. A. Heiny, H. Rajakaruna, D. Talmy, M. J. Follows, Trophic model closure influences ecosystem response to enrichment, Ecol. Modell., 475 (2023), 110183. https://doi.org/10.1016/j.ecolmodel.2022.110183 doi: 10.1016/j.ecolmodel.2022.110183
|
| [6] |
M. N. Huda, Q. Q. A'yun, S. Wigantono, H. Sandariria, I. Raming, A. Asmaidi, Effects of harvesting and planktivorous fish on bioeconomic phytoplankton-zooplankton models with ratio-dependent response functions and time delays, Chaos Soliton Fract., 173 (2023), 113736. https://doi.org/10.1016/j.chaos.2023.113736 doi: 10.1016/j.chaos.2023.113736
|
| [7] |
K. Chakraborty, K. Das, Modeling and analysis of a two-zooplankton one-phytoplankton system in the presence of toxicity, Appl. Math. Model., 39 (2015), 1241–1265. https://doi.org/10.1016/j.apm.2014.08.004 doi: 10.1016/j.apm.2014.08.004
|
| [8] |
Y. Lv, J. Cao, J. Song, R. Yuan, Y. Pei, Global stability and Hopf-bifurcation in a zooplankton-phytoplankton model, Nonlinear Dyn., 76 (2014), 345–366. https://doi.org/10.1007/s11071-013-1130-2 doi: 10.1007/s11071-013-1130-2
|
| [9] |
V. P. Dubey, J. Singh, A. M. Alshehri, S. Dubey, D. Kumar, Numerical investigation of fractional model of phytoplankton-toxic phytoplankton-zooplankton system with convergence analysis, Int. J. Biomath., 15 (2022), 2250006. https://doi.org/10.1142/S1793524522500061 doi: 10.1142/S1793524522500061
|
| [10] |
P. Panja, T. Kar, D. K. Jana, Impacts of global warming on phytoplankton-zooplankton dynamics: A modelling study, Environ. Dev. Sustain., 26 (2024), 13495–13513. https://doi.org/10.1007/s10668-023-04430-3 doi: 10.1007/s10668-023-04430-3
|
| [11] | I. M. Suthers, A. J. Richardson, D. Rissik, The importance of plankton, in Plankton: A Guide to Their Ecology and Monitoring for Water Quality, Australia: CSIRO Publishing, 2019, 1–13. https://doi.org/10.1080/00288330.2019.1625497 |
| [12] |
W. Wang, S. Liu, D. Tian, D. Wang, Pattern dynamics in a toxin-producing phytoplankton-zooplankton model with additional food, Nonlinear Dyn., 94 (2018), 211–228. https://doi.org/10.1007/s11071-018-4354-3 doi: 10.1007/s11071-018-4354-3
|
| [13] |
J. Alzabut, R. Dhineshbabu, A. G. M. Selvam, J. F. Gomez-Aguilar, H. Khan, Existence, uniqueness and synchronization of a fractional tumor growth model in discrete time with numerical results, Results Phys., 54 (2023), 107030. https://doi.org/10.1016/j.rinp.2023.107030 doi: 10.1016/j.rinp.2023.107030
|
| [14] |
W. AI-Sadi, Z. Wei, S. Q. T. Abdullah, A. Alkhazzan, J. F. Gomez-Aguilar, Dynamical and numerical analysis of the hepatitis B virus treatment model through fractal-fractional derivative, Math. Methods Appl. Sci., 48 (2024), 639–657. https://doi.org/10.1002/mma.10348 doi: 10.1002/mma.10348
|
| [15] |
M. S. Shabbir, Q. Din, M. De la Sen, J. F. Gomez-Aguilar, Exploring dynamics of plant-herbivore interactions: Bifurcation analysis and chaos control with Holling type-Ⅱ functional response, J. Math. Biol., 88 (2024), 8. https://doi.org/10.1007/s00285-023-02020-5 doi: 10.1007/s00285-023-02020-5
|
| [16] |
H. Khan, J. lzabut, J. F. Gomez-Aguilar, A. Alkhazan, Essential criteria for existence of solution of a modified-ABC fractional order smoking model, Ain Shams Eng. J., 15 (2024), 102646. https://doi.org/10.1016/j.asej.2024.102646 doi: 10.1016/j.asej.2024.102646
|
| [17] |
N. Raza, A. Raza, Y. Chahlaoui, J. F. Gomez-Aguilar, Numerical analysis of HPV and its association with cervical cancer using Atangana-Baleanu fractional derivative, Model. Earth Syst. Environ., 11 (2025), 60. https://doi.org/10.1007/s40808-024-02243-5 doi: 10.1007/s40808-024-02243-5
|
| [18] | P. Li, R. Gao, C. Xu, Y. Li, A. Akgul, D. Baleanu, Dynamics exploration for a fractional-order delayed zooplankton-phytoplankton system. Chaos Soliton Fract., 166 (2023), 112975. https://doi.org/10.1016/j.chaos.2022.112975 |
| [19] |
M. Javidi, B. Ahmad, Dynamic analysis of time fractional order phytoplankton-toxic phytoplankton-zooplankton system, Ecol. Model., 318 (2015), 8–18. https://doi.org/10.1016/j.ecolmodel.2015.06.016 doi: 10.1016/j.ecolmodel.2015.06.016
|
| [20] |
P. Kumar, V. Suat Erturk, R. Banerjee, M. Yavuz, V. Govindaraj, Fractional modeling of plankton-oxygen dynamics under climate change by the application of a recent numerical algorithm, Phys. Scr., 96 (2021), 124044. https://doi.org/10.1088/1402-4896/ac2da7 doi: 10.1088/1402-4896/ac2da7
|
| [21] |
C. P. Li, Z. Q. Li, Z. Wang, Mathematical analysis and the local discontinuous Galerkin method for Caputo-Hadamard fractional partial differential equation, J. Sci. Comput., 85 (2020), 41. https://doi.org/10.1007/s10915-020-01353-3 doi: 10.1007/s10915-020-01353-3
|
| [22] |
C. P. Li, Z. Q. Li, The blow-up and global existence of solution to Caputo-Hadamard fractional partial differential equation with fractional Laplacian, J. Nonlinear Sci., 31 (2021), 80. https://doi.org/10.1007/s00332-021-09736-y doi: 10.1007/s00332-021-09736-y
|
| [23] |
C. Han, Y. L. Wang, Z. Y. Li, Novel patterns in a class of fractional reaction-diffusion models with the Riesz fractional derivative, Math. Comput. Simul., 202 (2022), 149–163. https://doi.org/10.1016/j.matcom.2022.05.037 doi: 10.1016/j.matcom.2022.05.037
|
| [24] |
C. Han, Y. L. Wang, Z. Y. Li, A high-precision numerical approach to solving space fractional Gray-Scott model, Appl. Math. Lett., 125 (2022), 107759. https://doi.org/10.1016/j.aml.2021.107759 doi: 10.1016/j.aml.2021.107759
|
| [25] |
C. P. Li, Q. Yi, A. Chen, Finite difference methods with non-uniform meshes for nonlinear fractional differential equations, J. Comput. Phys., 316 (2016), 614–631. https://doi.org/10.1016/j.jcp.2016.04.039 doi: 10.1016/j.jcp.2016.04.039
|
| [26] | X. H. Wang, H. L. Zhang, Y. L. Wang, Z. Y. Li, Dynamic properties and numerical simulations of the fractional Hastings–Powell model with the Grünwald-Letnikov differential derivative, Int. J. Bifurcation Chaos, 35 (2025), In press. |
| [27] |
M. Singh, S. Das, Rajeev, S. H. Ong, Novel operational matrix method for the numerical solution of nonlinear reaction-advection-diffusion equation of fractional order, Comput. Appl. Math., 41 (2022), 306. https://doi.org/10.1007/s40314-022-02017-8 doi: 10.1007/s40314-022-02017-8
|
| [28] |
M. Kashif, M. Singh, T. Som, E. M. Craciun, Numerical study of variable order model arising in chemical processes using operational matrix and collocation method, J. Comput. Sci., 80 (2024), 102339. https://doi.org/10.1016/j.jocs.2024.102339 doi: 10.1016/j.jocs.2024.102339
|
| [29] |
P. Roul, Design and analysis of efficient computational techniques for solving a temporal-fractional partial differential equation with the weakly singular solution, Math. Methods Appl. Sci., 47 (2024), 2226–2249. https://doi.org/10.1002/mma.9744 doi: 10.1002/mma.9744
|
| [30] |
T. Kumari, P. Roul, An efficient computational technique for solving a time-fractional reaction-subdiffusion model in 2D space, Comput. Math. Appl., 160 (2024), 191–208. https://doi.org/10.1016/j.camwa.2024.02.018 doi: 10.1016/j.camwa.2024.02.018
|
| [31] |
Anjuman, A. Y. T. Leung, S. Das, Two-dimensional time-fractional nonlinear drift reaction-diffusion equation arising in electrical field, Fractal Fract., 8 (2024), 456. https://doi.org/10.3390/fractalfract8080456 doi: 10.3390/fractalfract8080456
|
| [32] |
R. Sharma, A numerical study for nonlinear time-space fractional reaction-diffusion model of fourth-order, J. Comput. Nonlinear Dyn., 20 (2025), 021001. https://doi.org/10.1115/1.4067065 doi: 10.1115/1.4067065
|
| [33] |
K. M. Owolabi, S. Jain, E. Pindza, E. Mare, Comprehensive numerical analysis of time-fractional reaction-diffusion models with applications to chemical and biological phenomena, Mathematics, 12 (2024), 3251. https://doi.org/10.3390/math12203251 doi: 10.3390/math12203251
|
| [34] |
M. Sohaib, K. M. Furati, A. Shah, Space fractional Allen-Cahn equation and its applications in phase separation: A numerical study, Commun. Nonlinear Sci. Numer. Simul., 137 (2024), 108173. https://doi.org/10.1016/j.cnsns.2024.108173 doi: 10.1016/j.cnsns.2024.108173
|
| [35] | I. Petráš, Fractional-Order Nonlinear Systems: Modeling, Analysis and Simulation, Heidelberg: Springer Science & Business Media, 2011. https://doi.org/10.1007/978-3-642-18101-6 |
| [36] |
X. L. Gao, H. L. Zhang, X. Y. Li, Research on pattern dynamics of a class of predator-prey model with interval biological coefficients for capture, , AIMS Math., 9 (2024), 18506–18527. https://doi.org/10.3934/math.2024901 doi: 10.3934/math.2024901
|
| [37] |
D. Y. Xue, L. Bai, Numerical algorithms for Caputo fractional-order differential equations, Int. J. Control, 90 (2016), 1201–1211. https://doi.org/10.1080/00207179.2016.1158419 doi: 10.1080/00207179.2016.1158419
|
| [38] | D. Y. Xue, C. N. Zhao, Y. Q. Chen, A modified approximation method of fractional order system, in 2006 International Conference on Mechatronics and Automation, IEEE, Luoyang, (2006), 1043–1048. https://doi.org/10.1109/ICMA.2006.257769 |
| [39] | D. Y. Xue, Fractional Calculus and Fractional-Order Control, Beijing: Science Press, 2018. |
| [40] |
W. H. Deng, J. H. Lü, Design of multidirectional multiscroll chaotic attractors based on fractional differential systems via switching control, Chaos, 16 (2006), 043120. https://doi.org/10.1063/1.2401061 doi: 10.1063/1.2401061
|
Figures(8) / Tables(5)
Shuai Zhang, Haolu Zhang, Yulan Wang, Zhiyuan Li. Dynamic properties and numerical simulations of a fractional phytoplankton-zooplankton ecological model[J]. Networks and Heterogeneous Media, 2025, 20(2): 648-669. doi: 10.3934/nhm.2025028


 DownLoad: