Neural tube defects (NTDs) are common congenital anomalies formed by the incomplete closure of the neural tube during early embryonic development. This study aims to identify potential plasma biomarkers associated with NTDs using an untargeted metabolomics approach, thereby enhancing the understanding of the disease pathogenesis and facilitating early diagnosis. Peripheral venous blood samples were obtained from 21 healthy controls and 20 individuals diagnosed with NTDs. Untargeted metabolomic profiling was performed using Quadrupole Time-of-Flight Liquid Chromatography Mass Spectrometry (Q-TOF LC/MS) in positive ion mode. Data processing was conducted using the XCMS package in R, thus identifying significant metabolites based on a fold change greater than 1.5 and a p-value less than 0.05. The analysis revealed significant alterations in several metabolites in NTD cases compared to the healthy controls. Notably, changes were observed in arachidonic acid and prostaglandins (lipid metabolism), choline (methylation processes), amino acids such as leucine, phenylalanine, and lysine (amino acid metabolism), thyrotropin-releasing hormone, vitamin D3, cob(II)alamin, and galactosylsphingosine (sphingolipid metabolism). The identified metabolites may play a role in the pathogenesis of NTDs and hold potential as early diagnostic biomarkers.
Citation: Şule Özel, Ozan Kaplan, Bilge Başak Fidan, Mustafa Çelebier, Yaprak Engin-Üstün. Altered plasma levels of arachidonic acid, choline, amino acids, and sphingolipids signal neural tube defects[J]. AIMS Molecular Science, 2025, 12(1): 99-112. doi: 10.3934/molsci.2025006
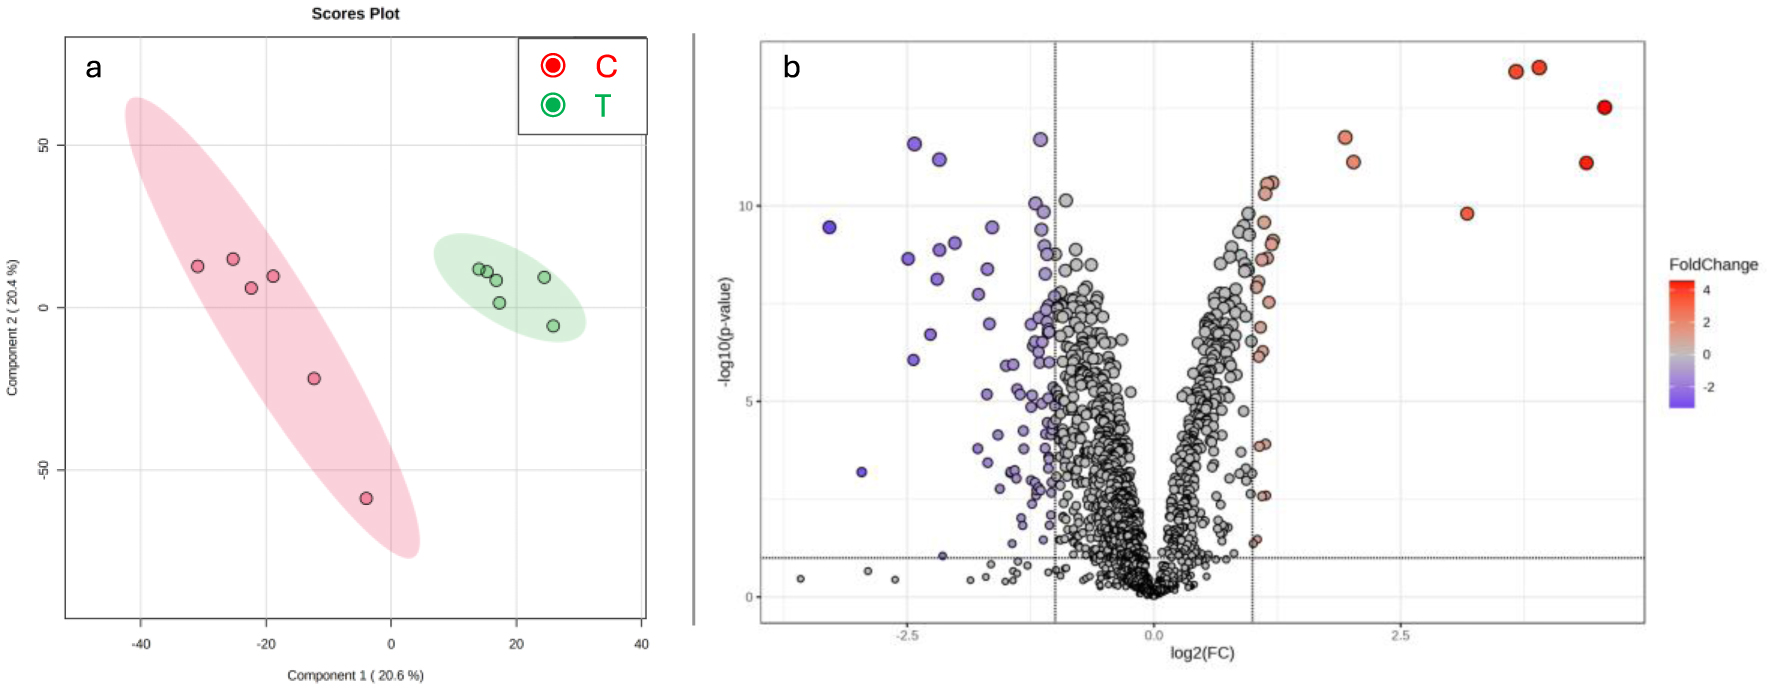
Neural tube defects (NTDs) are common congenital anomalies formed by the incomplete closure of the neural tube during early embryonic development. This study aims to identify potential plasma biomarkers associated with NTDs using an untargeted metabolomics approach, thereby enhancing the understanding of the disease pathogenesis and facilitating early diagnosis. Peripheral venous blood samples were obtained from 21 healthy controls and 20 individuals diagnosed with NTDs. Untargeted metabolomic profiling was performed using Quadrupole Time-of-Flight Liquid Chromatography Mass Spectrometry (Q-TOF LC/MS) in positive ion mode. Data processing was conducted using the XCMS package in R, thus identifying significant metabolites based on a fold change greater than 1.5 and a p-value less than 0.05. The analysis revealed significant alterations in several metabolites in NTD cases compared to the healthy controls. Notably, changes were observed in arachidonic acid and prostaglandins (lipid metabolism), choline (methylation processes), amino acids such as leucine, phenylalanine, and lysine (amino acid metabolism), thyrotropin-releasing hormone, vitamin D3, cob(II)alamin, and galactosylsphingosine (sphingolipid metabolism). The identified metabolites may play a role in the pathogenesis of NTDs and hold potential as early diagnostic biomarkers.

| [1] |
Nelson K, Holmes LB (1989) Malformations due to presumed spontaneous mutations in newborn infants. N Engl J Med 320: 19-23. https://doi.org/10.1056/NEJM198901053200104 
|
| [2] |
Greene NDE, Copp AJ (2014) Neural tube defects. Annu Rev Neurosci 37: 221-242. https://doi.org/10.1146/annurev-neuro-062012-170354
|
| [3] | Tan KH, Tan TYT, Tan J, et al. (2005) Birth defects in Singapore: 1994–2000. Singapore Med J 46: 545-552. |
| [4] |
Busby A, Abramsky L, Dolk H, et al. (2005) Preventing neural tube defects in Europe: Population based study. BMJ 330: 574-575.
|
| [5] |
Cornel MC, De Smit DJ, De Jong-van den Berg LTW (2005) Folic acid—the scientific debate as a base for public health policy. Reprod ToxicoL 20: 411-415. https://doi.org/10.1016/j.reprotox.2005.03.015
|
| [6] | Pulikkunnel ST, Thomas SV (2005) Neural tube defects: Pathogenesis and folate metabolism. J Assoc Physicians India 53: 127-135. |
| [7] | Mennuti MT, Moranz JG, Schwarz RH, et al. (1977) Amniography for the early detection of neural tube defects. Obstet Gynecol 49: 25-30. |
| [8] |
Blumenfeld Z, Siegler E, Bronshtein M (1993) The early diagnosis of neural tube defects. Prenat Diagn 13: 863-871. https://doi.org/10.1002/pd.1970130910
|
| [9] |
Huang W, Gu H, Yuan Z (2022) Identifying biomarkers for prenatal diagnosis of neural tube defects based on “omics”. Clin Genet 101: 381-389. https://doi.org/10.1111/cge.14087
|
| [10] |
López-López A, López-Gonzálvez A, Barker-Tejeda TC, et al. (2018) A review of validated biomarkers obtained through metabolomics. Expert Rev Mol Diagn 18: 557-575. https://doi.org/10.1080/14737159.2018.1481391
|
| [11] |
Jacob M, Lopata AL, Dasouki M, et al. (2019) Metabolomics toward personalized medicine. Mass Spectrom Rev 38: 221-238. https://doi.org/10.1002/mas.21548
|
| [12] |
Forsberg EM, Huan T, Rinehart D, et al. (2018) Data processing, multi-omic pathway mapping, and metabolite activity analysis using XCMS Online. Nat Protoc 13: 633-651. https://doi.org/10.1038/nprot.2017.151
|
| [13] |
Libiseller G, Dvorzak M, Kleb U, et al. (2015) IPO: A tool for automated optimization of XCMS parameters. BMC Bioinformatics 16: 118. https://doi.org/10.1186/s12859-015-0562-8
|
| [14] | Kaplan O, Çelebier M (2020) Evaluation of recent data processing strategies on Q-TOF LC/MS based untargeted metabolomics. Mass Spectrometry Lett 11: 1-5. https://doi.org/10.5478/MSL.2020.11.1.1 |
| [15] |
Sysi-Aho M, Katajamaa M, Yetukuri L, et al. (2007) Normalization method for metabolomics data using optimal selection of multiple internal standards. BMC Bioinformatics 8: 93. https://doi.org/10.1186/1471-2105-8-93
|
| [16] |
Pang Z, Chong J, Zhou G, et al. (2021) MetaboAnalyst 5.0: narrowing the gap between raw spectra and functional insights. Nucleic Acids Res 49: W388-W396. https://doi.org/10.1093/nar/gkab382
|
| [17] |
Dheen ST, Tay SSW, Boran J, et al. (2009) Recent studies on neural tube defects in embryos of diabetic pregnancy: An overview. Current Med Chem 16: 2345-2354. https://doi.org/10.2174/092986709788453069
|
| [18] |
Jawerbaum A, Gonzalez E (2005) The role of alterations in arachidonic acid metabolism and nitric oxide homeostasis in rat models of diabetes during early pregnancy. Curr Pharm Des 11: 1327-1342. https://doi.org/10.2174/1381612053507503
|
| [19] |
Baker L, Piddington R, Goldman A (1990) Myo-inositol and prostaglandins reverse the glucose inhibition of neural tube fusion in cultured mouse embryos. Diabetologia 33: 593-596. https://doi.org/10.1007/BF00400202
|
| [20] |
Reece EA, Khandelwal M, Wu YK, et al. (1997) Dietary intake of myo-inositol and neural tube defects in offspring of diabetic rats. Am J Obstet Gynecol 176: 536-539. https://doi.org/10.1016/S0002-9378(97)70543-X
|
| [21] |
Piddington R, Joyce J, Dhanasekaran P, et al. (1996) Diabetes mellitus affects prostaglandin E2 levels in mouse embryos during neurulation. Diabetologia 39: 915-920. https://doi.org/10.1007/BF00403910
|
| [22] |
Greene NDE, Leung KY, Copp AJ (2017) Inositol, neural tube closure and the prevention of neural tube defects. Birth Defects Res 109: 68-80. https://doi.org/10.1002/bdra.23533
|
| [23] |
Mills JL, Fan R, Brody LC, et al. (2014) Maternal choline concentrations during pregnancy and choline-related genetic variants as risk factors for neural tube defects. Am J Clin Nutr 100: 1069-1074. https://doi.org/10.3945/ajcn.113.079319
|
| [24] | Shaw GM, Carmichael SL, Yang W, et al. (2004) Periconceptional dietary intake of choline and betaine and neural tube defects in offspring. Am J Epidemiol 160: 102-109. https://doi.org/10.1093/aje/kwh187 |
| [25] | Rosenquist TH, Ratashak SA, Selhub J (1996) Homocysteine induces congenital defects of the heart and neural tube: Effect of folic acid. Proc Natl Acad Sci USA 93: 15227-15232. https://doi.org/10.1073/pnas.93.26.15227 |
| [26] | Saxton RA, Knockenhauer KE, Wolfson RL, et al. (2016) Structural basis for leucine sensing by the Sestrin2-mTORC1 pathway. Science 351: 53-58. https://doi.org/10.1126/science.aad2087 |
| [27] |
Denno KM, Sadler T (1990) Phenylalanine and its metabolites induce embryopathies in mouse embryos in culture. Teratology 42: 565-570. https://doi.org/10.1002/tera.1420420513
|
| [28] | Duczyńska N, Cabalska B, Nowaczewska I, et al. (1990) Evaluation of amino acids in plasma and amniotic fluid of women from genetic risk groups. Probl Med Wieku Rozwoj 16: 103-115. |
| [29] |
Gamero-Estevez E, Baumholtz AI, Ryan AK (2018) Developing a link between toxicants, claudins and neural tube defects. Reprod Toxicol 81: 155-167. https://doi.org/10.1016/j.reprotox.2018.08.008
|
| [30] |
Bereket A (2008) Endocrine aspects of neural tube defects. The Spina Bifida . Springer 423-428. https://doi.org/10.1007/978-88-470-0651-5_34
|
| [31] |
Daglar K, Tokmak A, Kirbas A, et al. (2016) Maternal serum vitamin D levels in pregnancies complicated by neural tube defects. J Matern Fetal Neonatal Med 29: 298-302. https://doi.org/10.3109/14767058.2014.999037
|
| [32] | Groenen PMW, Engelke UF, Wevers RA, et al. (2004) High-resolution 1H NMR spectroscopy of amniotic fluids from spina bifida fetuses and controls. Eur J Obstet Gynecol Reprod Biol 112: 16-23. https://doi.org/10.1016/s0301-2115(03)00279-3 |
| [33] |
Zheng X, Su M, Pei L, et al. (2011) Metabolic signature of pregnant women with neural tube defects in offspring. J Proteome Res 10: 4845-4854. https://doi.org/10.1021/pr200666d
|
| [34] |
Thompson MD, Cole DEC, Ray JG (2009) Vitamin B-12 and neural tube defects: The Canadian experience. Am J Clin Nutr 89: 697S-701S. https://doi.org/10.3945/ajcn.2008.26947B
|
| [35] |
Kaneko-Tarui T, Zhang L, Austin KJ, et al. (2007) Maternal and embryonic control of uterine sphingolipid-metabolizing enzymes during murine embryo implantation. Biology of reproduction 77: 658-665. https://doi.org/10.1095/biolreprod.107.061044
|
| [36] |
Guo L, Geng X, Ma L, et al. (2013) Sphingosine-1-phosphate inhibits ceramide-induced apoptosis during murine preimplantation embryonic development. Theriogenology 80: 206-211. https://doi.org/10.1016/j.theriogenology.2013.04.016
|
| [37] |
Lumsangkul C, Tso KH, Fan YK, et al. (2021) Mycotoxin fumonisin B1 interferes sphingolipid metabolisms and neural tube closure during early embryogenesis in brown tsaiya ducks. Toxins 13: 743. https://doi.org/10.3390/toxins13110743
|
| [38] |
Marasas WFO, Riley RT, Hendricks KA, et al. (2004) Fumonisins disrupt sphingolipid metabolism, folate transport, and neural tube development in embryo culture and in vivo: a potential risk factor for human neural tube defects among populations consuming fumonisin-contaminated maize. J Nutr 134: 711-716. https://doi.org/10.1093/jn/134.4.711
|
| [39] |
Mizugishi K, Yamashita T, Olivera A, et al. (2005) Essential role for sphingosine kinases in neural and vascular development. Mol Cell Biol 25: 11113-11121. https://doi.org/10.1128/MCB.25.24.11113-11121.2005
|
| [40] |
Milstien S, Gude D, Spiegel S (2007) Sphingosine 1—phosphate in neural signalling and function. Acta Paediatr 96: 40-43. https://doi.org/10.1111/j.1651-2227.2007.00206.x
|
| [41] |
Hendricks K (1999) Fumonisins and neural tube defects in South Texas. Epidemiology 10: 198-200. https://doi.org/10.1097/00001648-199903000-00022
|
| [42] |
Merrill AH, van Echten G, Wang E, et al. (1993) Fumonisin B1 inhibits sphingosine (sphinganine) N-acyltransferase and de novo sphingolipid biosynthesis in cultured neurons in situ. J Biol Chem 268: 27299-27306.
|
| [43] |
Liu L, Yin TL, Chen Y, et al. (2018) Follicular dynamics of glycerophospholipid and sphingolipid metabolisms in polycystic ovary syndrome patients. J Steroid Biochem Mol Biol 185: 142-149. https://doi.org/10.1016/j.jsbmb.2018.08.008
|
| [44] |
Webster WS (1988) The use of animal models in understanding human teratogens. Cong Anom 28: 295-302.
|
| [45] |
Radhika MS, Bhaskaram P, Balakrishna N, et al. (2002) Effects of vitamin A deficiency during pregnancy on maternal and child health. BJOG 109: 689-693. https://doi.org/10.1111/j.1471-0528.2002.01010.x
|
| [46] |
Soprano DR, Soprano KJ (1995) Retinoids as teratogens. Annu Rev Nutr 15: 111-132. https://doi.org/10.1146/annurev.nu.15.070195.000551
|
| [47] |
Lewis S, Lucas RM, Halliday J, et al. (2010) Vitamin D deficiency and pregnancy: From preconception to birth. Mol Nutr Food Res 54: 1092-1102. https://doi.org/10.1002/mnfr.201000044
|
| [48] |
Gernand AD, Schulze KJ, Stewart CP, et al. (2016) Micronutrient deficiencies in pregnancy worldwide: Health effects and prevention. Nat Rev Endocrinol 12: 274-289. https://doi.org/10.1038/nrendo.2016.37
|
| [49] |
Molloy AM, Kirke PN, Brody LC, et al. (2008) Effects of folate and vitamin B12 deficiencies during pregnancy on fetal, infant, and child development. Food Nutr Bull 29: S101-S111. https://doi.org/10.1177/15648265080292S114
|
| [50] |
Nasri K, Ben Jamaa N, Gaigi SS, et al. (2024) Docosahexaenoic acid, eicosapentaenoic acid, arachidonic acid, and neural tube defects in Tunisian population. Birth Defects Res 116: e2372. https://doi.org/10.1002/bdr2.2372
|
Figures(1) / Tables(1)

Şule Özel, Ozan Kaplan, Bilge Başak Fidan, Mustafa Çelebier, Yaprak Engin-Üstün. Altered plasma levels of arachidonic acid, choline, amino acids, and sphingolipids signal neural tube defects[J]. AIMS Molecular Science, 2025, 12(1): 99-112. doi: 10.3934/molsci.2025006


 DownLoad: