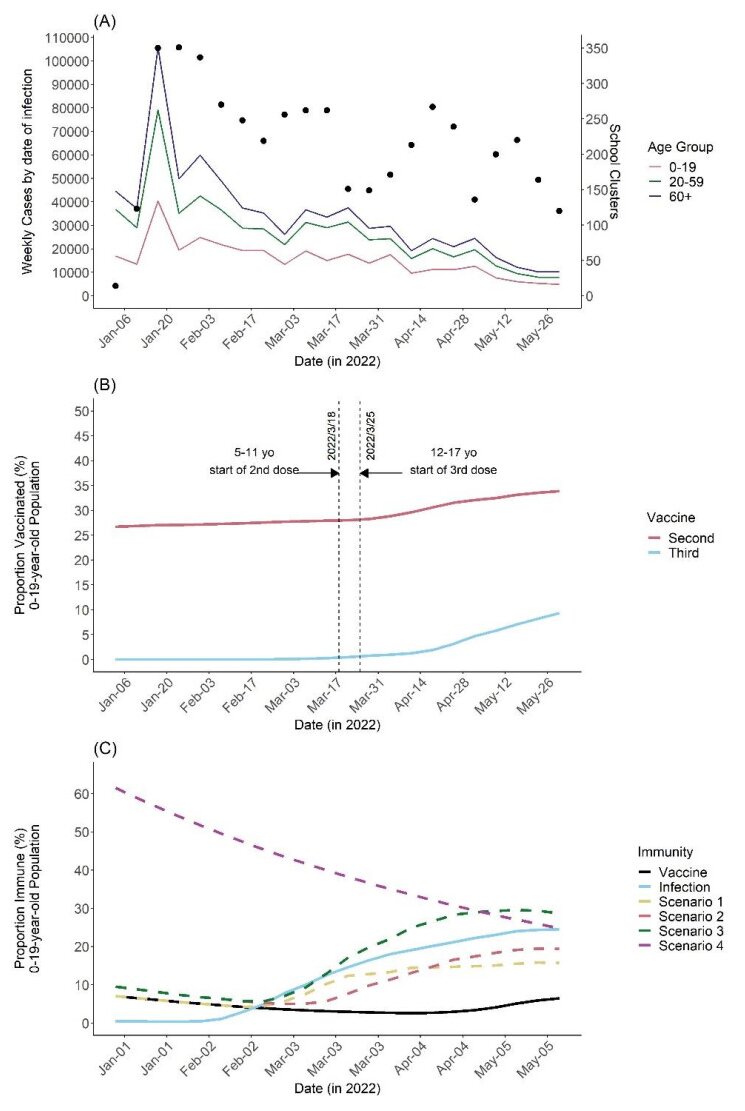
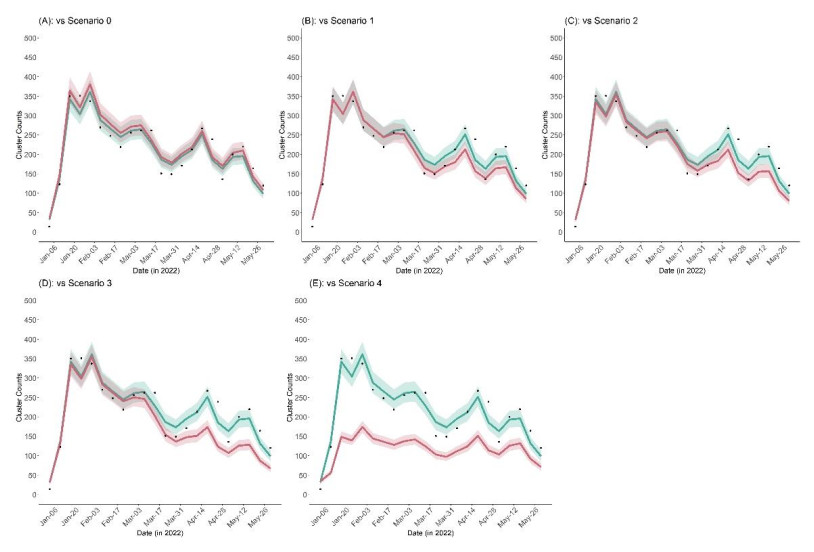
Clusters of COVID-19 in high-risk settings, such as schools, have been deemed a critical driving force of the major epidemic waves at the societal level. In Japan, the vaccination coverage among students remained low up to early 2022, especially for 5–11-year-olds. The vaccination of the student population only started in February 2022. Given this background and considering that vaccine effectiveness against school transmission has not been intensively studied, this paper proposes a mathematical model that links the occurrence of clustering to the case count among populations aged 0–19, 20–59, and 60+ years of age. We first estimated the protected (immune) fraction of each age group either by infection or vaccination and then linked the case count in each age group to the number of clusters via a time series regression model that accounts for the time-varying hazard of clustering per infector. From January 3 to May 30, 2022, there were 4,722 reported clusters in school settings. Our model suggests that the immunity offered by vaccination averted 226 (95% credible interval: 219–232) school clusters. Counterfactual scenarios assuming elevated vaccination coverage with faster roll-out reveal that additional school clusters could have been averted. Our study indicates that even relatively low vaccination coverage among students could substantially lower the risk of clustering through vaccine-induced immunity. Our results also suggest that antigenically updated vaccines that are more effective against the variant responsible for the ongoing epidemic may greatly help decrease not only the incidence but also the unnecessary loss of learning opportunities among school-age students.
Citation: Yuta Okada, Hiroshi Nishiura. Vaccine-induced reduction of COVID-19 clusters in school settings in Japan during the epidemic wave caused by B.1.1.529 (Omicron) BA.2, 2022[J]. Mathematical Biosciences and Engineering, 2024, 21(9): 7087-7101. doi: 10.3934/mbe.2024312
Clusters of COVID-19 in high-risk settings, such as schools, have been deemed a critical driving force of the major epidemic waves at the societal level. In Japan, the vaccination coverage among students remained low up to early 2022, especially for 5–11-year-olds. The vaccination of the student population only started in February 2022. Given this background and considering that vaccine effectiveness against school transmission has not been intensively studied, this paper proposes a mathematical model that links the occurrence of clustering to the case count among populations aged 0–19, 20–59, and 60+ years of age. We first estimated the protected (immune) fraction of each age group either by infection or vaccination and then linked the case count in each age group to the number of clusters via a time series regression model that accounts for the time-varying hazard of clustering per infector. From January 3 to May 30, 2022, there were 4,722 reported clusters in school settings. Our model suggests that the immunity offered by vaccination averted 226 (95% credible interval: 219–232) school clusters. Counterfactual scenarios assuming elevated vaccination coverage with faster roll-out reveal that additional school clusters could have been averted. Our study indicates that even relatively low vaccination coverage among students could substantially lower the risk of clustering through vaccine-induced immunity. Our results also suggest that antigenically updated vaccines that are more effective against the variant responsible for the ongoing epidemic may greatly help decrease not only the incidence but also the unnecessary loss of learning opportunities among school-age students.

| [1] |
N. Banholzer, K. Zürcher, P. Jent, P. Bittel, L. Furrer, M. Egger, et al., SARS-CoV-2 transmission with and without mask wearing or air cleaners in schools in Switzerland: A modeling study of epidemiological, environmental, and molecular data, PLoS Med., 20 (2023), e1004226. https://doi.org/10.1371/journal.pmed.1004226 doi: 10.1371/journal.pmed.1004226

|
| [2] |
E.A. Meyerowitz, A. Richterman, R.T. Gandhi, P.E. Sax, Transmission of SARS-CoV-2: A review of viral, host, and environmental factors, Ann. Intern. Med., 174 (2021), 69–79. https://doi.org/10.7326/M20-5008 doi: 10.7326/M20-5008
|
| [3] |
M. Cevik, J.L. Marcus, C. Buckee, T.C. Smith, Severe Acute Respiratory Syndrome Coronavirus 2 (SARS-CoV-2) transmission dynamics should inform policy, Clin. Infect. Dis., 73 (2021), S170–S176. https://doi.org/10.1093/cid/ciaa1442 doi: 10.1093/cid/ciaa1442
|
| [4] |
D.C. Adam, P. Wu, J.Y. Wong, E.H.Y. Lau, T.K. Tsang, S. Cauchemez, et al., Clustering and superspreading potential of SARS-CoV-2 infections in Hong Kong, Nat Med., 26 (2020), 1714–1719. https://doi.org/10.1038/s41591-020-1092-0 doi: 10.1038/s41591-020-1092-0
|
| [5] |
T. Liu, D. Gong, J. Xiao, J. Hu, G. He, Z. Rong, W. Ma, Cluster infections play important roles in the rapid evolution of COVID-19 transmission: A systematic review, Int. J. Infect. Dis., 99 (2020), 374–380. https://doi.org/10.1016/j.ijid.2020.07.073 doi: 10.1016/j.ijid.2020.07.073
|
| [6] |
Y. Furuse, N. Tsuchiya, R. Miyahara, I. Yasuda, E. Sando, Y.K. Ko, et al., COVID-19 case-clusters and transmission chains in the communities in Japan, J. Infect., 84 (2022), 248–288. https://doi.org/10.1016/j.jinf.2021.08.016 doi: 10.1016/j.jinf.2021.08.016
|
| [7] |
P. Tupper, S. Pai, COVID Schools Canada, C. Colijn, COVID-19 cluster size and transmission rates in schools from crowdsourced case reports, ELife, 11 (2022), e76174. https://doi.org/10.7554/eLife.76174 doi: 10.7554/eLife.76174
|
| [8] |
M. Ueda, K. Hayashi, H. Nishiura, Identifying High-Risk Events for COVID-19 Transmission: Estimating the Risk of Clustering Using Nationwide Data, Viruses, 15 (2023), 456. https://doi.org/10.3390/v15020456 doi: 10.3390/v15020456
|
| [9] |
H. Oshitani, L.A.W.J. The Expert Members of The National COVID-19 Cluster Taskforce at The Ministry of Health, Cluster-Based Approach to Coronavirus Disease 2019 (COVID-19) Response in Japan, from February to April 2020, Jpn. J. Infect. Dis., 73 (2020), 491–493. https://doi.org/10.7883/yoken.JJID.2020.363 doi: 10.7883/yoken.JJID.2020.363
|
| [10] |
T. Imamura, A. Watanabe, Y. Serizawa, M. Nakashita, M. Saito, M. Okada, et al., Transmission of COVID-19 in Nightlife, Household, and Health Care Settings in Tokyo, Japan, in 2020, JAMA Netw Open., 6 (2023), e230589. https://doi.org/10.1001/jamanetworkopen.2023.0589 doi: 10.1001/jamanetworkopen.2023.0589
|
| [11] |
S. Nagata, T. Nakaya, Y. Adachi, T. Inamori, K. Nakamura, D. Arima, et al., Mobility change and COVID-19 in Japan: Mobile data analysis of locations of infection, J. Epidemiol., 31 (2021), 387–391. https://doi.org/10.2188/jea.JE20200625 doi: 10.2188/jea.JE20200625
|
| [12] |
M. Nakanishi, R. Shibasaki, S. Yamasaki, S. Miyazawa, S. Usami, H. Nishiura, et al., On-site dining in Tokyo during the COVID-19 pandemic: Time series analysis using mobile phone location data, JMIR MHealth UHealth., 9 (2021), e27342. https://doi.org/10.2196/27342 doi: 10.2196/27342
|
| [13] |
Y. Okada, S. Yamasaki, A. Nishida, R. Shibasaki, H. Nishiura, Night-time population consistently explains the transmission dynamics of coronavirus disease 2019 in three megacities in Japan, Front Public Health., 11 (2023). https://doi.org/10.3389/fpubh.2023.1163698 doi: 10.3389/fpubh.2023.1163698
|
| [14] | Ministry of Education Culture Sports Science and Technology, Surveys on the situation in schools, case studies of initiatives (Japanese), Ministry of Education, Culture, Sports, Science and Technology. https://www.mext.go.jp/a_menu/coronavirus/mext_00007.html (accessed September 4, 2024) |
| [15] |
A. Takamatsu, H. Honda, T. Miwa, T. Tabuchi, K. Taniguchi, K. Shibuya, et al., Factors associated with COVID-19 booster vaccine hesitancy: A nationwide, cross-sectional survey in Japan, Public Health, 223 (2023), 72–79. https://doi.org/10.1016/j.puhe.2023.07.02 doi: 10.1016/j.puhe.2023.07.02
|
| [16] |
Y. Takahashi, K. Ishitsuka, M. Sampei, S. Okawa, Y. Hosokawa, A. Ishiguro, et al., COVID-19 vaccine literacy and vaccine hesitancy among pregnant women and mothers of young children in Japan, Vaccine, 40 (2022), 6849–6856. https://doi.org/10.1016/j.vaccine.2022.09.094 doi: 10.1016/j.vaccine.2022.09.094
|
| [17] |
D. Courtney, P. Watson, M. Battaglia, B.H. Mulsant, P. Szatmari, COVID-19 Impacts on Child and Youth Anxiety and Depression: Challenges and Opportunities, Can, J, Psychiatry., 65 (2020), 688–691. https://doi.org/10.1177/0706743720935646 doi: 10.1177/0706743720935646
|
| [18] |
R.E. Norman, M. Byambaa, R. De, A. Butchart, J. Scott, T. Vos, The long-term health consequences of child physical abuse, emotional abuse, and neglect: A systematic review and meta-analysis, PLoS Med., 9 (2012), e1001349. https://doi.org/10.1371/journal.pmed.1001349 doi: 10.1371/journal.pmed.1001349
|
| [19] |
M. Sasanami, T. Kayano, H. Nishiura, The number of COVID-19 clusters in healthcare and elderly care facilities averted by vaccination of healthcare workers in Japan, February–June 2021, Math. Biosci. Eng., 19 (2022), 2762–2773. https://doi.org/10.3934/mbe.2022126 doi: 10.3934/mbe.2022126
|
| [20] |
E. Abdollahi, M. Haworth-Brockman, Y. Keynan, J.M. Langley, S.M. Moghadas, Simulating the effect of school closure during COVID-19 outbreaks in Ontario, Canada, BMC Med., 18 (2020), 230. https://doi.org/10.1186/s12916-020-01705-8 doi: 10.1186/s12916-020-01705-8
|
| [21] |
K.A. Auger, S.S. Shah, T. Richardson, D. Hartley, M. Hall, A. Warniment, et al., Association Between Statewide School Closure and COVID-19 Incidence and Mortality in the US, JAMA, 324 (2020), 859–870. https://doi.org/10.1001/jama.2020.1434 doi: 10.1001/jama.2020.1434
|
| [22] |
K. Fukumoto, C.T. McClean, K. Nakagawa, No causal effect of school closures in Japan on the spread of COVID-19 in spring 2020, Nat. Med., 27 (2021), 2111–2119. https://doi.org/10.1038/s41591-021-01571-8 doi: 10.1038/s41591-021-01571-8
|
| [23] |
K. Iwata, A. Doi, C. Miyakoshi, Was school closure effective in mitigating coronavirus disease 2019 (COVID-19)? Time series analysis using Bayesian inference, Int. J. Infect. Dis., 99 (2020), 57–61. https://doi.org/10.1016/j.ijid.2020.07.052 doi: 10.1016/j.ijid.2020.07.052
|
| [24] |
T. Leng, E.M. Hill, A. Holmes, E. Southall, R.N. Thompson, M.J. Tildesley, et al., Quantifying pupil-to-pupil SARS-CoV-2 transmission and the impact of lateral flow testing in English secondary schools, Nat. Commun., 13 (2022), 1106. https://doi.org/10.1038/s41467-022-28731-9 doi: 10.1038/s41467-022-28731-9
|
| [25] |
K.E. Wiens, C.P. Smith, E. Badillo-Goicoechea, K.H. Grantz, M.K. Grabowski, A.S. Azman, et al., In-person schooling and associated COVID-19 risk in the United States over spring semester 2021, Sci Adv., 8 (2022), eabm9128. https://doi.org/10.1126/sciadv.abm9128 doi: 10.1126/sciadv.abm9128
|
| [26] |
C. Molina Grané, P. Mancuso, M. Vicentini, F. Venturelli, O. Djuric, M. Manica, et al., SARS-CoV-2 transmission patterns in educational settings during the Alpha wave in Reggio-Emilia, Italy, Epidemics, 44 (2023), 100712. https://doi.org/10.1016/j.epidem.2023.100712 doi: 10.1016/j.epidem.2023.100712
|
| [27] |
K.O. Zimmerman, I.C. Akinboyo, M.A. Brookhart, A.E. Boutzoukas, K.A. McGann, M.J. Smith, et al., Incidence and secondary transmission of SARS-CoV-2 infections in schools, Pediatrics, 147 (2021), e2020048090. https://doi.org/10.1542/peds.2020-048090 doi: 10.1542/peds.2020-048090
|
| [28] |
P. van den Berg, E.M. Schechter-Perkins, R.S. Jack, I. Epshtein, R. Nelson, E. Oster, et al., Effectiveness of 3 Versus 6 ft of Physical Distancing for Controlling Spread of Coronavirus Disease 2019 Among Primary and Secondary Students and Staff: A Retrospective, Statewide Cohort Study, Clin. Infect. Dis., 73 (2021), 1871–1878. https://doi.org/10.1093/cid/ciab230 doi: 10.1093/cid/ciab230
|
| [29] |
M. Hast, M. Swanson, C. Scott, E. Oraka, C. Espinosa, E. Burnett, et al., Prevalence of risk behaviors and correlates of SARS-CoV-2 positivity among in-school contacts of confirmed cases in a Georgia school district in the pre-vaccine era, December 2020–January 2021, BMC Public Health, 22 (2022), 101. https://doi.org/10.1186/s12889-021-12347-7 doi: 10.1186/s12889-021-12347-7
|
| [30] |
T. Akaishi, S. Kushimoto, Y. Katori, N. Sugawara, K. Igarashi, M. Fujita, et al., COVID-19 transmission at schools in Japan, Tohoku J. Exp. Med., 255 (2021), 239–246. https://doi.org/10.1620/tjem.255.239 doi: 10.1620/tjem.255.239
|
| [31] |
E. Colosi, G. Bassignana, D.A. Contreras, C. Poirier, P.-Y. Boëlle, S. Cauchemez, et al., Screening and vaccination against COVID-19 to minimise school closure: A modelling study, Lancet Infect. Dis., 22 (2022), 977–989. https://doi.org/10.1016/S1473-3099(22)00138-4 doi: 10.1016/S1473-3099(22)00138-4
|
| [32] |
P. Tupper, C. Colijn, COVID-19 in schools: Mitigating classroom clusters in the context of variable transmission, PLoS Comput. Biol., 17 (2021), e1009120. https://doi.org/10.1371/journal.pcbi.1009120 doi: 10.1371/journal.pcbi.1009120
|
| [33] |
T. Imamura, M. Saito, Y.K. Ko, T. Imamura, K. Otani, H. Akaba, et al., Roles of children and adolescents in COVID-19 transmission in the community: A retrospective analysis of nationwide data in Japan, Front. Pediatr., 9 (2021). https://doi.org/10.3389/fped.2021.705882 doi: 10.3389/fped.2021.705882
|
| [34] |
T. Akaishi, T. Ishii, Coronavirus disease 2019 transmission and symptoms in young children during the severe acute respiratory syndrome coronavirus 2 Delta variant and Omicron variant outbreaks, J. Int. Med. Res., 50 (2022), 03000605221102079. https://doi.org/10.1177/03000605221102079 doi: 10.1177/03000605221102079
|
| [35] |
M. Sasanami, M. Fujimoto, T. Kayano, K. Hayashi, H. Nishiura, Projecting the COVID-19 immune landscape in Japan in the presence of waning immunity and booster vaccination, J. Theor. Biol., 559 (2023), 111384. https://doi.org/10.1016/j.jtbi.2022.111384 doi: 10.1016/j.jtbi.2022.111384
|
| [36] | Ministry of Health Labour and Welfare, Visualizing the data: information on COVID-19 infections, (n.d.). https://covid19.mhlw.go.jp/en/ (accessed September 4, 2024) |
| [37] | Bureau of Social Welfare and Public Health Tokyo Metropolitan Government, Details of announcement of new coronavirus-positive patients in Tokyo, 2023, (n.d.). https://catalog.data.metro.tokyo.lg.jp/dataset/t000010d0000000068 |
| [38] | Alex Selby, Estimating Generation Time Of Omicron - Covid-19, (2022). https://sonorouschocolate.com/covid19/index.php/Estimating_Generation_Time_Of_Omicron (accessed September 4, 2024) |
| [39] | National Institute of Infectious Diseases, Estimation of Incubation Period for SARS-CoV-2 Mutant B.1.1.529 Strain (Omicron Strain): Preliminary Report, 2022, (2022). https://www.niid.go.jp/niid/ja/2019-ncov/2551-cepr/10903-b11529-period.html (accessed September 4, 2024) |
| [40] |
M. Salmon, D. Schumacher, M. Höhle, Monitoring Count Time Series in R: Aberration detection in public health surveillance, J. Stat. Softw., 70 (2016), 1–35. https://doi.org/10.18637/jss.v070.i10 doi: 10.18637/jss.v070.i10
|
| [41] |
C. Fraser, Estimating individual and household reproduction numbers in an emerging epidemic, PLoS One, 2 (2007), e758. https://doi.org/10.1371/journal.pone.0000758 doi: 10.1371/journal.pone.0000758
|
| [42] |
H. Nishiura, Time variations in the transmissibility of pandemic influenza in Prussia, Germany, from 1918–19, Theor. Biol. Med. Model., 4 (2007), 20. https://doi.org/10.1186/1742-4682-4-20 doi: 10.1186/1742-4682-4-20
|
| [43] | H. Nishiura, G. Chowell, The effective reproduction number as a prelude to statistical estimation of time-dependent epidemic trends, in: G. Chowell, J.M. Hyman, L.M.A. Bettencourt, C. Castillo-Chavez (Eds.), Mathematical and Statistical Estimation Approaches in Epidemiology, Springer Netherlands, Dordrecht, 2009: pp. 103–121. https://doi.org/10.1007/978-90-481-2313-1_5 |
| [44] |
T. Sanada, T. Honda, F. Yasui, K. Yamaji, T. Munakata, N. Yamamoto, et al., Serologic survey of IgG against SARS-CoV-2 among hospital visitors without a history of SARS-CoV-2 infection in Tokyo, 2020–2021, J. Epidemiol., 32 (2022), 105–111. https://doi.org/10.2188/jea.JE20210324 doi: 10.2188/jea.JE20210324
|
| [45] | Ministry of Internal Affairs and Communications Statistics Bureau, Statistics Bureau Homepage/Population Estimates/Population Estimates (as of October 1, 2022) - Nationwide: Age (each year), Population by Gender; Prefectures: Age (5-year age groups), Population by Gender. (in Japanese), 2023, (2023). https://www.stat.go.jp/data/jinsui/2022np/index.html (accessed September 4, 2024) |
| [46] | R: The R Project for Statistical Computing, (2023). https://www.r-project.org/ (accessed September 4, 2024) |
| [47] | J. Gabry, R. Češnovar, A. Johnson, S. Bronder, R Interface to CmdStan, (2023). https://mc-stan.org/cmdstanr/ (accessed September 4, 2024) |
| [48] | Stan Development Team, Stan modeling language users guide and reference manual, Version 2.32, 2023, (2023). https://mc-stan.org/ (accessed September 4, 2024) |
| [49] |
L. Casini, M. Roccetti, Reopening Italy's schools in September 2020: A Bayesian estimation of the change in the growth rate of new SARS-CoV-2 cases, BMJ Open, 11 (2021), e051458. https://doi.org/10.1136/bmjopen-2021-051458 doi: 10.1136/bmjopen-2021-051458
|
| [50] |
T. Braeye, L. Catteau, R. Brondeel, J.A.F. van Loenhout, K. Proesmans, L. Cornelissen, et al., Vaccine effectiveness against transmission of alpha, delta and omicron SARS-COV-2-infection, Belgian contact tracing, 2021–2022, Vaccine, 41 (2023), 3292–3300. https://doi.org/10.1016/j.vaccine.2023.03.069 doi: 10.1016/j.vaccine.2023.03.069
|
 mbe-21-09-312_supplementary_final.docx mbe-21-09-312_supplementary_final.docx |
 |
Figures(2) / Tables(1)

Yuta Okada, Hiroshi Nishiura. Vaccine-induced reduction of COVID-19 clusters in school settings in Japan during the epidemic wave caused by B.1.1.529 (Omicron) BA.2, 2022[J]. Mathematical Biosciences and Engineering, 2024, 21(9): 7087-7101. doi: 10.3934/mbe.2024312


 DownLoad: