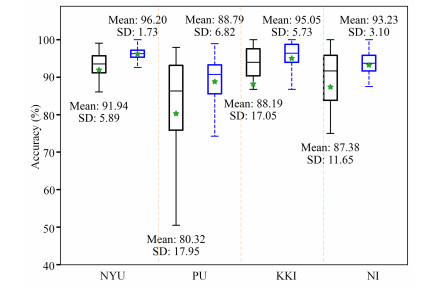
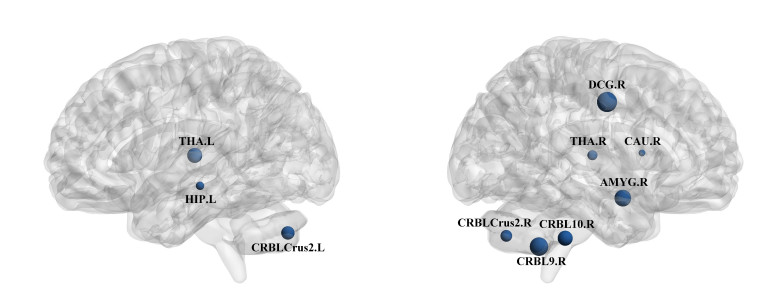
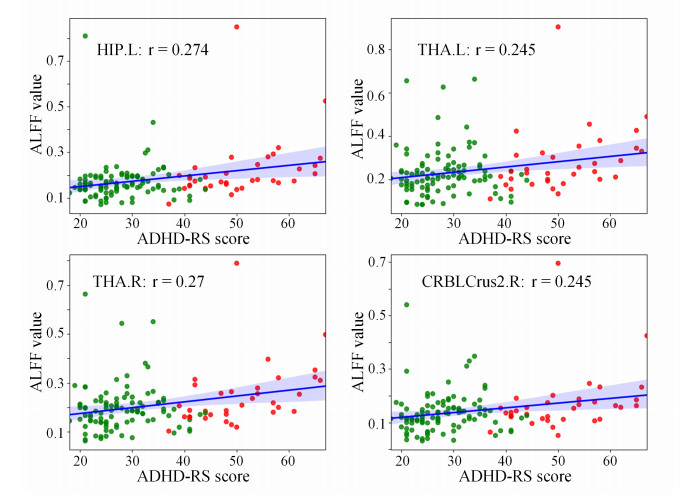
Attention deficit hyperactivity disorder (ADHD) is a common childhood developmental disorder. In recent years, pattern recognition methods have been increasingly applied to neuroimaging studies of ADHD. However, these methods often suffer from limited accuracy and interpretability, impeding their contribution to the identification of ADHD-related biomarkers. To address these limitations, we applied the amplitude of low-frequency fluctuation (ALFF) results for the limbic system and cerebellar network as input data and conducted a binary hypothesis testing framework for ADHD biomarker detection. Our study on the ADHD-200 dataset at multiple sites resulted in an average classification accuracy of 93%, indicating strong discriminative power of the input brain regions between the ADHD and control groups. Moreover, our approach identified critical brain regions, including the thalamus, hippocampal gyrus, and cerebellum Crus 2, as biomarkers. Overall, this investigation uncovered potential ADHD biomarkers in the limbic system and cerebellar network through the use of ALFF realizing highly credible results, which can provide new insights for ADHD diagnosis and treatment.
Citation: Ying Chen, Lele Wang, Zhixin Li, Yibin Tang, Zhan Huan. Unveiling critical ADHD biomarkers in limbic system and cerebellum using a binary hypothesis testing approach[J]. Mathematical Biosciences and Engineering, 2024, 21(4): 5803-5825. doi: 10.3934/mbe.2024256
Attention deficit hyperactivity disorder (ADHD) is a common childhood developmental disorder. In recent years, pattern recognition methods have been increasingly applied to neuroimaging studies of ADHD. However, these methods often suffer from limited accuracy and interpretability, impeding their contribution to the identification of ADHD-related biomarkers. To address these limitations, we applied the amplitude of low-frequency fluctuation (ALFF) results for the limbic system and cerebellar network as input data and conducted a binary hypothesis testing framework for ADHD biomarker detection. Our study on the ADHD-200 dataset at multiple sites resulted in an average classification accuracy of 93%, indicating strong discriminative power of the input brain regions between the ADHD and control groups. Moreover, our approach identified critical brain regions, including the thalamus, hippocampal gyrus, and cerebellum Crus 2, as biomarkers. Overall, this investigation uncovered potential ADHD biomarkers in the limbic system and cerebellar network through the use of ALFF realizing highly credible results, which can provide new insights for ADHD diagnosis and treatment.

| [1] |
G. Polanczyk, P. Jensen, Epidemiologic considerations in attention deficit hyperactivity disorder: A review and update, Child Adolesc. Psychiatr. Clin. N. Am., 17 (2008), 245–260. https://doi.org/10.1016/j.chc.2007.11.006 doi: 10.1016/j.chc.2007.11.006

|
| [2] |
Z. Zhang, G. Li, Y. Xu, X. Tang, Application of artificial intelligence in the MRI classification task of human brain neurological and psychiatric diseases: A scoping review, Diagnostics, 11 (2021), 1402. https://doi.org/10.3390/diagnostics11081402 doi: 10.3390/diagnostics11081402
|
| [3] |
M. Quaak, L. Mortel, R. M. Thomas, G. V. Wingen, Deep learning applications for the classification of psychiatric disorders using neuroimaging data: Systematic review and meta-analysis, Neuroimage Clin., 30 (2021), 102584. https://doi.org/10.1016/j.nicl.2021.102584 doi: 10.1016/j.nicl.2021.102584
|
| [4] |
L. Zou, J. Zheng, C. Miao, M. J. Mckeown, Z. J. Wang, 3D CNN based automatic diagnosis of attention deficit hyperactivity disorder using functional and structural MRI, IEEE Access, 5 (2017), 23626–23636. https://doi.org/10.1109/ACCESS.2017.2762703 doi: 10.1109/ACCESS.2017.2762703
|
| [5] | L. Su, S. I. Kamata, ADHD classification with low-frequency fluctuation feature map based on 3D CBAMe, in Proceedings of the 7th International Conference on Biomedical Signal and Image Processing, ACM, (2022), 74–79. https://doi.org/10.1145/3563737.3563749 |
| [6] |
M. Chen, H. Li, J. Wang, J. R. Dillman, N. A. Parikh, L. He, A multichannel deep neural network model analyzing multiscale functional brain connectome data for attention deficit hyperactivity disorder detection, Radiol. Artif. Intell., 2 (2019), e190012. https://doi.org/10.1148/ryai.2019190012 doi: 10.1148/ryai.2019190012
|
| [7] |
Y. Tang, J. Sun, C. Wang, Y. Zhong, A. Jiang, G. Liu, et al., ADHD classification using auto-encoding neural network and binary hypothesis testing, Artif. Intell. Med., 123 (2022), 102209. https://doi.org/10.1016/j.artmed.2021.102209 doi: 10.1016/j.artmed.2021.102209
|
| [8] |
Y. Sun, L. Zhao, Z. Lan, X. Jia, S. Xue, Differentiating boys with ADHD from those with typical development based on whole-brain functional connections using a machine learning approach, Neuropsychiatr. Dis. Treat., 16 (2020), 691–702. https://doi.org/10.2147/NDT.S239013 doi: 10.2147/NDT.S239013
|
| [9] |
Y. Zang, Y. He, C. Zhu, Q. Cao, M. Sui, M. Liang, et al., Altered baseline brain activity in children with ADHD revealed by resting-state functional MRI, Brain Dev., 29 (2007), 83–91. https://doi.org/10.1016/j.braindev.2006.07.002 doi: 10.1016/j.braindev.2006.07.002
|
| [10] |
M. Hoogman, J. Bralten, D. P. Hibar, M. Mennes, M. P. Zwiers, L. S. J. Schweren, et al., Subcortical brain volume differences in participants with attention deficit hyperactivity disorder in children and adults: A cross-sectional mega-analysis, Lancet Psychiatry, 4 (2017), 310–319. https://doi.org/10.1016/S2215-0366(17)30049-4 doi: 10.1016/S2215-0366(17)30049-4
|
| [11] |
L. Liu, S. Tang, F. X. Wu, Y. P. Wang, J. Wang, An ensemble hybrid feature selection method for neuropsychiatric disorder classification, IEEE/ACM Trans. Comput. Biol. Bioinf., 19 (2021), 1459–1471. https://doi.org/10.1109/TCBB.2021.3053181 doi: 10.1109/TCBB.2021.3053181
|
| [12] |
J. B. Colby, J. D. Rudie, J. A. Brown, P. K. Douglas, M. S. Cohen, Z. Shehzad, Insights into multimodal imaging classification of ADHD, Front. Syst. Neurosci., 6 (2012), 59. https://doi.org/10.3389/fnsys.2012.00059 doi: 10.3389/fnsys.2012.00059
|
| [13] |
M. Wang, B. Jie, W. Bian, X. Ding, W. Zhou, Z. Wang, et al., Graph-kernel based structured feature selection for brain disease classification using functional connectivity networks, IEEE Access, 7 (2019), 35001–35011. https://doi.org/10.1109/ACCESS.2019.2903332 doi: 10.1109/ACCESS.2019.2903332
|
| [14] |
Y. Zhao, H. Chen, R. T. Ogden, Wavelet-based weighted LASSO and screening approaches in functional linear regression, J. Comput. Graphical Stat., 24 (2015), 655–675. https://doi.org/10.1080/10618600.2014.925458 doi: 10.1080/10618600.2014.925458
|
| [15] | M. Nunez-Garcia, S. Simpraga, M. A. Jurado, M. Garolera, R. Pueyo, L. Igual, FADR: Functional-anatomical discriminative regions for rest fMRI characterization, in Machine Learning in Medical Imaging, Springer, (2015), 61–68. https://doi.org/10.1007/978-3-319-24888-2_8 |
| [16] |
H. W. Loh, C. P. Ooi, P. D. Barua, E. E. Palmer, F. Molinari, U. R. Acharya, Automated detection of ADHD: Current trends and future perspective, Comput. Biol. Med., 146 (2022), 105525. https://doi.org/10.1016/j.compbiomed.2022.105525 doi: 10.1016/j.compbiomed.2022.105525
|
| [17] |
Z. Mao, Y. Su, G. Xu, X. Wang, Y. Huang, W. Yue, et al., Spatio-temporal deep learning method for ADHD fMRI classification, Inf. Sci., 499 (2019), 1–11. https://doi.org/10.1016/j.ins.2019.05.043 doi: 10.1016/j.ins.2019.05.043
|
| [18] |
T. Zhang, C. Li, P. Li, Y. Peng, X. Kang, C. Jiang, et al., Separated channel attention convolutional neural network (SC-CNN-attention) to identify ADHD in multi-site rs-fMRI dataset, Entropy, 22 (2020), 893. https://doi.org/10.3390/e22080893 doi: 10.3390/e22080893
|
| [19] |
Z. Wang, Y. Zhu, H. Shi, Y. Zhang, C. Yan, A 3D multiscale view convolutional neural network with attention for mental disease diagnosis on MRI images, Math. Biosci. Eng., 18 (2021), 6978–6994. https://doi.org/10.3934/mbe.2021347 doi: 10.3934/mbe.2021347
|
| [20] |
N. Qiang, Q. Dong, F. Ge, H. Liang, B. Ge, S. Zhang, et al., Deep variational autoencoder for mapping functional brain networks, IEEE Trans. Cognit. Dev. Syst., 13 (2020), 841–852. https://doi.org/10.1109/TCDS.2020.3025137 doi: 10.1109/TCDS.2020.3025137
|
| [21] |
N. Qiang, Q. Dong, H. Liang, B. Ge, S. Zhang, C. Zhang, et al., A novel ADHD classification method based on resting state temporal templates (RSTT) using spatiotemporal attention auto-encoder, Neural. Comput. Appl., 34 (2022), 7815–7833. https://doi.org/10.1007/s00521-021-06868-w doi: 10.1007/s00521-021-06868-w
|
| [22] |
A. Gyurak, M. S. Goodkind, J. H. Kramer, B. L. Miller, R. W. Levenson, Executive functions and the down-regulation and up-regulation of emotion, Cognit. Emotion, 26 (2012), 103–118. https://doi.org/10.1080/02699931.2011.557291 doi: 10.1080/02699931.2011.557291
|
| [23] |
C. Fu, S. Chen, A. Qian, R. Zhou, J. Zhou, J. Li, et al., Larger thalamus correlated with inattentive severity in the inattentive subtype of ADHD without comorbidity, Psychiatry Res., 304 (2021), 114079. https://doi.org/10.1016/j.psychres.2021.114079 doi: 10.1016/j.psychres.2021.114079
|
| [24] |
G. W. Schrimsher, R. L. Billingsley, E. F. Jackson, B. D. Moore, Caudate nucleus volume asymmetry predicts attention-deficit hyperactivity disorder (ADHD) symptomatology in children, J. Child Neurol., 17 (2002), 877–884. https://doi.org/10.1177/08830738020170122001 doi: 10.1177/08830738020170122001
|
| [25] |
T. Frodl, J. Stauber, N. Schaaff, N. Koutsouleris, J. Scheuerecker, M. Ewers, et al., Amygdala reduction in patients with ADHD compared with major depression and healthy volunteers, Acta Psychiatr. Scand., 121 (2010), 111–118. https://doi.org/10.1111/j.1600-0447.2009.01489.x doi: 10.1111/j.1600-0447.2009.01489.x
|
| [26] |
K. Nickel, L. T. Elst, E. Perlov, R. Jitten-Schachenmeier, D. Beier, D. Endres, et al., Manual morphometry of hippocampus and amygdala in adults with attention-deficit hyperactivity disorder, Psychiatry Res. Neuroimaging, 267 (2017), 32–35. https://doi.org/10.1016/j.pscychresns.2017.07.001 doi: 10.1016/j.pscychresns.2017.07.001
|
| [27] |
K. J. Plessen, R. Bansal, H. Zhu, R. Whiteman, J. Amat, G. A. Quackenbush, et al., Hippocampus and amygdala morphology in attention-deficit/hyperactivity disorder, Arch. Gen. Psychiatry, 63 (2006), 795–807. https://doi.org/10.1001/archpsyc.63.7.795 doi: 10.1001/archpsyc.63.7.795
|
| [28] |
Y. Wang, Q. Xu, S. Li, G. Li, C. Zuo, S. Liao, et al., Gender differences in anomalous subcortical morphology for children with ADHD, Neurosci. Lett., 665 (2018), 176–181. https://doi.org/10.1016/j.neulet.2017.12.006 doi: 10.1016/j.neulet.2017.12.006
|
| [29] |
S. B. Hong, Thalamocortical functional connectivity in youth with attention-deficit/hyperactivity disorder, J. Psychiatry Neurosci., 48 (2023), E50–E60. https://doi.org/10.1503/jpn.220109 doi: 10.1503/jpn.220109
|
| [30] |
J. Posner, F. Siciliano, Z. Wang, J. Liu, E. Sonuga-Barke, L. Greenhill, A multimodal MRI study of the hippocampus in medication-naive children with ADHD: What connects ADHD and depression, Psychiatry Res. Neuroimaging, 224 (2014), 112–118. https://doi.org/10.1016/j.pscychresns.2014.08.006 doi: 10.1016/j.pscychresns.2014.08.006
|
| [31] |
M. M. Bruchhage, M. P. Bucci, E. B. Becker, Cerebellar involvement in autism and ADHD, Handb. Clin. Neurol., 155 (2018), 61–72. https://doi.org/10.1016/B978-0-444-64189-2.00004-4 doi: 10.1016/B978-0-444-64189-2.00004-4
|
| [32] |
M. V. Cherkasova, L. Hechtman, Neuroimaging in attention-deficit hyperactivity disorder: Beyond the frontostriatal circuitry, Can. J. Psychiatry, 54 (2009), 651–664. https://doi.org/10.1177/070674370905401002 doi: 10.1177/070674370905401002
|
| [33] |
G. Bush, Attention-deficit/hyperactivity disorder and attention networks, Neuropsychopharmacology, 35 (2010), 278–300. https://doi.org/10.1038/npp.2009.120 doi: 10.1038/npp.2009.120
|
| [34] |
L. A. Friedman, J. L. Rapoport, Brain development in ADHD, Curr. Opin. Neurobiol., 30 (2015), 106–111. https://doi.org/10.1016/j.conb.2014.11.007 doi: 10.1016/j.conb.2014.11.007
|
| [35] |
Y. Chen, Y. Tang, C. Wang, X. Liu, L. Zhao, Z. Wang, ADHD classification by dual subspace learning using resting-state functional connectivity, Artif. Intell. Med., 103 (2020), 101786. https://doi.org/10.1016/j.artmed.2019.101786 doi: 10.1016/j.artmed.2019.101786
|
| [36] |
Y. Tang, X. Li, Y. Chen, Y. Zhong, A. Jiang, C. Wang, High-accuracy classification of attention deficit hyperactivity disorder with $ l_{2, 1}$-norm linear discriminant analysis and binary hypothesis testing, IEEE Access, 8 (2020), 56228–56237. https://doi.org/10.1109/ACCESS.2020.2982401 doi: 10.1109/ACCESS.2020.2982401
|
| [37] |
Y. Tang, C. Wang, Y. Chen, N. Sun, A. Jiang, Z. Wang, Identifying ADHD individuals from resting-state functional connectivity using subspace clustering and binary hypothesis testing, J. Atten. Disord., 25 (2021), 736–748. https://doi.org/10.1177/1087054719837749 doi: 10.1177/1087054719837749
|
| [38] |
N. Liu, X. Li, E. Qi, M. Xu, L. Li, B. Gao, A novel ensemble learning paradigm for medical diagnosis with imbalanced data, IEEE Access, 8 (2020), 171263–171280. https://doi.org/10.1109/ACCESS.2020.3014362 doi: 10.1109/ACCESS.2020.3014362
|
| [39] |
Q. Yuan, K. Chen, Y. Yu, N. Q. K. Le, M. C. H. Chua, Prediction of anticancer peptides based on an ensemble model of deep learning and machine learning using ordinal positional encoding, Briefings Bioinf., 24 (2023), bbac630. https://doi.org/10.1093/bib/bbac630 doi: 10.1093/bib/bbac630
|
| [40] |
S. Singh, N. Q. K. Le, C. Wang, Vf-pred: Predicting virulence factor using sequence alignment percentage and ensemble learning models, Comput. Biol. Med., 168 (2024), 107662. https://doi.org/10.1016/j.compbiomed.2023.107662 doi: 10.1016/j.compbiomed.2023.107662
|
| [41] |
Y. Qin, Y. Lou, Y. Huang, R. Chen, W. Yue, An ensemble deep learning approach combining phenotypic data and fMRI for ADHD diagnosis, J. Signal Process. Syst., 94 (2022), 1269–1281. https://doi.org/10.1007/s11265-022-01812-0 doi: 10.1007/s11265-022-01812-0
|
| [42] |
B. Miao, L. L. Zhang, J. L. Guan, Q. F. Meng, Y. L. Zhang, Classification of ADHD individuals and neurotypicals using reliable RELIEF: A resting-state study, IEEE Access, 7 (2019), 62163–62171. https://doi.org/10.1109/ACCESS.2019.2915988 doi: 10.1109/ACCESS.2019.2915988
|
| [43] |
L. Shao, Y. Xu, D. Fu, Classification of ADHD with bi-objective optimization, J. Biomed. Inf., 84 (2018), 164–170. https://doi.org/10.1016/j.jbi.2018.07.011 doi: 10.1016/j.jbi.2018.07.011
|
| [44] |
A. Riaz, M. Asad, E. Alonso, G. Slabaugh, Fusion of fMRI and non-imaging data for ADHD classification, Comput. Med. Imaging Graphics, 65 (2018), 115–128. https://doi.org/10.1016/j.compmedimag.2017.10.002 doi: 10.1016/j.compmedimag.2017.10.002
|
| [45] |
A. Riaz, M. Asad, E. Alonso, G. Slabaugh, Deepfmri: End-to-end deep learning for functional connectivity and classification of ADHD using fmri, J. Neurosci. Methods, 335 (2020), 108506. https://doi.org/10.1016/j.jneumeth.2019.108506 doi: 10.1016/j.jneumeth.2019.108506
|
| [46] |
S. Liu, L. Zhao, X. Wang, Q. Xin, J. Zhao, D. S. Guttery, et al., Deep spatio-temporal representation and ensemble classification for attention deficit/hyperactivity disorder, IEEE Trans. Neural Syst. Rehabil. Eng., 29 (2020), 1–10. https://doi.org/10.1109/TNSRE.2020.3019063 doi: 10.1109/TNSRE.2020.3019063
|
| [47] |
S. Pei, C. Wang, S. Cao, Z. Lv, Data augmentation for fmri-based functional connectivity and its application to cross-site adhd classification, IEEE Trans. Instrum. Meas., 72 (2022), 1–15. https://doi.org/10.1109/TIM.2022.3232670 doi: 10.1109/TIM.2022.3232670
|
| [48] |
H. Suzuki, K. N. Botteron, J. L. Luby, A. C. Belden, M. S. Gaffrey, C. M. Babb, et al., Structural-functional correlations between hippocampal volume and cortico-limbic emotional responses in depressed children, Cogn. Affect. Behav. Neurosci., 13 (2013), 135–151. https://doi.org/10.3758/s13415-012-0121-y doi: 10.3758/s13415-012-0121-y
|
| [49] |
V. Vuontela, S. Carlson, A. M. Troberg, T. Fontell, P. Simola, S. Saarinen, et al., Working memory, attention, inhibition, and their relation to adaptive functioning and behavioral/emotional symptoms in school-aged children, Child Psychiatry Hum. Dev., 44 (2013), 105–122. https://doi.org/10.1007/s10578-012-0313-2 doi: 10.1007/s10578-012-0313-2
|
| [50] |
E. M. Valera, S. V. Faraone, K. E. Murray, L. J. Seidman, Meta-analysis of structural imaging findings in attention-deficit/hyperactivity disorder, Biol. Psychiatry, 61 (2007), 1361–1369. https://doi.org/10.1016/j.biopsych.2006.06.011 doi: 10.1016/j.biopsych.2006.06.011
|
| [51] |
T. Frodl, N. Skokauskas, Meta-analysis of structural MRI studies in children and adults with attention deficit hyperactivity disorder indicates treatment effects, Acta Psychiatr. Scand., 125 (2012), 114–126. https://doi.org/10.1111/j.1600-0447.2011.01786.x doi: 10.1111/j.1600-0447.2011.01786.x
|
| [52] |
T. Nakao, J. Radua, K. Rubia, D. Mataix-Cols, Gray matter volume abnormalities in ADHD: Voxel-based meta-analysis exploring the effects of age and stimulant medication, Am. J. Psychiatry, 168 (2011), 1154–1163. https://doi.org/10.1176/appi.ajp.2011.11020281 doi: 10.1176/appi.ajp.2011.11020281
|
| [53] |
I. Ivanov, R. Bansal, X. Hao, H. Zhu, C. Kellendonk, L. Miller, et al., Morphological abnormalities of the thalamus in youths with attention deficit hyperactivity disorder, Am. J. Psychiatry, 167 (2010), 397–408. https://doi.org/10.1176/appi.ajp.2009.09030398 doi: 10.1176/appi.ajp.2009.09030398
|
| [54] |
S. Mackie, P. Shaw, R. Lenroot, R. Pierson, D. K. Greenstein, T. F. Nugent, et al., Cerebellar development and clinical outcome in attention deficit hyperactivity disorder, Am. J. Psychiatry, 164 (2007), 647–655. https://doi.org/10.1176/appi.ajp.164.4.647 doi: 10.1176/appi.ajp.164.4.647
|
| [55] |
F. X. Castellanos, J. N. Giedd, P. C. Berquin, J. M. Walter, W. Sharp, T. Tran, et al., Quantitative brain magnetic resonance imaging in girls with attention-deficit/hyperactivity disorder, Arch. Gen. Psychiatry, 58 (2001), 289–295. https://doi.org/10.1001/archpsyc.58.3.289 doi: 10.1001/archpsyc.58.3.289
|
| [56] |
S. H. Mostofsky, A. L. Reiss, P. Lockhart, M. B. Denckla, Evaluation of cerebellar size in attention-deficit hyperactivity disorder, J. Child Neurol., 13 (1998), 434–439. https://doi.org/10.1177/088307389801300904 doi: 10.1177/088307389801300904
|
| [57] |
J. D. Schmahmann, Disorders of the cerebellum: Ataxia, dysmetria of thought, and the cerebellar cognitive affective syndrome, J. Neuropsychiatry Clin. Neurosci., 16 (2004), 367–378. https://doi.org/10.1176/appi.neuropsych.16.3.367 doi: 10.1176/appi.neuropsych.16.3.367
|
| [58] |
K. P. Schulz, J. Fan, C. Y. Tang, J. H. Newcorn, M. S. Buchsbaum, A. M. Cheung, et al., Response inhibition in adolescents diagnosed with attention deficit hyperactivity disorder during childhood: An event-related FMRI study, Am. J. Psychiatry, 161 (2004), 1650–1657. https://doi.org/10.1176/appi.ajp.161.9.1650 doi: 10.1176/appi.ajp.161.9.1650
|
| [59] |
D. Riva, C. Giorgi, The cerebellum contributes to higher functions during development: Evidence from a series of children surgically treated for posterior fossa tumours, Brain, 123 (2000), 1051–1061. https://doi.org/10.1093/brain/123.5.1051 doi: 10.1093/brain/123.5.1051
|
| [60] |
D. Dong, Q. Ming, X. Wang, W. Yu, Y. Jiang, Q. Wu, et al., Temporoparietal junction hypoactivity during pain-related empathy processing in adolescents with conduct disorder, Front. Psychol., 7 (2017), 231676. https://doi.org/10.3389/fpsyg.2016.02085 doi: 10.3389/fpsyg.2016.02085
|
| [61] |
G. Bush, Cingulate, frontal, and parietal cortical dysfunction in attention-deficit/hyperactivity disorder, Biol. Psychiatryry, 69 (2011), 1160–1167. https://doi.org/10.1016/j.biopsych.2011.01.022 doi: 10.1016/j.biopsych.2011.01.022
|
| [62] |
F. Biondo, C. N. Thunell, B. Xu, C. Chu, T. Jia, A. Ing, et al., Sex differences in neural correlates of common psychopathological symptoms in early adolescence, Psychol. Med., 52 (2022), 3086–3096. https://doi.org/10.1017/S0033291720005140 doi: 10.1017/S0033291720005140
|
| [63] |
K. Jiang, Y. Yi, L. Li, H. Li, H. Shen, F. Zhao, et al., Functional network connectivity changes in children with attention-deficit hyperactivity disorder: A resting-state fMRI study, Int. J. Dev. Neurosci., 78 (2019), 1–6. https://doi.org/10.1016/j.ijdevneu.2019.07.003 doi: 10.1016/j.ijdevneu.2019.07.003
|
Figures(7) / Tables(7)

Ying Chen, Lele Wang, Zhixin Li, Yibin Tang, Zhan Huan. Unveiling critical ADHD biomarkers in limbic system and cerebellum using a binary hypothesis testing approach[J]. Mathematical Biosciences and Engineering, 2024, 21(4): 5803-5825. doi: 10.3934/mbe.2024256


 DownLoad: