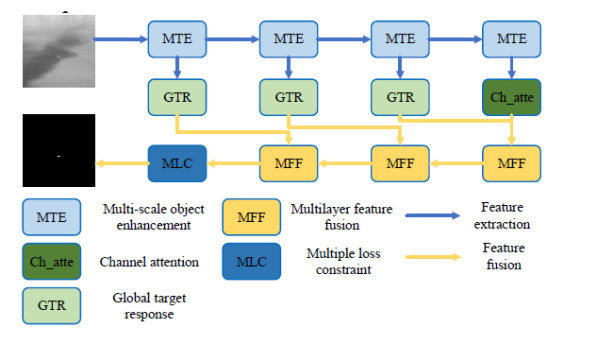
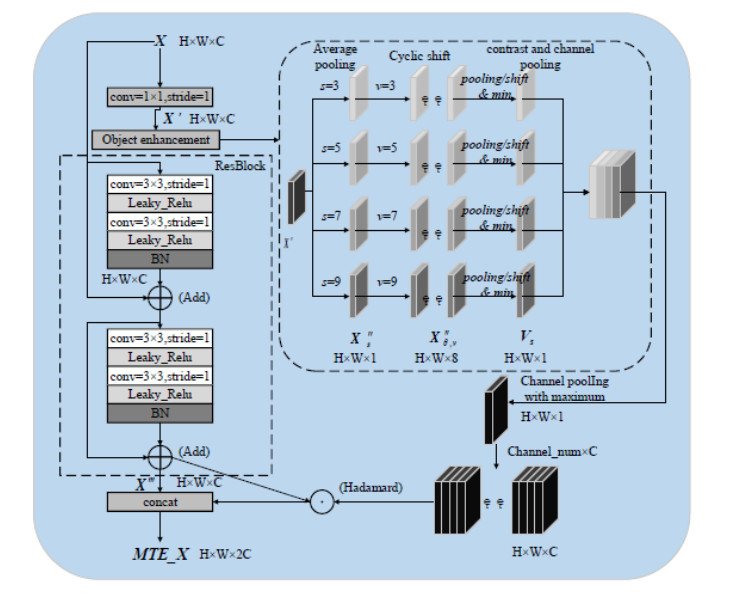
This study proposed an interpretable multi-scale infrared small object detection network (IMD-Net) design method to improve the precision of infrared small object detection and contour segmentation in complex backgrounds. To this end, a multi-scale object enhancement module was constructed, which converted artificially designed features into network structures. The network structure was used to enhance actual objects and extract shallow detail and deep semantic features of images. Next, a global object response, channel attention, and multilayer feature fusion modules were introduced, combining context and channel information and aggregated information, selected data, and decoded objects. Finally, the multiple loss constraint module was constructed, which effectively constrained the network output using multiple losses and solved the problems of high false alarms and high missed detections. Experimental results showed that the proposed network model outperformed local energy factor (LEF), self-regularized weighted sparse model (SRWS), asymmetric contextual modulation (ACM), and other state of the art methods in the intersection-over-union (IoU) and Fmeasure values by 10.8% and 11.3%, respectively. The proposed method performed best on the currently available datasets, achieving accurate detection and effective segmentation of dim and small objects in various infrared complex background images.
Citation: Dawei Li, Suzhen Lin, Xiaofei Lu, Xingwang Zhang, Chenhui Cui, Boran Yang. IMD-Net: Interpretable multi-scale detection network for infrared dim and small objects[J]. Mathematical Biosciences and Engineering, 2024, 21(1): 1712-1737. doi: 10.3934/mbe.2024074
This study proposed an interpretable multi-scale infrared small object detection network (IMD-Net) design method to improve the precision of infrared small object detection and contour segmentation in complex backgrounds. To this end, a multi-scale object enhancement module was constructed, which converted artificially designed features into network structures. The network structure was used to enhance actual objects and extract shallow detail and deep semantic features of images. Next, a global object response, channel attention, and multilayer feature fusion modules were introduced, combining context and channel information and aggregated information, selected data, and decoded objects. Finally, the multiple loss constraint module was constructed, which effectively constrained the network output using multiple losses and solved the problems of high false alarms and high missed detections. Experimental results showed that the proposed network model outperformed local energy factor (LEF), self-regularized weighted sparse model (SRWS), asymmetric contextual modulation (ACM), and other state of the art methods in the intersection-over-union (IoU) and Fmeasure values by 10.8% and 11.3%, respectively. The proposed method performed best on the currently available datasets, achieving accurate detection and effective segmentation of dim and small objects in various infrared complex background images.

| [1] |
S Wu, K Zhang, S Li, J Yan, Joint feature embedding learning and correlation filters for aircraft tracking with infrared imagery, Neurocomputing, 450 (2021), 104–118. https://doi.org/10.1016/j.neucom.2021.04.018 doi: 10.1016/j.neucom.2021.04.018

|
| [2] | N. Zou, J. W. Tian, Research on multi feature fusion infrared ship wake detection method, Comput. Sci., 45 (2018), 172–175. |
| [3] |
C. Deng, S. He, Y. Han, B. Zhao, Learning dynamic spatial-temporal regularization for UAV object tracking, IEEE Signal Process. Lett., 6 (2021), 1230–1234. https://doi.org/10.1109/LSP.2021.3086675 doi: 10.1109/LSP.2021.3086675
|
| [4] |
Y. Han, H. Liu, Y. Wang, C. Liu, A comprehensive review for typical applications based upon unmanned aerial vehicle platform, IEEE J. Sel. Top. Appl. Earth Obs. Remote Sens., 15 (2022), 9654–9666. https://doi.org/10.1109/JSTARS.2022.3216564 doi: 10.1109/JSTARS.2022.3216564
|
| [5] |
Y. Han, H. Wang, Z. Zhang, W. Wang, Boundary-aware vehicle tracking upon UAV, Electron. Lett., 8 (2020), 873–876. https://doi.org/10.1049/el.2020.1170 doi: 10.1049/el.2020.1170
|
| [6] |
X. Liang, L. Liu, M. Luo, Z. Yan, Y. Xin, Robust infrared small object detection using hough line suppression and rank-hierarchy in complex backgrounds, Infrared Phys. Technol., 120 (2022), 103893. https://doi.org/10.1016/j.infrared.2021.103893 doi: 10.1016/j.infrared.2021.103893
|
| [7] | L. Zhong, Y. He, J. W. Zhang, Small object detection algorithm based on the fusion of context and semantic features, Comput. Appl., 42 (2022), 6. |
| [8] |
L. Deng, J. Zhang, G. Xu, H. Zhu, Infrared small object detection via adaptive M-estimator ring top-hat transformation, Patt. Recognit., 112 (2021), 107729. https://doi.org/10.1016/j.patcog.2020.107729 doi: 10.1016/j.patcog.2020.107729
|
| [9] |
Y. Li, Z. Li, C. Zhang, Z. Luo, Y. Zhu, Z. Ding, Infrared maritime dim small object detection based on spatiotemporal cues and directional morphological filtering, Infrared Phys. Technol., 115 (2021), 103657. https://doi.org/10.1016/j.infrared.2021.103657 doi: 10.1016/j.infrared.2021.103657
|
| [10] |
Y. Lu, S. Huang, W. Zhao, Sparse representation based infrared small object detection via an online-learned double sparse background dictionary, Infrared Phys. Technol., 99 (2019), 14–27. https://doi.org/10.1016/j.infrared.2019.04.001 doi: 10.1016/j.infrared.2019.04.001
|
| [11] |
C. Chen, H. Li, Y. Wei, T. Xia, Y. Tang, A local contrast method for small infrared object detection, IEEE Trans. Geosci. Remote Sens., 52 (2013), 574–581. https://doi.org/10.1109/TGRS.2013.2242477 doi: 10.1109/TGRS.2013.2242477
|
| [12] |
L. Zhang, Z. Peng, Infrared small object detection based on partial sum of the tensor nuclear norm, Remote Sens., 11 (2019), 382. https://doi.org/10.3390/rs11040382 doi: 10.3390/rs11040382
|
| [13] |
T. Zhang, Z. Peng, H. Wu, Y. He, C. Li, C. Yang, Infrared small object detection via self-regularized weighted sparse model, Neurocomputing, 420 (2021), 124–148. https://doi.org/10.1016/j.neucom.2020.08.065 doi: 10.1016/j.neucom.2020.08.065
|
| [14] |
Y. Han, C. Deng, B. Zhao, D. Tao, State-aware anti-drift object tracking, IEEE Trans. Image Process., 5 (2019), 4075–4086. https://doi.org/10.1109/TIP.2019.2905984 doi: 10.1109/TIP.2019.2905984
|
| [15] |
I. V. Pustokhina, D. A. Pustokhin, T. Vaiyapuri, D. Gupta, S. Kumar, K. Shankar, An automated deep learning based anomaly detection in pedestrian walkways for vulnerable road users safety, Saf. Sci., 142 (2021), 105356. https://doi.org/10.1016/j.ssci.2021.105356 doi: 10.1016/j.ssci.2021.105356
|
| [16] | S. H. Xie, W. Z. Zhang, P. Cheng, YOLOv4 fire and smoke detection model with embedded channel attention, Chin. J. Liquid Crystal Displ., 36 (2021), 1445–1453. |
| [17] | Y. Dai, Y. Wu, F. Zhou, K. Barnard, Asymmetric contextual modulation for infrared small object detection, in Proceedings of the IEEE/CVF Winter Conference on Applications of Computer Vision, (2021). https://doi.org/10.1109/WACV48630.2021.00099 |
| [18] |
Y. Dai, Y. Wu, F. Zhou, K. Barnard, Attentional local contrast networks for infrared small object detection, IEEE Trans. Geosci. Remote Sens., 59 (2021), 9813–9823. https://doi.org/10.1109/TGRS.2020.3044958 doi: 10.1109/TGRS.2020.3044958
|
| [19] | H. Wang, L. Zhou, L. Wang, Miss detection vs. false alarm: Adversarial learning for small object segmentation in infrared images, in Proceedings of the IEEE/CVF International Conference on Computer Vision, (2019), 8509–8518. https://doi.org/10.1109/ICCV.2019.00860 |
| [20] |
B. Li, C. Xiao, L. Wang, Y. Wang, Z. Lin, M. Li, Dense nested attention network for infrared small target detection, IEEE Trans. Image Process., 32 (2022), 1745–1758. https://doi.org/10.1109/TIP.2022.3199107 doi: 10.1109/TIP.2022.3199107
|
| [21] |
L. Huang, S. Dai, T. Huang, X. Huang, H. Wang, Infrared small object segmentation with multiscale feature representation, Infrared Phys. Technol., 116 (2021), 103755. https://doi.org/10.1016/j.infrared.2021.103755 doi: 10.1016/j.infrared.2021.103755
|
| [22] |
T. Zhang, S. Cao, T. Pu, Z. Peng, AGPCNet: Attention-guided pyramid context networks for infrared small target detection, IEEE Trans. Aerosp. Electron. Syst., 59 (2023), 4250–4261. https://doi.org/10.1109/TAES.2023.3238703 doi: 10.1109/TAES.2023.3238703
|
| [23] | M. Zhang, K. Yue, J. Zhang, Y. Li, X. Gao, Exploring feature compensation and cross-level correlation for infrared small target detection, in Proceedings of the 30th ACM International Conference on Multimedia, (2022), 1857–1865. https://doi.org/10.1145/3503161.3548264 |
| [24] |
Y. Zhang, P. Tiňo, A. Leonardis, K. Tang, A survey on neural network interpretability, IEEE Trans. Emerg. Top Comput. Intell., (2021), 1–17. https://doi.org/10.1109/TETCI.2021.3100641 doi: 10.1109/TETCI.2021.3100641
|
| [25] | Y. Cao, J. Xu, S. Lin, F. Wei, H. Hu, Gcnet: Non-local networks meet squeeze-excitation networks and beyond, in Proceedings of the IEEE/CVF International Conference on Computer Vision Workshops, 2019. https://doi.org/10.48550/arXiv.1904.11492 |
| [26] |
S. K. Ghosh, A. Ghosh, ENResNet: A novel residual neural network for chest X-ray enhancement based COVID-19 detection, Biomed. Signal Process. Control, 72 (2022), 103286. https://doi.org/10.1016/j.bspc.2021.103286 doi: 10.1016/j.bspc.2021.103286
|
| [27] |
W. Li, J. Li, J. Li, Z. Huang, D. Zhou, A lightweight multi-scale channel attention network for image super-resolution, Neurocomputing, 456 (2021), 327–337. https://doi.org/10.1016/j.neucom.2021.05.090 doi: 10.1016/j.neucom.2021.05.090
|
| [28] | X. Wang, K. Yu, S. Wu, J. Gu, Y. Liu, C. Dong, Esrgan: Enhanced super-resolution generative adversarial networks, in Proceedings of the European conference on computer vision (ECCV) workshops, 2018. https://doi.org/10.48550/arXiv.1809.00219 |
| [29] | T. Y. Lin, P. Goyal, R. Girshick, K. He, P. Dollár, Focal loss for dense object detection, in Proceedings of the IEEE international conference on computer vision, 2017. https://doi.org/10.48550/arXiv.1708.02002 |
| [30] |
G. Chen, W. Wang, X. Li, Designing and learning a lightweight network for infrared small target detection via dilated pyramid and semantic distillation, Infrared Phys. Technol., 131 (2023), 104671. https://doi.org/10.1016/j.infrared.2023.104671 doi: 10.1016/j.infrared.2023.104671
|
| [31] |
C. Xia, X. Li, L. Zhao, R. Shu, Infrared small object detection based on multiscale local contrast measure using local energy factor, IEEE Trans. Geosci. Remote Sens., 17 (2019), 157–161. https://doi.org/10.1109/LGRS.2019.2914432 doi: 10.1109/LGRS.2019.2914432
|
| [32] |
J. Han, S. Moradi, I. Faramarzi, C. Liu, H. Zhang, Q. Zhao, A local contrast method for infrared small-target detection utilizing a tri-layer window, IEEE Trans. Geosci. Remote Sens., 17 (2019), 1822–1826. https://doi.org/10.1109/LGRS.2019.2954578 doi: 10.1109/LGRS.2019.2954578
|
| [33] |
S. Huang, Y. Liu, Y. He, T. Zhang, Z. Peng, Structure-adaptive clutter suppression for infrared small object detection: Chain-growth filtering, Remote Sens., 12 (2020), 47. https://doi.org/10.3390/rs12010047 doi: 10.3390/rs12010047
|
Figures(10) / Tables(5)

Dawei Li, Suzhen Lin, Xiaofei Lu, Xingwang Zhang, Chenhui Cui, Boran Yang. IMD-Net: Interpretable multi-scale detection network for infrared dim and small objects[J]. Mathematical Biosciences and Engineering, 2024, 21(1): 1712-1737. doi: 10.3934/mbe.2024074


 DownLoad: