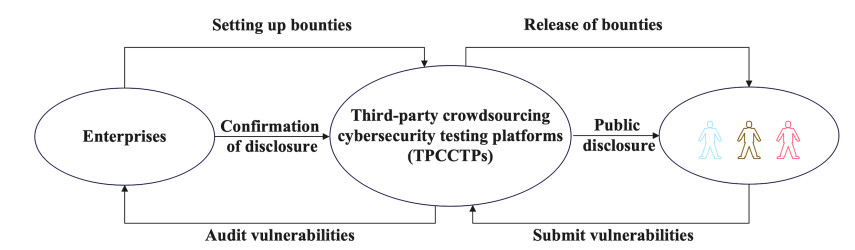
There are various regulatory mechanisms to coordinate vulnerability disclosure behaviors during crowdsourcing cybersecurity testing. However, in the case of unclear regulatory effectiveness, enterprises cannot obtain sufficient vulnerability information, third-party crowdsourcing cybersecurity testing platforms fail to provide trusted services, and the government lacks strong credibility. We have constructed a tripartite evolutionary game model to analyze the evolutionary process of the equilibrium of {legal disclosure, active operation, strict regulation}, and the paper reveals the impact of three regulatory mechanisms. We find that these participants' positive behaviors are in a stable state. Higher initial willingness accelerates the speed of reaching the evolutionary stability of the system, and this equilibrium is satisfied only if the governmental regulatory benefits are sufficiently high. Regarding the punishment mechanism, increased punishment for enterprises causes them to adopt positive behaviors faster, while the opposite occurs for platforms; increased punishment for platforms drives both participants to adopt positive behaviors faster. Concerning the subsidy mechanism, increased subsidy to enterprises causes them to adopt legal disclosure behaviors faster, while platforms remain unresponsive; increased subsidy to platforms motivates both players to choose their own positive behaviors. In terms of the collaborative disclosure mechanism, excessive collaborative costs reduce the platforms' willingness to operate actively, which decreases the enterprises' incentives to disclose vulnerability legally. These findings guide the government to establish suitable mechanisms to regulate the participants' behavior and promote the healthy development of the cybersecurity crowdsourcing industry.
Citation: Liurong Zhao, Xiaoxi Yu, Xinyu Zhou. The impact of regulatory mechanisms on vulnerability disclosure behavior during crowdsourcing cybersecurity testing[J]. Mathematical Biosciences and Engineering, 2023, 20(11): 19012-19039. doi: 10.3934/mbe.2023841
There are various regulatory mechanisms to coordinate vulnerability disclosure behaviors during crowdsourcing cybersecurity testing. However, in the case of unclear regulatory effectiveness, enterprises cannot obtain sufficient vulnerability information, third-party crowdsourcing cybersecurity testing platforms fail to provide trusted services, and the government lacks strong credibility. We have constructed a tripartite evolutionary game model to analyze the evolutionary process of the equilibrium of {legal disclosure, active operation, strict regulation}, and the paper reveals the impact of three regulatory mechanisms. We find that these participants' positive behaviors are in a stable state. Higher initial willingness accelerates the speed of reaching the evolutionary stability of the system, and this equilibrium is satisfied only if the governmental regulatory benefits are sufficiently high. Regarding the punishment mechanism, increased punishment for enterprises causes them to adopt positive behaviors faster, while the opposite occurs for platforms; increased punishment for platforms drives both participants to adopt positive behaviors faster. Concerning the subsidy mechanism, increased subsidy to enterprises causes them to adopt legal disclosure behaviors faster, while platforms remain unresponsive; increased subsidy to platforms motivates both players to choose their own positive behaviors. In terms of the collaborative disclosure mechanism, excessive collaborative costs reduce the platforms' willingness to operate actively, which decreases the enterprises' incentives to disclose vulnerability legally. These findings guide the government to establish suitable mechanisms to regulate the participants' behavior and promote the healthy development of the cybersecurity crowdsourcing industry.

| [1] | Y. S. Pil, The Way Forward for Security Vulnerability Disclosure Policy: Comparative Analysis of US, EU, and Netherlands, (2013), 119–131, https://doi.org/10.1007/978-3-031-19608-9_10 |
| [2] | M. Zhao, A. Laszka, T. Maillart, J. Grossklags, Crowdsourced security vulnerability discovery: Modeling and organizing bug-bounty programs, in The HCOMP Workshop on Mathematical Foundations of Human Computation, Austin, TX, USA, 2016. |
| [3] |
T. Maillart, M. Zhao, J. Grossklags, J. Chuang, Given enough eyeballs, all bugs are shallow? revisiting eric raymond with bug bounty programs, J. Cybersecur., 3 (2017), 81–90. https://doi.org/10.1093/cybsec/tyx008 doi: 10.1093/cybsec/tyx008

|
| [4] | X. Liu, Y. Zhang, H. Zhang, X. Cheng, The practice, achievements, and enlightenment of bug bounty programs of the U.S. department of defense, Natl. Defense Technol., 40 (2019). |
| [5] |
M. Zhao, A. Laszka and J. Grossklags, Devising effective policies for bug-bounty platforms and security vulnerability discovery, J. Inf. Policy, 7 (2017), 372–418. http://doi.org/10.5325/jinfopoli.7.2017.0372 doi: 10.5325/jinfopoli.7.2017.0372
|
| [6] |
U. Ķinis, From responsible disclosure policy (rdp) towards state regulated responsible vulnerability disclosure procedure (hereinafter–rvdp): The latvian approach, Comput. Law Secur. Rev., 34 (2018), 508–522. https://doi.org/10.1016/j.clsr.2017.11.003 doi: 10.1016/j.clsr.2017.11.003
|
| [7] |
A. Arora, R. Telang, H. Xu, Optimal policy for software vulnerability disclosure, Manage. Sci., 54 (2008), 642–656. https://doi.org/10.1287/mnsc.1070.0771 doi: 10.1287/mnsc.1070.0771
|
| [8] |
A. M. Algarni, Y. K. Malaiya, Software vulnerability markets: Discoverers and buyers, Int. J. Comput. Inf. Eng., 8 (2014), 480–490. https://doi.org/10.5281/zenodo.1091516 doi: 10.5281/zenodo.1091516
|
| [9] |
A. Arora, R. Krishnan, R. Telang, Y. Yang, An empirical analysis of software vendors' patch release behavior: impact of vulnerability disclosure, Inf. Syst. Res., 21 (2010), 115–132. https://doi.org/10.1287/isre.1080.0226 doi: 10.1287/isre.1080.0226
|
| [10] | J. Ruohonen, L. Allodi, A bug bounty perspective on the disclosure of web vulnerabilities, preprint, arXiv: 1805.09850. |
| [11] | M. Al-Banna, B. Benatallah, D. Schlagwein, E. Bertino, M. C. Barukh, Friendly hackers to the rescue: How organizations perceive crowdsourced vulnerability discovery, in PACIS, (2018), 230. https://doi.org/https://aisel.aisnet.org/pacis2018 |
| [12] | A. M. Jo, Hackers' self-selection in crowdsourced bug bounty programs, Rev. Econ. Ind., 172 (2020), 83–132. |
| [13] | E. Rudenko, A. Gnatenko, A. Milich, K. Hedgecock, Z. M. Smith, Leveraging ethical hacking in russia: Exploring the design and potential of bug bounty programs, in Stanford US-Russia Forum Journal, 12 (2020). |
| [14] |
A. Dingman, G. Russo, Risk-based vulnerability disclosure: Towards optimal policy, SSRN, 2015 (2015). https://doi.org/10.2139/ssrn.2601191 doi: 10.2139/ssrn.2601191
|
| [15] | A. Arora, R. Krishnan, A. Nandkumar, R. Telang, Y. Yang, Impact of vulnerability disclosure and patch availability-an empirical analysis, in Third Workshop on the Economics of Information Security, 24 (2004), 1268–1287. |
| [16] | J. Radianti, Eliciting information on the vulnerability black market from interviews, in 2010 Fourth International Conference on Emerging Security Information, Systems and Technologies, (2010), 154–159. https://doi.org/10.1109/SECURWARE.2010.33 |
| [17] |
A. Arora, R. Telang, Economics of software vulnerability disclosure, IEEE Secur. Privacy, 3 (2005), 20–25. https://doi.org/10.1109/MSP.2005.12 doi: 10.1109/MSP.2005.12
|
| [18] | A. Ahmed, B. Lee, Organizational learning on bug bounty platforms, in 26th Americas Conference on Information Systems, AMCIS, 2020. |
| [19] |
H. Cavusoglu, H. Cavusoglu, J. Zhang, Security patch management: Share the burden or share the damage?, Manage. Sci., 54 (2008), 657–670. https://doi.org/10.1287/mnsc.1070.0794 doi: 10.1287/mnsc.1070.0794
|
| [20] |
S. Parker, Z. Wu, P. D. Christofides, Cybersecurity in process control, operations, and supply chain, Comput. Chem. Eng., 171 (2023), 108169. https://doi.org/10.1016/j.compchemeng.2023.108169. doi: 10.1016/j.compchemeng.2023.108169
|
| [21] |
A. Arora, A. Nandkumar, R. Telang, Does information security attack frequency increase with vulnerability disclosure? An empirical analysis, Inf. Syst. Front., 8 (2006), 350–362. https://doi.org/10.1007/s10796-006-9012-5 doi: 10.1007/s10796-006-9012-5
|
| [22] |
S. Ransbotham, S. Mitra, J. Ramsey, Are markets for vulnerabilities effective?, MIS Q., 36 (2012), 43–64. https://doi.org/10.2307/41410405 doi: 10.2307/41410405
|
| [23] |
E. Rescorla, Is finding security holes a good idea?, IEEE Secur. Privacy, 3 (2005), 14–19. https://doi.org/10.1109/MSP.2005.17 doi: 10.1109/MSP.2005.17
|
| [24] |
H. Cavusoglu, B. Mishra, S. Raghunathan, The effect of internet security breach announcements on market value: Capital market reactions for breached firms and internet security developers, Int. J. Electr. Commer., 9 (2004), 70–104. https://doi.org/10.1080/10864415.2004.11044320 doi: 10.1080/10864415.2004.11044320
|
| [25] |
R. Telang, S. Wattal, An empirical analysis of the impact of software vulnerability announcements on firm stock price, IEEE Trans. Software Eng., 33 (2007), 544–557. https://doi.org/10.1109/TSE.2007.70712 doi: 10.1109/TSE.2007.70712
|
| [26] |
S. Mitra, S. Ransbotham, Information disclosure and the diffusion of information security attacks, Inf. Syst. Res., 26 (2015), 565–584. https://doi.org/10.1287/isre.2015.0587 doi: 10.1287/isre.2015.0587
|
| [27] |
R. Böhme, L. Eckey, T. Moore, N. Narula, T. Ruffing, A. Zohar, Responsible vulnerability disclosure in cryptocurrencies, Commun. ACM, 63 (2020), 62–71. https://doi.org/10.1145/3372115 doi: 10.1145/3372115
|
| [28] | S. P. Gayialis, E. P. Kechagias, G. A. Papadopoulos, E. Kanakis, A smart-contract enabled blockchain traceability system against wine supply chain counterfeiting, in Advances in Production Management Systems. Smart Manufacturing and Logistics Systems: Turning Ideas into Action, (2022), 477–484. https://doi.org/10.1007/978-3-031-16407-1_56 |
| [29] |
S. P. Gayialis, E. P. Kechagias, G. A. Papadopoulos, N. A. Panayiotou, A business process reference model for the development of a wine traceability system, Sustainability, 14 (2022), 11687. https://doi.org/10.3390/su141811687 doi: 10.3390/su141811687
|
| [30] |
E. P. Kechagias, S. P. Gayialis, G. A. Papadopoulos, G. Papoutsis, An ethereum-based distributed application for enhancing food supply chain traceability, Foods, 12 (2023), 1220. https://doi.org/10.3390/foods12061220 doi: 10.3390/foods12061220
|
| [31] |
M. Mijwil, M. Aljanabi, ChatGPT, Towards artificial intelligence-based cybersecurity: The practices and chatgpt generated ways to combat cybercrime, Iraqi J. Comput. Sci. Math., 4 (2023), 65–70. https://doi.org/10.52866/ijcsm.2023.01.01.0019 doi: 10.52866/ijcsm.2023.01.01.0019
|
| [32] |
A. T. Chatfield, C. G. Reddick, Crowdsourced cybersecurity innovation: The case of the pentagon's vulnerability reward program, Inf. Polity, 23 (2018), 177–194. https://doi.org/https://doi.org/10.3233/IP-170058 doi: 10.3233/IP-170058
|
| [33] |
K. Kannan, R. Telang, Market for software vulnerabilities? think again, Manage. Sci., 51 (2005), 726–740. https://doi.org/10.1287/mnsc.1040.0357 doi: 10.1287/mnsc.1040.0357
|
| [34] | C. Pascariu, Getting started with vulnerability disclosure and bug bounty programs, Int. J. Inf. Secur. Cyber., 11 (2022), 25–30. https://www.ceeol.com/search/article-detail?id=1096780 |
| [35] | M. Zhao, J. Grossklags, K. Chen, An exploratory study of white hat behaviors in a web vulnerability disclosure program, in Proceedings of the 2014 ACM workshop on security information workers, (2014), 51–58. https://doi.org/10.1145/2663887.2663906 |
| [36] |
T. L. Huber, T. A. Fischer, J. Dibbern, R. Hirschheim, A process model of complementarity and substitution of contractual and relational governance in is outsourcing, J. Manage. Inf. Syst., 30 (2013), 81–114. https://doi.org/10.2753/MIS0742-1222300304 doi: 10.2753/MIS0742-1222300304
|
| [37] |
J. T. Lind, H. Mehlum, With or without u? the appropriate test for a u-shaped relationship*, Oxford Bull. Econ. Stat., 72 (2010), 109–118. https://doi.org/10.1111/j.1468-0084.2009.00569.x doi: 10.1111/j.1468-0084.2009.00569.x
|
| [38] | D. Luna, L. Allodi, M. Cremonini, Productivity and patterns of activity in bug bounty programs: Analysis of hackerone and google vulnerability research, in Proceedings of the 14th International Conference on Availability, Reliability and Security, (2019), 1–10. https://doi.org/10.1145/3339252.3341495 |
| [39] | M. Finifter, D. Akhawe, D. A. Wagner, An empirical study of vulnerability rewards programs, in Proceedings of the 22nd USENIX Conference on Security, (2013), 273–288. |
| [40] |
J. Zhou, S. Wang, C. P. Bezemer, Y. Zou, A. E. Hassan, Studying the association between bountysource bounties and the issue-addressing likelihood of github issue reports, IEEE Trans. Software Eng., 47 (2021), 2919–2933. http://doi.org/10.1109/TSE.2020.2974469 doi: 10.1109/TSE.2020.2974469
|
| [41] | D. Votipka, R. Stevens, E. Redmiles, J. Hu, M. Mazurek, Hackers vs. testers: A comparison of software vulnerability discovery processes, in 2018 IEEE Symposium on Security and Privacy (SP), (2018), 374–391. http://doi.org/10.1109/SP.2018.00003 |
| [42] | A. Ahmed, B. Lee, A. V. Deokar, The role of vulnerability disclosure on hacker participation in bug bounty programs, in ICIS 2021 Proceedings, (2021), 14. |
| [43] |
Q. Xiong, Y. Zhu, Z. Zeng, X. Yang, Signal game analysis between software vendors and third-party platforms in collaborative disclosure of network security vulnerabilities, Complexity, 2023 (2023), 1027215. http://doi.org/10.1155/2023/1027215 doi: 10.1155/2023/1027215
|
| [44] |
L. Xu, Y. Li, Q. Yao, Information security investment and purchase decision for personalized products, Managerial Decis. Econ., 43 (2022), 2619–2635. https://doi.org/10.1002/mde.3551 doi: 10.1002/mde.3551
|
| [45] |
T. Walshe, A. Simpson, Coordinated vulnerability disclosure programme effectiveness: Issues and recommendations, Comput. Secur., 123 (2022), 102936 https://doi.org/10.1016/j.cose.2022.102936 doi: 10.1016/j.cose.2022.102936
|
| [46] |
Q. Xiong, S. Lian, Z. Zeng, An empirical analysis of vulnerability information disclosure impact on patch r & d of software vendors, J. Intell. Fuzzy Syst., 44 (2023), 839–853. https://doi.org/10.3233/JIFS-221316 doi: 10.3233/JIFS-221316
|
| [47] | S. Atefi, A. Sivagnanam, A. Ayman, J. Grossklags, A. Laszka, The benefits of vulnerability discovery and bug bounty programs: Case studies of chromium and firefox, in Proceedings of the ACM Web Conference 2023, (2023), 2209–2219. https://doi.org/10.1145/3543507.3583352 |
| [48] | S. A. McCartney, A Framework to Assess Bug-Bounty Platforms Based on Potential Attack Vectors, PhD thesis, Montana State University-Bozeman, College of Engineering, 2022. |


Figures(12) / Tables(3)

Liurong Zhao, Xiaoxi Yu, Xinyu Zhou. The impact of regulatory mechanisms on vulnerability disclosure behavior during crowdsourcing cybersecurity testing[J]. Mathematical Biosciences and Engineering, 2023, 20(11): 19012-19039. doi: 10.3934/mbe.2023841


 DownLoad: