Burns constitute one of the most common injuries in the world, and they can be very painful for the patient. Especially in the judgment of superficial partial thickness burns and deep partial thickness burns, many inexperienced clinicians are easily confused. Therefore, in order to make burn depth classification automated as well as accurate, we have introduced the deep learning method. This methodology uses a U-Net to segment burn wounds. On this basis, a new thickness burn classification model that fuses global and local features (GL-FusionNet) is proposed. For the thickness burn classification model, we use a ResNet50 to extract local features, use a ResNet101 to extract global features, and finally implement the add method to perform feature fusion and obtain the deep partial or superficial partial thickness burn classification results. Burns images are collected clinically, and they are segmented and labeled by professional physicians. Among the segmentation methods, the U-Net used achieved a Dice score of 85.352 and IoU score of 83.916, which are the best results among all of the comparative experiments. In the classification model, different existing classification networks are mainly used, as well as a fusion strategy and feature extraction method that are adjusted to conduct experiments; the proposed fusion network model also achieved the best results. Our method yielded the following: accuracy of 93.523, recall of 93.67, precision of 93.51, and F1-score of 93.513. In addition, the proposed method can quickly complete the auxiliary diagnosis of the wound in the clinic, which can greatly improve the efficiency of the initial diagnosis of burns and the nursing care of clinical medical staff.
Citation: Zhiwei Li, Jie Huang, Xirui Tong, Chenbei Zhang, Jianyu Lu, Wei Zhang, Anping Song, Shizhao Ji. GL-FusionNet: Fusing global and local features to classify deep and superficial partial thickness burn[J]. Mathematical Biosciences and Engineering, 2023, 20(6): 10153-10173. doi: 10.3934/mbe.2023445
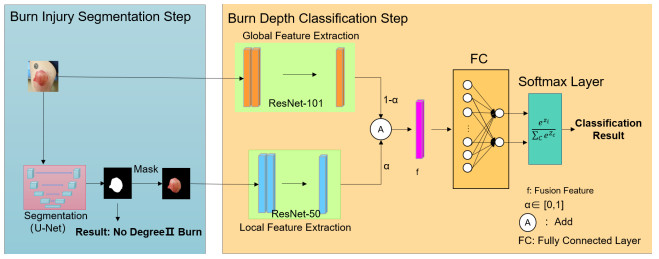
Burns constitute one of the most common injuries in the world, and they can be very painful for the patient. Especially in the judgment of superficial partial thickness burns and deep partial thickness burns, many inexperienced clinicians are easily confused. Therefore, in order to make burn depth classification automated as well as accurate, we have introduced the deep learning method. This methodology uses a U-Net to segment burn wounds. On this basis, a new thickness burn classification model that fuses global and local features (GL-FusionNet) is proposed. For the thickness burn classification model, we use a ResNet50 to extract local features, use a ResNet101 to extract global features, and finally implement the add method to perform feature fusion and obtain the deep partial or superficial partial thickness burn classification results. Burns images are collected clinically, and they are segmented and labeled by professional physicians. Among the segmentation methods, the U-Net used achieved a Dice score of 85.352 and IoU score of 83.916, which are the best results among all of the comparative experiments. In the classification model, different existing classification networks are mainly used, as well as a fusion strategy and feature extraction method that are adjusted to conduct experiments; the proposed fusion network model also achieved the best results. Our method yielded the following: accuracy of 93.523, recall of 93.67, precision of 93.51, and F1-score of 93.513. In addition, the proposed method can quickly complete the auxiliary diagnosis of the wound in the clinic, which can greatly improve the efficiency of the initial diagnosis of burns and the nursing care of clinical medical staff.

| [1] | M. D. Peck, M. Jeschke, K. Collins, Epidemiology of burn injuries globally, Burns, 37 (2011), 1087–1274. |
| [2] |
M. G. Jeschke, G. G. Gauglitz, G. A. Kulp, C. C. Finnerty, F. N. Williams, R. Kraft, et al., Long-term persistance of the pathophysiologic response to severe burn injury, PLoS One, 6 (2011), 21245. https://doi.org/10.1371/journal.pone.0021245 doi: 10.1371/journal.pone.0021245

|
| [3] |
Y. Wang, J. Beekman, J. Hew, S. Jackson, A. C. Issler-Fisher, R. Parungao, et al., Burn injury: challenges and advances in burn wound healing, infection, pain and scarring, Adv. Drug Deliv. Rev., 123 (2018), 3–17. https://doi.org/10.1016/j.addr.2017.09.018 doi: 10.1016/j.addr.2017.09.018
|
| [4] |
D. Herndon, F. Zhang, W. Lineaweaver, Metabolic responses to severe burn injury, Ann. Plast. Surg., 88 (2022), 128–131. https://doi.org/10.1097/SAP.0000000000003142 doi: 10.1097/SAP.0000000000003142
|
| [5] |
A. E. Stoica, C. Chircov, A. M. Grumezescu, Hydrogel dressings for the treatment of burn wounds: An up-to-date overview, Materials, 13 (2020), 2853. https://doi.org/10.3390/ma13122853 doi: 10.3390/ma13122853
|
| [6] |
C. Crouzet, J. Q. Nguyen, A. Ponticorvo, N. P. Bernal, A. J. Durkin, B. Choi, Acute discrimination between superficial-partial and deep-partial thickness burns in a preclinical model with laser speckle imaging, Burns, 41 (2015), 1058–1063. https://doi.org/10.1016/j.burns.2014.11.018 doi: 10.1016/j.burns.2014.11.018
|
| [7] |
S. Monstrey, H. Hoeksema, J. Verbelen, A. Pirayesh, P. Blondeel, Assessment of burn depth and burn wound healing potential, Burns, 34 (2008), 761–769. https://doi.org/10.1016/j.burns.2008.01.009 doi: 10.1016/j.burns.2008.01.009
|
| [8] |
S. Hettiaratchy, R. Papini, Initial management of a major burn: Ⅱ—assessment and resuscitation, BMJ, 329 (2004), 101–103. https://doi.org/10.1136/bmj.329.7457.101 doi: 10.1136/bmj.329.7457.101
|
| [9] |
F. S. E. Moura, K. Amin, C. Ekwobi, Artificial intelligence in the management and treatment of burns: a systematic review, Burns Trauma, 9 (2021). https://doi.org/10.1093/burnst/tkab022 doi: 10.1093/burnst/tkab022
|
| [10] |
H. A. Phelan, J. H. Holmes IV, W. L. Hickerson, C. J. Cockerell, J. W. Shupp, J. E. Carter, Use of 816 consecutive burn wound biopsies to inform a histologic algorithm for burn depth categorization, J. Burn Care Res., 42 (2021), 1162–1167. https://doi.org/10.1093/jbcr/irab158 doi: 10.1093/jbcr/irab158
|
| [11] |
T. Schulz, J. Marotz, S. Seider, S. Langer, S. Leuschner, F. Siemers, Burn depth assessment using hyperspectral imaging in a prospective single center study, Burns, 48 (2022), 1112–1119. https://doi.org/10.1016/j.burns.2021.09.010 doi: 10.1016/j.burns.2021.09.010
|
| [12] |
A. G. Monea, K. Baeck, E. Verbeken, I. Verpoest, J. V. Sloten, J. Goffin, et al., The biomechanical behaviour of the bridging vein-superior sagittal sinus complex with implications for the mechanopathology of acute subdural haematoma, J. Mech. Behav. Biomed. Mater., 32 (2014), 155–165. https://doi.org/10.1016/j.jmbbm.2013.12.007 doi: 10.1016/j.jmbbm.2013.12.007
|
| [13] |
M. D. Cirillo, R. Mirdell, F. Sjöberg, T. D. Pham, Improving burn depth assessment for pediatric scalds by ai based on semantic segmentation of polarized light photography images, Burns, 47 (2021), 1586–1593. https://doi.org/10.1016/j.burns.2021.01.011 doi: 10.1016/j.burns.2021.01.011
|
| [14] |
N. Brunetti, M. Calabrese, C. Martinoli, A. S. Tagliafico, Artificial intelligence in breast ultrasound: from diagnosis to prognosis-a rapid review, Diagnostics, 13 (2022), 58. https://doi.org/10.3390/diagnostics13010058 doi: 10.3390/diagnostics13010058
|
| [15] |
S. A. Suha, T. F. Sanam, A deep convolutional neural network-based approach for detecting burn severity from skin burn images, Mach. Learn Appl., 9 (2022), 100371. https://doi.org/10.1016/j.mlwa.2022.100371 doi: 10.1016/j.mlwa.2022.100371
|
| [16] |
C. T. Tchapga, T. A. Mih, A. T. Kouanou, T. F. Fonzin, P. K. Fogang, B. A. Mezatio, et al., Biomedical image classification in a big data architecture using machine learning algorithms, J. Healthc. Eng., 2021 (2021), 1–11. https://doi.org/10.1155/2021/9998819 doi: 10.1155/2021/9998819
|
| [17] |
T. S. Hai, L. M. Triet, L. H. Thai, N. T. Thuy, Real time burning image classification using support vector machine, EAI Endorsed Trans. Context-aware Syst. Appl, 4 (2017), 4. http://doi.org/10.4108/eai.6-7-2017.152760 doi: 10.4108/eai.6-7-2017.152760
|
| [18] |
U. Şevik, E. Karakullukçu, T. Berber, Y. Akbaş, S. Türkyílmaz, Automatic classification of skin burn colour images using texture-based feature extraction, IET Image Process., 13 (2019), 2018–2028. https://doi.org/10.1049/iet-ipr.2018.5899 doi: 10.1049/iet-ipr.2018.5899
|
| [19] |
D. P. Yadav, A. Sharma, M. Singh, A. Goyal, Feature extraction based machine learning for human burn diagnosis from burn images, IEEE J. Transl. Eng. Health. Med., 7 (2019), 1–7. https://doi.org/10.1109/JTEHM.2019.2923628 doi: 10.1109/JTEHM.2019.2923628
|
| [20] |
S. Lee, H. Ye, D. Chittajallu, U. Kruger, T. Boyko, J. K. Lukan, et al., Real-time burn classification using ultrasound imaging, Sci. Rep., 10 (2020), 1–13. https://doi.org/10.1038/s41598-020-62674-9 doi: 10.1038/s41598-020-62674-9
|
| [21] |
H. Liu, K. Yue, S. Cheng, W. Li, Z. Fu, A framework for automatic burn image segmentation and burn depth diagnosis using deep learning, Comput. Math. Methods Med., 2021 (2021). https://doi.org/10.1155/2021/5514224 doi: 10.1155/2021/5514224
|
| [22] | J. Karthik, G. S. Nath, A. Veena, Deep learning-based approach for skin burn detection with multi-level classification, in Advances in Computing and Network Communications: Proceedings of CoCoNet 2020, 2 (2021), 31–40. https://doi.org/10.1007/978-981-33-6987-0_3 |
| [23] |
C. Pabitha, B. Vanathi, Densemask RCNN: A hybrid model for skin burn image classification and severity grading, Neural Process Lett., 53 (2021), 319–337. https://doi.org/10.1007/s11063-020-10387-5 doi: 10.1007/s11063-020-10387-5
|
| [24] |
A. Abubakar, H. Ugail, K. M. Smith, A. M. Bukar, A. Elmahmudi, Burns depth assessment using deep learning features, J. Med. Biol. Eng., 40 (2020), 923–933. https://doi.org/10.1007/s40846-020-00574-z doi: 10.1007/s40846-020-00574-z
|
| [25] |
C. Jiao, K. Su, W. Xie, Z. Ye, Burn image segmentation based on mask regions with convolutional neural network deep learning framework: more accurate and more convenient, Burns Trauma., 7 (2019). https://doi.org/10.1186/s41038-018-0137-9 doi: 10.1186/s41038-018-0137-9
|
| [26] |
W. Sun, R. Wang, Fully convolutional networks for semantic segmentation of very high resolution remotely sensed images combined with DSM, IEEE Geosci. Remote Sens. Lett., 15 (2018), 474–478. https://doi.org/10.1109/LGRS.2018.2795531 doi: 10.1109/LGRS.2018.2795531
|
| [27] | O. Ronneberger, P. Fischer, T. Brox, U-net: Convolutional networks for biomedical image segmentation, in International Conference on Medical Image Computing and Computer-Assisted Intervention, 9351 (2015), 234–241. https://doi.org/10.1007/978-3-319-24574-4_28 |
| [28] |
X. Liu, Z. Guo, J. Cao, J. Tang, Mdc-net: A new convolutional neural network for nucleus segmentation in histopathology images with distance maps and contour information, Comput. Biol. Med., 135 (2021), 104543. https://doi.org/10.1016/j.compbiomed.2021.104543 doi: 10.1016/j.compbiomed.2021.104543
|
| [29] |
J. He, Q. Zhu, K. Zhang, P. Yu, J. Tang, An evolvable adversarial network with gradient penalty for covid-19 infection segmentation, Appl. Soft Comput., 113 (2021), 107947. https://doi.org/10.1016/j.asoc.2021.107947 doi: 10.1016/j.asoc.2021.107947
|
| [30] |
N. Mu, H. Wang, Y. Zhang, J. Jiang, J. Tang, Progressive global perception and local polishing network for lung infection segmentation of covid-19 ct images, Pattern Recognit., 120 (2021), 108168. https://doi.org/10.1016/j.patcog.2021.108168 doi: 10.1016/j.patcog.2021.108168
|
| [31] |
C. Zhao, A. Vij, S. Malhotra, J. Tang, H. Tang, D. Pienta, et al., Automatic extraction and stenosis evaluation of coronary arteries in invasive coronary angiograms, Comput. Biol. Med., 136 (2021), 104667. https://doi.org/10.1016/j.compbiomed.2021.104667 doi: 10.1016/j.compbiomed.2021.104667
|
| [32] | K. He, X. Zhang, S. Ren, J. Sun, Deep residual learning for image recognition, in 2016 IEEE Conference on Computer Vision and Pattern Recognition (CVPR), (2016), 770–778. https://doi.org/10.1109/CVPR.2016.90 |
| [33] |
K. H. Zou, S. K. Warfield, A. Bharatha, C. M. Tempany, M. R. Kaus, S. J. Haker, et al., Statistical validation of image segmentation quality based on a spatial overlap index1: scientific reports, Acad. Radiol., 11 (2004), 178–189. https://doi.org/10.1016/S1076-6332(03)00671-8 doi: 10.1016/S1076-6332(03)00671-8
|


Figures(7) / Tables(8)

Zhiwei Li, Jie Huang, Xirui Tong, Chenbei Zhang, Jianyu Lu, Wei Zhang, Anping Song, Shizhao Ji. GL-FusionNet: Fusing global and local features to classify deep and superficial partial thickness burn[J]. Mathematical Biosciences and Engineering, 2023, 20(6): 10153-10173. doi: 10.3934/mbe.2023445


 DownLoad: