Research article

Mathematical modeling of SARS-nCoV-2 virus in Tamil Nadu, South India


  • The purpose of this paper is to build a mathematical model for the study of the roles of lock-down, social distancing, vaccination, detection efficiency, and health care capacity planning of the COVID-19 pandemic taking into account the demographic topology of the State of Tamil Nadu, India. Two mathematical models are proposed for the evolution of the first and second wave of COVID-19 pandemic. The model for the first wave considers lock-down orders, social distancing measures, and detection efficiency. The model for the second wave considers more sub-populations and incorporates two more elements, vaccination and health care capacity. Daily reported data on the evolution of the COVID-19 pandemic are used to determine the parameter values. The dynamics produced by the mathematical model closely follow the evolution of COVID-19 in the State of Tamil Nadu. Numerical simulation shows that the lock-down effect is limited. Social distancing implementation and detection of positive cases are relatively ineffective compared with other big cities. Shortage of health care resources is one of the factors responsible for rapidly spreading in the second wave in Tamil Nadu.

    Citation: Avinash Shankaranarayanan, Hsiu-Chuan Wei. Mathematical modeling of SARS-nCoV-2 virus in Tamil Nadu, South India[J]. Mathematical Biosciences and Engineering, 2022, 19(11): 11324-11344. doi: 10.3934/mbe.2022527

    Related Papers:

    [1] Akhil Kumar Srivastav, Pankaj Kumar Tiwari, Prashant K Srivastava, Mini Ghosh, Yun Kang . A mathematical model for the impacts of face mask, hospitalization and quarantine on the dynamics of COVID-19 in India: deterministic vs. stochastic. Mathematical Biosciences and Engineering, 2021, 18(1): 182-213. doi: 10.3934/mbe.2021010
    [2] Rahat Zarin, Usa Wannasingha Humphries, Amir Khan, Aeshah A. Raezah . Computational modeling of fractional COVID-19 model by Haar wavelet collocation Methods with real data. Mathematical Biosciences and Engineering, 2023, 20(6): 11281-11312. doi: 10.3934/mbe.2023500
    [3] Fang Wang, Lianying Cao, Xiaoji Song . Mathematical modeling of mutated COVID-19 transmission with quarantine, isolation and vaccination. Mathematical Biosciences and Engineering, 2022, 19(8): 8035-8056. doi: 10.3934/mbe.2022376
    [4] Yangyang Yu, Yuan Liu, Shi Zhao, Daihai He . A simple model to estimate the transmissibility of the Beta, Delta, and Omicron variants of SARS-COV-2 in South Africa. Mathematical Biosciences and Engineering, 2022, 19(10): 10361-10373. doi: 10.3934/mbe.2022485
    [5] Matthew Hayden, Bryce Morrow, Wesley Yang, Jin Wang . Quantifying the role of airborne transmission in the spread of COVID-19. Mathematical Biosciences and Engineering, 2023, 20(1): 587-612. doi: 10.3934/mbe.2023027
    [6] Qinghua Liu, Siyu Yuan, Xinsheng Wang . A SEIARQ model combine with Logistic to predict COVID-19 within small-world networks. Mathematical Biosciences and Engineering, 2023, 20(2): 4006-4017. doi: 10.3934/mbe.2023187
    [7] A. M. Elaiw, Raghad S. Alsulami, A. D. Hobiny . Global dynamics of IAV/SARS-CoV-2 coinfection model with eclipse phase and antibody immunity. Mathematical Biosciences and Engineering, 2023, 20(2): 3873-3917. doi: 10.3934/mbe.2023182
    [8] Zita Abreu, Guillaume Cantin, Cristiana J. Silva . Analysis of a COVID-19 compartmental model: a mathematical and computational approach. Mathematical Biosciences and Engineering, 2021, 18(6): 7979-7998. doi: 10.3934/mbe.2021396
    [9] Sarafa A. Iyaniwura, Rabiu Musa, Jude D. Kong . A generalized distributed delay model of COVID-19: An endemic model with immunity waning. Mathematical Biosciences and Engineering, 2023, 20(3): 5379-5412. doi: 10.3934/mbe.2023249
    [10] Hamdy M. Youssef, Najat A. Alghamdi, Magdy A. Ezzat, Alaa A. El-Bary, Ahmed M. Shawky . A new dynamical modeling SEIR with global analysis applied to the real data of spreading COVID-19 in Saudi Arabia. Mathematical Biosciences and Engineering, 2020, 17(6): 7018-7044. doi: 10.3934/mbe.2020362
  • The purpose of this paper is to build a mathematical model for the study of the roles of lock-down, social distancing, vaccination, detection efficiency, and health care capacity planning of the COVID-19 pandemic taking into account the demographic topology of the State of Tamil Nadu, India. Two mathematical models are proposed for the evolution of the first and second wave of COVID-19 pandemic. The model for the first wave considers lock-down orders, social distancing measures, and detection efficiency. The model for the second wave considers more sub-populations and incorporates two more elements, vaccination and health care capacity. Daily reported data on the evolution of the COVID-19 pandemic are used to determine the parameter values. The dynamics produced by the mathematical model closely follow the evolution of COVID-19 in the State of Tamil Nadu. Numerical simulation shows that the lock-down effect is limited. Social distancing implementation and detection of positive cases are relatively ineffective compared with other big cities. Shortage of health care resources is one of the factors responsible for rapidly spreading in the second wave in Tamil Nadu.


    1. Introduction

    Nucleosomes contain histone octamers around which DNA is wrapped [1]. Neighboring nucleosomes are separated by unwrapped linker DNA. Generally, a nucleosome's position with respect to the gene promoter plays an important role in yeast gene expression [2,3,4,5]. Nucleosome arrangement is also specific to an organism [6].

    Trichostatin A (TSA) is a histone deacetylase inhibitor that promotes histone acetylation, which induces hyperacetylation of histones [7]. TSA influences nucleosome structure via histone acetylation. In addition, TSA influences nucleosome positions in the filamentous ascomycete Aspergillus fumigatus [8]. The acetylation and deacetylation of histones play an important role in the regulation of transcription [9]. Our previous study showed that TSA influences gene expression and nucleosome position in the archiascomycete Saitoella complicata [10]. Our study identified a total of 154 genes upregulated in a concentration-dependent manner in response to TSA treatment, whereas 131 genes were identified to be increasingly downregulated with increasing TSA concentration [10]. Most of nucleosome positions did not change after TSA treatment [10]. The anamorphic and saprobic budding yeast S. complicata, which is classified under Taphrinomycotina, represents the earliest ascomycetous lineage [11,12]. The fission yeast Schizosaccharomyces is also classified under Taphrinomycotina [12].

    In the previous study, we compared the nucleosome positions in 0 and 3 μg/mL TSA [10]. Thus, it was uncertain whether nucleosome position changed in a TSA concentration-dependent manner or not. If nucleosome position did not change in a TSA concentration-dependent manner, at which concentration did the position change? In this study, we investigated whether genes that are known to be regulated in response to TSA treatment also exhibit changes in nucleosome formation at the gene promoters in a TSA concentration-dependent manner.

    In addition, the ascomycetous yeast Saccharomyces cerevisiae spheroplast was reported to enlarge using zymolyase [13,14]. Enlarged spheroplast cells contain multiple nuclei [13]. It was uncertain how the multiple nuclei were maintained. Do nucleosome positions differ in between single nucleus and multiple nuclei? In bacterial enlarged spheroplasts, DNA was replicated and stress response genes were upregulated [15]. We found that S. complicata cells enlarge when grown in minimal SD broth (Takara, Japan) after zymolyase treatment. Thus, we measured the extent of nucleosome formation at the gene promoters in enlarged S. complicatacells and compared them with nucleosome formation levels in TSA-treated cells.


    2. Materials and Method


    2.1. Saitoella complicata culture

    Saitoella complicata NBRC 10748 (= JCM 7358, = IAM 12963; type strain) was cultivated in YM broth (yeast extract, 3 g/L; malt extract, 3 g/L; peptone, 5 g/L; dextrose, 10 g/L) at 25 ℃ for 24 h as a control sample. Afterwards, TSA (1, 2, and 3 μg/mL) was added to the S. complicata culture; cells were subsequently incubated at 25 ℃ for 24 h. For the enlarged spheroplast generation, S. complicata was grown in minimal SD broth (Takara, Japan) at 25 ℃ for 30 h. Harvested cells were centrifuged for 5 min at 3000 rpm and suspended in buffer containing 0.8 M sorbitol and 25 mM phosphate at 25 ℃ for 20 min. Zymolyase 20T (Seikagaku corporation, Japan) was added to the cell suspension; the cells were incubated at 37 ℃ for 60 min. S. complicata cells were harvested, centrifuged for 5 min at 3000 rpm, and cultured in minimal SD broth (adjusted to pH 7.5) at 25 ℃ for 4-7 days.


    2.2. Nucleosomal DNA fragment isolation

    Equal volumes of S. complicata culture and 2% formaldehyde were mixed and incubated for 10 min. Next, 5 mL of 1.25 M glycine was added to the resulting solution. S. complicata cells were collected, washed with 50 mM Tris-EDTA buffer (pH 8), and then suspended in zymolyase buffer (1 M sorbitol, 10 mM DTT, and 50 mM Tris-HCl, pH 8.0). Zymolyase (Seikagaku corporation, Japan) (50 U) was added to the cell suspension, and the resulting solution was incubated at 37 ℃ for 1 h. Cells were collected by centrifugation and suspended in 2.5 mL of zymolyase buffer, after which 1 U of MNase (Takara, Japan) was added. The resulting digestion solution was incubated at 37 ℃ for 30 min, and the reaction was stopped by adding sodium dodecyl sulfate to a final concentration of 1% and EDTA to a final concentration of 10 mM. Proteinase K solution (5 μL) was added to the solution, and the mixture was incubated at 56 ℃ for 1 h. DNA was phenol/chloroform-extracted, ethanol-precipitated, and treated with RNase (Nippon Gene, Japan). Nucleosomal DNA fragments were isolated via electrophoresis on 2% agarose gel. The mononucleosomal DNA band was excised and purified using the QIAquick Gel Extraction Kit (Qiagen, Germany).


    2.3. Quantitative PCR

    In this study, we selected six nucleosome positions in the gene promoters (300 nucleotides upstream of the translational start site) of the following four locus tags: G7K_2351-t1, G7K_2810-t1, G7K_3456-t1, and G7K_5676-t1. G7K_2351-t1 and G7K_2810-t1 encode homologs to 19S proteasome regulatory subunit Rpn3 and 20S proteasome-component α6 subunit Pre5, respectively, and are known to be increasingly downregulated upon treatment with increasing concentrations of TSA [10]. G7K_3456-t1 encodes a homolog to anaphase promoting complex subunit Apc11, whereas the G7K_5676-t1 gene is not homologous to any Schizosaccharomyces pombe protein. G7K_3456-t1 and G7K_5676-t1 are genes that are both upregulated in response to TSA treatment in a concentration-dependent manner [10]. Table 1 and Supplementary Figure 1 list the primers used in this study. We selected the position 5676_0 as an internal control, which showed the same nucleosome formation level between the cells treated with 0 μg/mL and 3 μg/mL TSA (Supplementary Figure 1) [10]. PCR was performed using the following cycling conditions: 1 cycle of 95 ℃ for 600 s and 45 cycles of denaturation (95 ℃ for 10 s), annealing (55 ℃ for 10 s), and extension (72 ℃ for 15 s). After the extension, a melting curve cycle was performed from 60 ℃ to 95 ℃ at 0.1 ℃/s to confirm the absence of non-specific bands. The quantification cycle (Cq) values were obtained using LightCycler Nano Software (Roche, Basel). We calculated the nucleosome formation level using the following formula: 2(Cq value at the position 5676_0 − Cq value at each position).

    Table 1. Primers used in this study.
    Target position Forward (5' to 3') Reverse (5' to 3') Product size (bp)
    2351 ggcaggcagtccaatagagt gagatcaagaggggttcacg 103
    2810_1 gcagtttaacgacgagaaggtt cgcctcggtaataggtattcat 110
    2810_2 ggacaagctcctggtcttcc cccttcaaagcacctcaatc 110
    3456 gagaagctaaccgagcaacttt tggccaattgaacaaacgat 109
    5676_1 tcagcgattccccaagttat gatgagggcgtcgagttc 110
    5676_2 gttcacgaggacagatcagg ggagttcgaaccatctttataacttg 109
    5676_0 (control) gagcgggatgtctttgtgat ctaggcagtcactgggatcg 99
     | Show Table
    DownLoad: CSV
    Figure 1. Phase contrast micrographs of Saitoella complicata. (A) Normal budding cells in minimal SD broth before zymolyase treatment. (B) Enlarged spheroplasts after 112 h of culture in minimal SD broth after zymolyase treatment. Phase contrast microscopy images were obtained using Olympus CKX41; bar = 50 μm.

    We performed analysis of variance (ANOVA) and a pairwise t test with Holm's adjustment using R statistical software (http://www.r-project.org/).


    3. Results and Discussion

    The typical diameter of a Saitoella complicata cell is approximately 5 μm, whereas that of an enlarged spheroplast cultured in minimal SD broth after zymolyase treatment was measured to be approximately 15 μm (Figure 1).

    ANOVA results showed that nucleosome formation levels were not significantly (p > 0.05) different at position 2351 but significantly different (p < 0.05) at the five other positions, namely, 2810_1, 2810_2, 3456, 5676_1, and 5676_2 (Figure 2).

    Figure 2. Comparison of nucleosome formation levels. The degree of nucleosome formation at position 5676_0 (control) is 1. We calculated the degree of nucleosome formation using the following formula: 2(Cq value at the position 5676_0-Cq value at each position). Star indicates p < 0.05 in a pairwise t test with Holm's adjustment.

    Among the five positions, analysis using pairwise ttest with Holm's adjustment showed no significant differences in terms of the degree of nucleosome formation at position 5676_1 (p > 0.05) between normal budding cells (0 μg/mL TSA) and enlarged cells (culture in minimal SD broth). However, significant differences (p < 0.05) in nucleosome formation levels were observed in the four other positions (2810_1, 2810_2, 3456, and 5676_2) (Figure 2). In addition, no significant differences in nucleosome formation were observed between enlarged cells and TSA-treated cells (2 and 3 μg/mL) at positions 2810_1, 2810_2, and 5676_2 (Figure 2). The above results strongly suggest that TSA-treatment and culture in minimal SD broth after zymolyase treatment exert similar effects on nucleosome formation at positions 2810_1, 2810_2, and 5676_2. Further research is necessary to confirm whether enlarged cells exhibit different histone acetylation patterns. Changes in nucleosome formation at the gene promoters can represent a stress response mechanism in cells subjected to spheroplast (zymolyase treatment) and TSA treatment. On the other hand, the degree of nucleosome formation at position 5676_1 was observed to be significantly different between enlarged cells and TSA-treated cells (Figure 2). However, nucleosome formation at this position was not significantly different between normal budding cells and enlarged cells. Thus, the observed nucleosome formation at position 5676_1 is specific to TSA-treated cells.

    Changes in the degree of nucleosome formation appeared to occur in a TSA concentration-dependent manner at positions 3456 (decreasing) and 5676_1 (increasing) (Figure 2). However, no significant differences in nucleosome formation levels were observed between cells treated with 1 and 2 μg/mL TSA and between cells treated with 2 and 3 μg/mL TSA (Figure 2).

    Nucleosome formation at position 5676_1 increased after TSA-treatment (Figure 2). On the other hand, nucleosome formation levels decreased after TSA-treatment at the neighboring position 5676_2 (Figure 2), which strongly suggests that a histone octamer can move from position 5676_2 to 5676_1. Based on the calculated nucleosome formation levels and p values, cells treated with 1 μg/mL TSA evidently showed nucleosome movement (Figure 2). Interestingly, changes in nucleosome position did not occur in enlarged cells, since nucleosome formation was observed only at position 5676_2 (Figure 2).

    In positions 2810_1 and 2810_2 (neighboring regions), nucleosome formation levels decreased as a result of TSA-treatment (Figure 2). This suggests that two histone octamers may be absent at these two positions. The observed nucleosome depletion at position 2810_2 is inconsistent with the results of the previous study (Supplementary Figure 1) and suggests that the nucleosome occupancy at this position is unstable.

    Except for position 2351, nucleosome formation levels in all other positions were significantly different between cells treated with 0 and 1 μg/mL TSA. However, no significant differences were observed between cells treated with 2 and 3 μg/mL TSA. The above results indicate that changes in the nucleosome formation occurred mainly in cells treated with 1 μg/mL TSA but not in cells treated with 2 and 3 μg/mL TSA.


    4. Conclusion

    We demonstrated that although TSA-treatment and zymolyase-treatment are completely different stimulus, TSA-treated cells and enlarged spheroplasts ofSaitoella complicata showed similar changes in nucleosome formation in five out of six gene promoter positions examined in the present study. These results strongly suggest that changes in nucleosome formation could serve as a stress response mechanism of S. complicata cells. Different stressors (TSA and zymolyase treatments) induce similar changes in the patterns of nucleosome formation in gene promoters in S. complicata.


    Acknowledgments

    This work was supported by JSPS KAKENHI grant no. 25440188 and a grant from The Cannon Foundation.


    Conflict of Interest

    The authors declare that there is no conflict of interest regarding the publication of this paper.


    [1] World Health Organization, Naming the coronavirus disease (COVID-19) and the virus that causes it. Available from: https://www.who.int/emergencies/diseases/novel-coronavirus-2019/technical-guidance/naming-the-coronavirus-disease-(covid-2019)-and-the-virus-that-causes-it.
    [2] Coronaviridae Study Group of the International Committee on Taxonomy of Viruses, The species Severe acute respiratory syndrome-related coronavirus: classifying 2019-nCoV and naming it SARS-CoV-2, Nat. Microbiol., 5 (2020), 536–544. https://doi.org/10.1038/s41564-020-0695-z doi: 10.1038/s41564-020-0695-z
    [3] M. Mohammed, H. Syamsudin, S. Al-Zubaidi, A. Sairah, R. Ramli, E. Yusuf, Novel COVID-19 detection and diagnosis system using IOT based smart helmet, Int. J. Psychosoc. Rehabilitation, 24 (2020), 2296–2303. https://doi.org/10.37200/IJPR/V24I7/PR270221 doi: 10.37200/IJPR/V24I7/PR270221
    [4] World Health Organization, WHO Director-General's opening remarks at the media briefing on COVID-19-11 March 2020. Available from: https://www.who.int/dg/speeches/detail/who-director-general-s-openingremarks-at-the-media-briefing-on-covid-19—11- march-2020.
    [5] C. Huang, Y. Wang, X. Li, L. Ren, J. Zhao, Y. Hu, et al, Clinical features of patients infected with 2019 novel coronavirus in Wuhan, China, The lancet, 395 (2020), 497–506. https://doi.org/10.1016/S0140-6736(20)30183-5 doi: 10.1016/S0140-6736(20)30183-5
    [6] H. Lu, C. W. Stratton, Y. W. Tang, Outbreak of pneumonia of unknown etiology in Wuhan, China: The mystery and the miracle, J. Med. Virol., 92 (2020), 401–402. https://doi.org/10.1002/jmv.25678 doi: 10.1002/jmv.25678
    [7] World Health Organization, management of severe acute respiratory infections when novel coronavirus is suspected: what to do and what not to do, Available from: https://www.who.int/csr/disease/coronavirus_infections/InterimGuidance_ClinicalManagem- ent_NovelCoronavirus.
    [8] S. Kashte, A. Gulbake, S. El-Amin, A. Gupta, COVID-19 vaccines: rapid development, implications, challenges and future prospects, Human. Cell, 34 (2021), 1–23. https://doi.org/10.1007/s13577-021-00512-4 doi: 10.1007/s13577-021-00512-4
    [9] T. Balasubramaniam, D. J. Warne, R. Nayak, K. Mengersen, Explainability of the COVID-19 epidemiological model with nonnegative tensor factorization, Int J Data Sci. Anal., 30 (2022), 1–14. https://doi.org/10.1007/s41060-022-00324-1 doi: 10.1007/s41060-022-00324-1
    [10] R. S. Yadav, Mathematical modeling and simulation of SIR model for COVID-2019 epidemic outbreak: A case study of India, INFOCOMP J. Comput. Sci., 19 (2020), 1–9. https://doi.org/10.1101/2020.05.15.20103077 doi: 10.1101/2020.05.15.20103077
    [11] H. Hassen, A. Elaoud, N. Salah, A. Masmoudi, A SIR-Poisson model for COVID-19: evolution and transmission inference in the Maghreb central regions, Arab. J. Sci. Eng.. 46 (2021), 93–102. https://doi.org/10.1007/s13369-020-04792-0
    [12] R. Bhardwaj, A predictive model for the evolution of COVID-19, Trans. Indian Natl. Acad. Eng., 5 (2020), 133–140. https://doi.org/10.1007/s41403-020-00130-w doi: 10.1007/s41403-020-00130-w
    [13] B. Jamshidi, M. Rezaei, S. J. Zargaran, F. Najafi, Mathematical modeling the epicenters of coronavirus disease-2019 (COVID-19) pandemic, Epidemiol. Methods, 9 (2020), 20200009. https://doi.org/10.1515/em-2020-0009 doi: 10.1515/em-2020-0009
    [14] K. Santosh, COVID-19 prediction models and unexploited data, J. Med. Syst., 44 (2021), 170. https://doi.org/10.1007/s10916-020-01645-z doi: 10.1007/s10916-020-01645-z
    [15] A. L. Jenner, A. A. Rosemary, S. Alfonso, V. Crowe, X. Deng, A. P. Smith, et al., COVID-19 virtual patient cohort suggests immune mechanisms driving disease outcomes, Plos Pathog., 17 (2021), e1009753. https://doi.org/10.1371/journal.ppat.1009753 doi: 10.1371/journal.ppat.1009753
    [16] S. Farhang-Sardroodi, C. S. Korosec, S. Gholami, M. Craig, I. R. Moyles, M. S. Ghaemi, et al., Analysis of hostimmunological response of Adenovirus-based COVID-19 vaccines, Vaccines, 9 (2021), 861. https://doi.org/10.3390/vaccines9080861 doi: 10.3390/vaccines9080861
    [17] A. Goyal, E. F. Cardozo-Ojeda, J. T. Schiffer, Potency and timing of antiviral therapy as determinants of duration of SARS-CoV-2 shedding and intensity of inflammatory response, Sci. Adv., 6 (2020), eabc7112. https://www.science.org/doi/10.1126/sciadv.abc7112
    [18] M. Dawoudi, Mathematical modeling approaches to understanding severe acute respiratory syndrome coronavirus 2 (SARSCoV-2) DNA sequences linked coronavirus disease (COVID-19) for discovery of potential new drugs, OAJBS, 2 (2020), 316–317. https://doi.org/10.38125/OAJBS.000173 doi: 10.38125/OAJBS.000173
    [19] M. Wanjau, Mathematical modeling of COVID-19 transmission with mass testing and contact tracing, J. Math., 16 (2020), 55–64.
    [20] J. Ndam, Modelling the impacts of lockdown and isolation on the eradication of COVI-19, Biomath, 9 (2020), 2009107. http://dx.doi.org/10.11145/j.biomath.2020.09.107 doi: 10.11145/j.biomath.2020.09.107
    [21] R. Asempapa, B. Oduro, O. Apenteng, V. Magagula, A COVID-19 mathematical model of at-risk populations with non-pharmaceutical preventive measures: The case of Brazil and South Africa, Infect. Dis. Model., 7 (2022), 45–61. https://doi.org/10.1016/j.idm.2021.11.005 doi: 10.1016/j.idm.2021.11.005
    [22] J. Rojas-Vallejos, Strengths and limitations of mathematical models in pandemics-the case of COVID-19 in Chile, Medwave, 20 (2020), e7874. https://doi.org/10.5867/medwave.2020.03.7874 doi: 10.5867/medwave.2020.03.7874
    [23] M. Alvarez, González-González E, Santiago G, Modeling COVID-19 epidemics in an Excel spreadsheet to enable first-hand accurate predictions of the pandemic evolution in urban areas, Sci. Rep., 11 (2021), 1–12. https://doi.org/10.1038/s41598-021-83697-w doi: 10.1038/s41598-021-83697-w
    [24] S. Baharom, S. Anuar, N. Zolkifly, H. Tahir, The people's behavior change during pandemic of Covid-19; the four aspects of design thinking, in International Conference of Innovation in Media and Visual Design, 502 (2020), 180–186. https://doi.org/10.2991/assehr.k.201202.073
    [25] W. Wolff, C. Martarelli, J. Schüler, M. Bieleke, High boredom proneness and low trait self-control impair adherence to social distancing guidelines during the COVID-19 pandemic, Int. J. Environ. Res. Public Health, 17 (2020), 5420. https://doi.org/10.3390/ijerph17155420 doi: 10.3390/ijerph17155420
    [26] T. Zhao, K. Xuan, C. Sun, Y. Sun, The importance of social distancing policy, J. Public Health, 43 (2021), e269–e269. https://doi.org/10.1093/pubmed/fdaa219 doi: 10.1093/pubmed/fdaa219
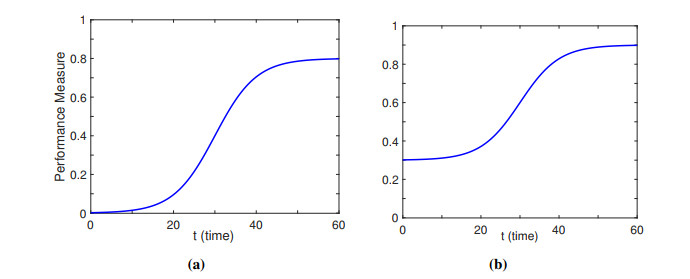
    [27] J. Murre, S-shaped learning curves, Psychon. Bull. Rev., 21 (2014), 344–356. https://doi.org/10.3758/s13423-013-0522-0
    [28] T. Netland, K. Ferdows, The S-curve effect of lean implementation, Prod. Oper. Manag., 25 (2016), 1106–1120. https://doi.org/10.1111/poms.12539 doi: 10.1111/poms.12539
    [29] S. Kaushal, A. Rajput, S. Bhattacharya, M. Vidyasagar, A. Kumar, M. Prakash, et al., Estimating the herd immunity threshold by accounting for the hidden asymptomatics using a COVID-19 specific model. Plos One, 15 (2020), e0242132. https://doi.org/10.1371/journal.pone.0242132
    [30] S. SeyedAlinaghi, L. Abbasian, M. Solduzian, N. A. Yazdi, F. Jafari, A. Adibimehr, et al., Predictors of the prolonged recovery period in COVID-19 patients: a cross-sectional study, Eur. J. Med. Res., 26 (2021). https://doi.org/10.1186/s40001-021-00513-x
    [31] J. Lei, M. Li, X. Wang, Predicting the development trend of the second wave of COVID-19 in five European countries, J. Med. Virol., 93 (2021), 5896–5907. https://doi.org/10.1002/jmv.27143 doi: 10.1002/jmv.27143
    [32] M. Linden, J. Dehning, S. Mohr, J. Mohring, M. Meyer-Hermann, I. Pigeot, Case numbers beyond contact tracing capacity are endangering the containment of COVID-19, Dtsch. Arztebl. Int., 117 (2020), 790–791. https://doi.org/10.3238/arztebl.2020.0790 doi: 10.3238/arztebl.2020.0790
    [33] E. Argulian, Anticipating the "second wave" of health care strain in the covid-19 pandemic, J. Am. Coll. Cardiol. Case Rep., 2 (2020), 845–846. https://doi.org/10.1016/j.jaccas.2020.04.005 doi: 10.1016/j.jaccas.2020.04.005
    [34] S. Vaid, A. McAdie, R. Kremer, V. Khanduja, M. Bhandari, Risk of a second wave of Covid-19 infections: using artificial intelligence to investigate stringency of physical distancing policies in North America, Int. Orthop., 44 (2020), 1581–1589. https://doi.org/10.1007/s00264-020-04653-3 doi: 10.1007/s00264-020-04653-3
    [35] K. R. Nehal, L. M. Steendam, M. C. Ponce, M. van der Hoeven, G. S. A. Smit, Worldwide vaccination willingness for COVID-19: a systematic review and meta-analysis, Vaccines, 9 (2021), 1071. https://doi.org/10.3390/vaccines9101071 doi: 10.3390/vaccines9101071
    [36] C. Lin, P. Tu, L. Beitsch, Confidence and receptivity for COVID-19 vaccines: a rapid systematic review, Vaccines, 9 (2021), 16. https://doi.org/10.3390/vaccines9010016 doi: 10.3390/vaccines9010016
    [37] Q. Wang, L. Yang, H. Jin, L. Lin, Vaccination against COVID-19: A systematic review and meta-analysis of acceptability and its predictors, Prev. Med., (2021), 2021106694. https://doi.org/10.1016/j.ypmed.2021.106694
    [38] JHU CSSE COVID-19 daily reports, accessed on 8 November 2021. Available from: https://github.com/CSSEGISandData/COVID-19/tree/master/csse_covid_19_data/csse_covid_19_ daily_reports
    [39] Daily vaccination reports maintained by our world in data, accessed on 14 December 2021. Available from: https://raw.githubusercontent.com/owid/covid-19-data/master/public/data/vaccinations/vaccinations.csv
    [40] K. Parvathy, Lifestyle as risk factor for breast cancer: a case control study in Chennai, Tamil Nadu, Inida, Int. J. Biol. Sci., 12 (2021), 13–32. https://doi.org/10.53390/ijbs.v12.i1.3 doi: 10.53390/ijbs.v12.i1.3
    [41] J. Nelder, R. Mead, A simplex method for function minimization, Comput. J., 7 (1965), 308–313. https://doi.org/10.1093/COMJNL/7.4.308 doi: 10.1093/COMJNL/7.4.308
    [42] T. Luzyanina, S. Mrusek, J. T. Edwards, D. Roose, S. Ehl, G. Bocharov, et al., Computational analysis of CFSE proliferation assay, J. Math. Biol., 54 (2007), 57–89. https://doi.org/10.1007/s00285-006-0046-6 doi: 10.1007/s00285-006-0046-6
    [43] C. Chakraborty, A. Sharma, M. Bhattacharya, G. Agoramoorthy, S. Lee, The current second wave and COVID-19 vaccination status in India, Brain Behav. Immun., 96 (2021), 1–4. https://doi.org/10.1016/j.bbi.2021.05.018 doi: 10.1016/j.bbi.2021.05.018
    [44] C. Cai, Y. Peng, E. Shen, Q. Huang, Y. Chen, P. Liu, et al., A comprehensive analysis of the efficacy and safety of COVID-19 vaccines, Mol. Ther., 29 (2021), 2794–2805. https://doi.org/10.1016/j.ymthe.2021.08.001 doi: 10.1016/j.ymthe.2021.08.001
    [45] F. Polack, S. Thomas, N. Kitchin, J. Absalon, A. Gurtman, S. Lockhart, J. Perez, Safety and efficacy of the BNT162b2 mRNA Covid-19 vaccine, N. Engl. J. Med., 383 (2020), 2603–2615. https://doi.org/10.1056/NEJMoa2034577 doi: 10.1056/NEJMoa2034577
    [46] V. Jain, K. Iyengar, R. Vaishya, Differences between First wave and Second wave of COVID-19 in India, Diabetes Metab. Syndr., 15 (2021), 1047–1048. https://doi.org/10.1016/j.dsx.2021.05.009 doi: 10.1016/j.dsx.2021.05.009
  • This article has been cited by:

    1. Karan Thakkar, Julia Regazzini Spinardi, Jingyan Yang, Moe H. Kyaw, Egemen Ozbilgili, Carlos Fernando Mendoza, Helen May Lin Oh, Impact of vaccination and non-pharmacological interventions on COVID-19: a review of simulation modeling studies in Asia, 2023, 11, 2296-2565, 10.3389/fpubh.2023.1252719
  • Reader Comments
  • © 2022 the Author(s), licensee AIMS Press. This is an open access article distributed under the terms of the Creative Commons Attribution License (http://creativecommons.org/licenses/by/4.0)
通讯作者: 陈斌, bchen63@163.com
  • 1. 

    沈阳化工大学材料科学与工程学院 沈阳 110142

  1. 本站搜索
  2. 百度学术搜索
  3. 万方数据库搜索
  4. CNKI搜索

Metrics

Article views(2631) PDF downloads(78) Cited by(1)

Article outline

Other Articles By Authors

/

DownLoad:  Full-Size Img  PowerPoint
Return
Return

Catalog