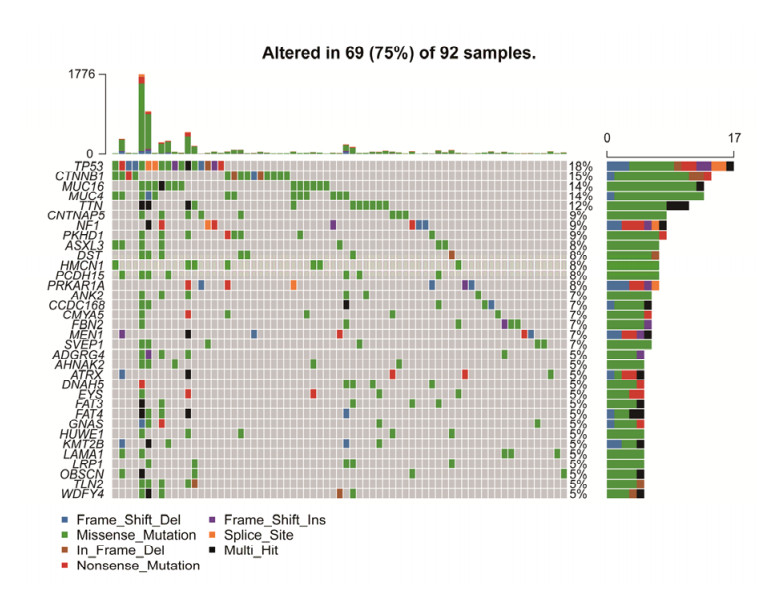
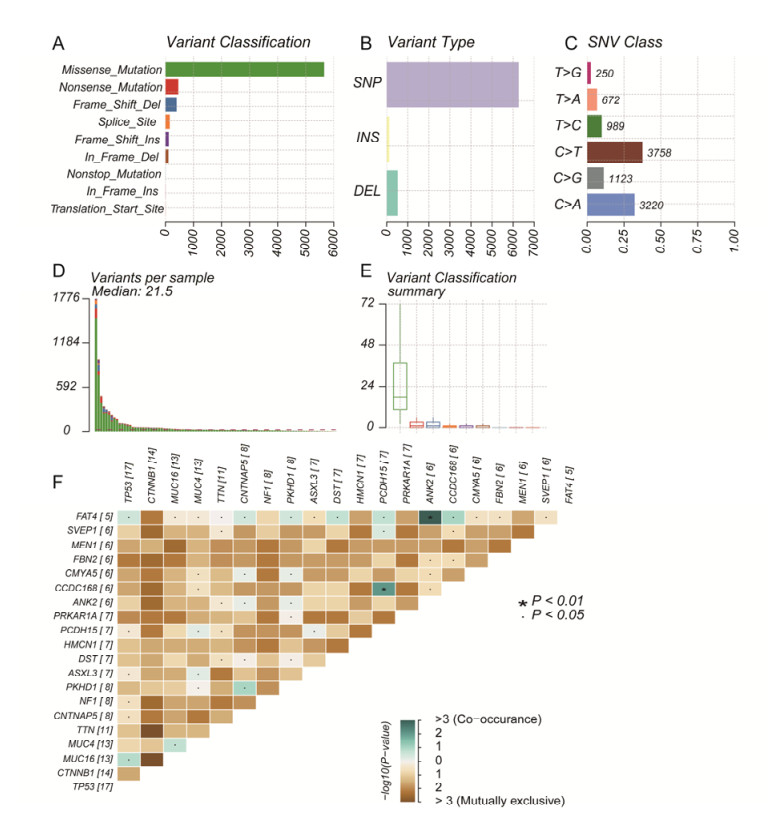
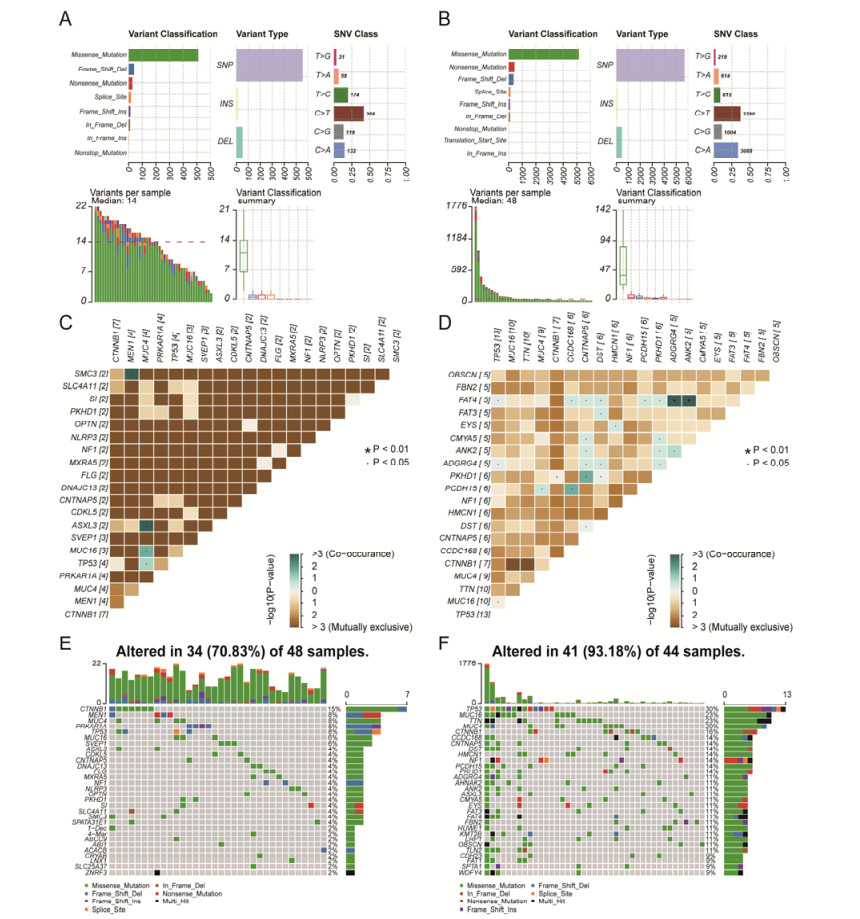
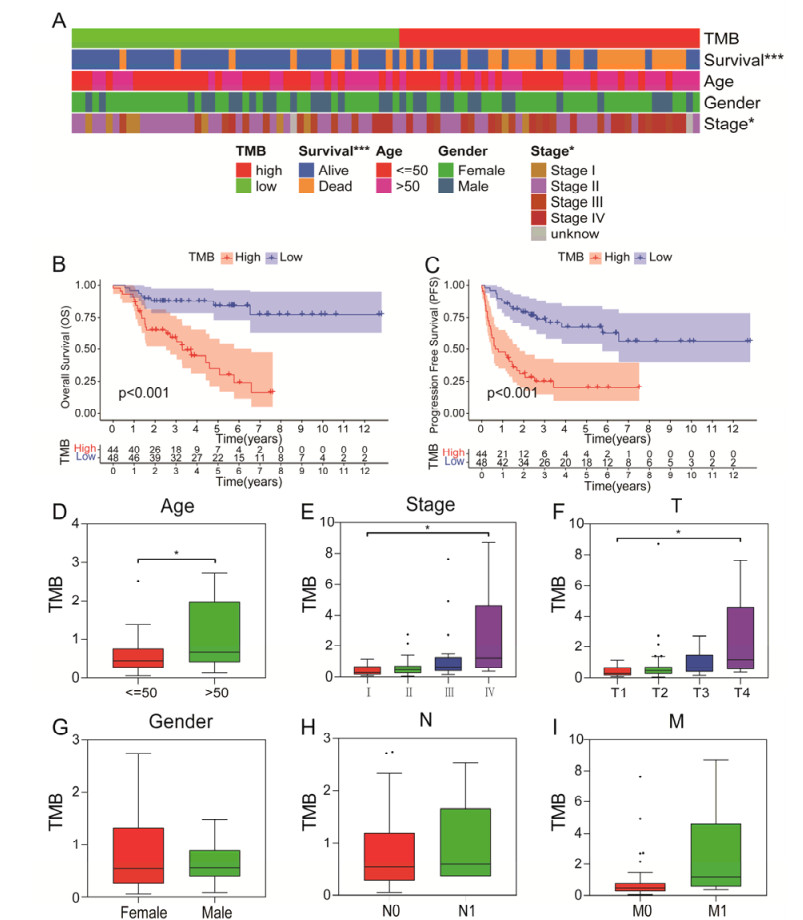
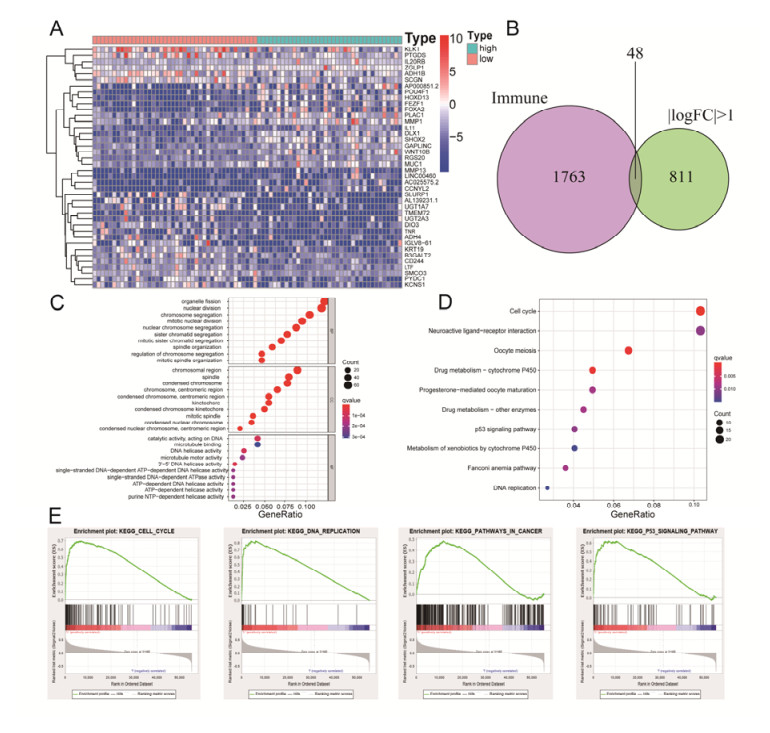
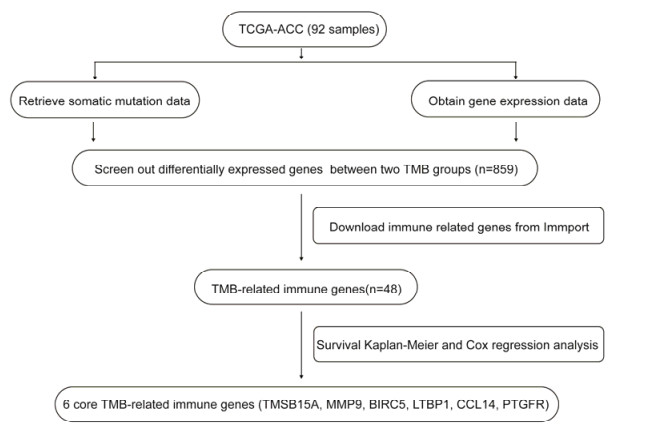
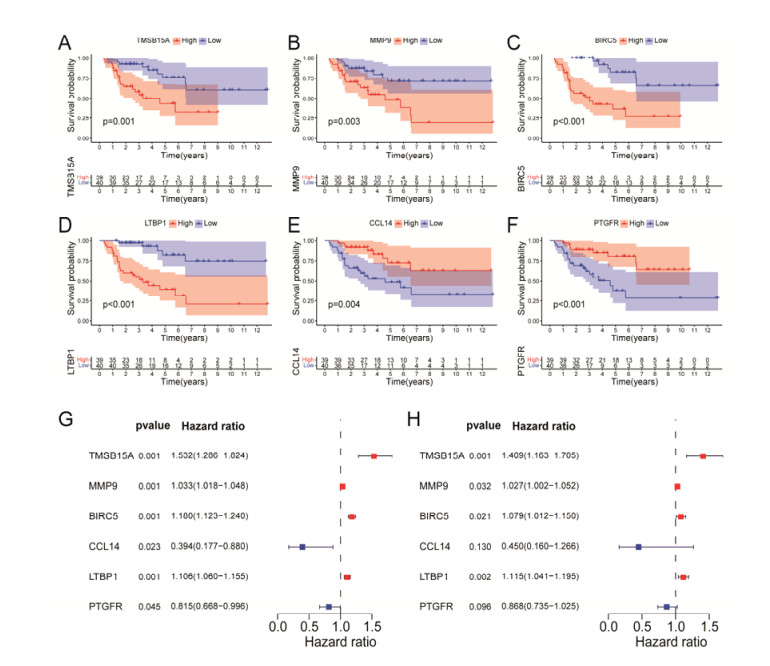
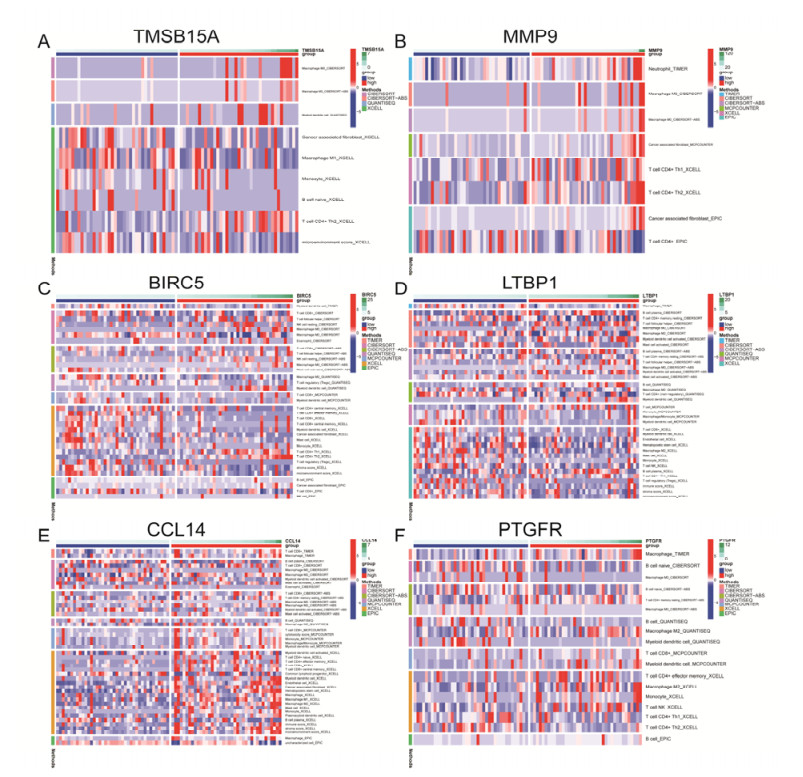
Tumor mutation burden (TMB), an emerging molecular determinant, is accompanied by microsatellite instability and immune infiltrates in various malignancies. However, whether TMB is related to the prognosis or immune responsiveness of adrenocortical carcinoma (ACC) remains to be elucidated. This paper aims to investigate the impact of TMB on the prognosis and immune microenvironment infiltration in ACC. The somatic mutation data, gene expression profile, and corresponding clinicopathological information were retrieved from TCGA. The mutation landscape was summarized and visualized with the waterfall diagram. The ACC patients were divided into low and high TMB groups based on the median TMB value and differentially expressed genes (DEGs) between the two groups were identified. Diverse functional analyses were conducted to determine the functionality of the DEGs. The immune cell infiltration signatures were evaluated based on multiple algorithms. Eventually, a TMB Prognostic Signature (TMBPS) was established and its predictive accuracy for ACC was evaluated. Single nucleotide polymorphism and C > T were found to be more common than other missense mutations. In addition, lower TMB levels indicated improved survival outcomes and were correlated with younger age and earlier clinical stage. Functional analysis suggested that DEGs were primarily related to the cell cycle, DNA replication, and cancer progression. Additionally, significant differences in infiltration levels of activated CD4+ T cells, naive B cells, and activated NK cells were observed in two TMB groups. We also found that patients with higher TMBPS showed worse survival outcomes, which was validated in the Gene Expression Omnibus database. Our study systematically analyzed the mutation and identified a TMBPS combined with immune microenvironment infiltration in ACC. It is expected that this paper can promote the development of ACC treatment strategies.
Citation: Yong Luo, Qingbiao Chen, Jingbo Lin. Identification and validation of a tumor mutation burden-related signature combined with immune microenvironment infiltration in adrenocortical carcinoma[J]. Mathematical Biosciences and Engineering, 2022, 19(7): 7055-7075. doi: 10.3934/mbe.2022333
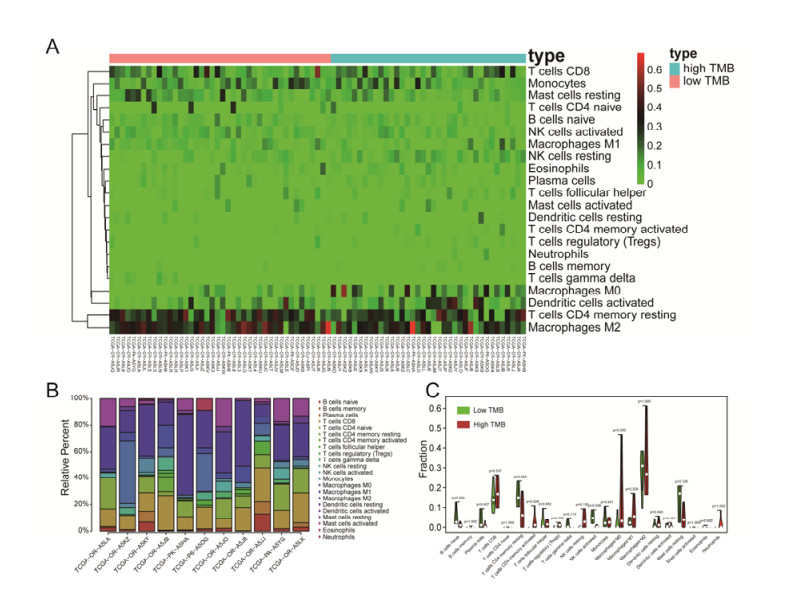
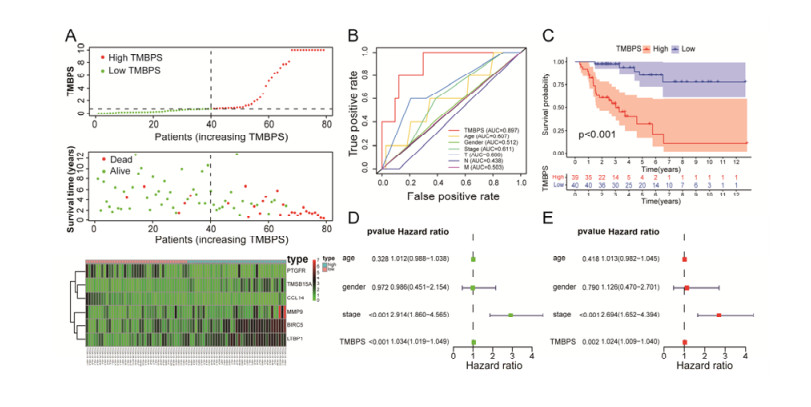
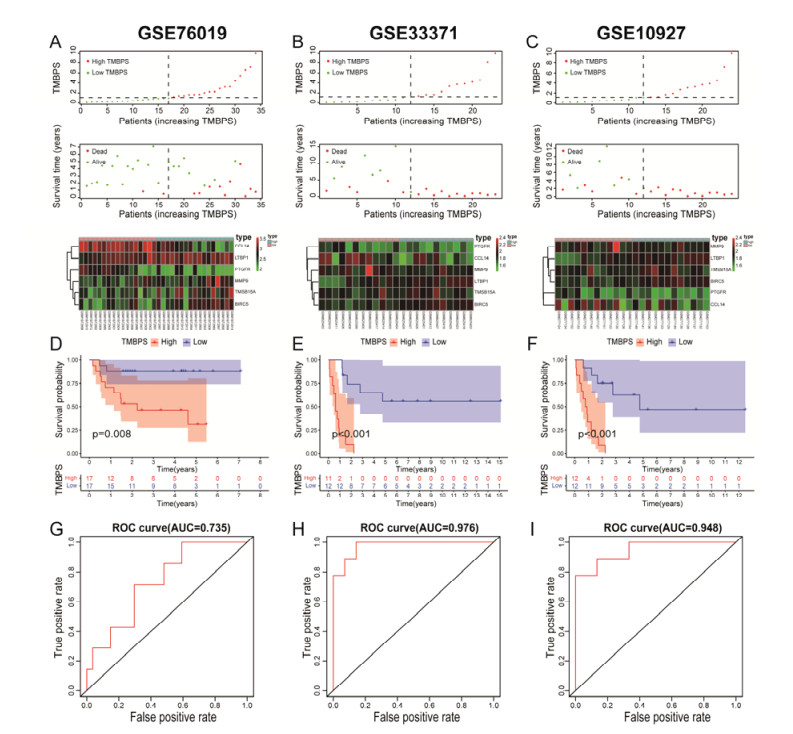
Tumor mutation burden (TMB), an emerging molecular determinant, is accompanied by microsatellite instability and immune infiltrates in various malignancies. However, whether TMB is related to the prognosis or immune responsiveness of adrenocortical carcinoma (ACC) remains to be elucidated. This paper aims to investigate the impact of TMB on the prognosis and immune microenvironment infiltration in ACC. The somatic mutation data, gene expression profile, and corresponding clinicopathological information were retrieved from TCGA. The mutation landscape was summarized and visualized with the waterfall diagram. The ACC patients were divided into low and high TMB groups based on the median TMB value and differentially expressed genes (DEGs) between the two groups were identified. Diverse functional analyses were conducted to determine the functionality of the DEGs. The immune cell infiltration signatures were evaluated based on multiple algorithms. Eventually, a TMB Prognostic Signature (TMBPS) was established and its predictive accuracy for ACC was evaluated. Single nucleotide polymorphism and C > T were found to be more common than other missense mutations. In addition, lower TMB levels indicated improved survival outcomes and were correlated with younger age and earlier clinical stage. Functional analysis suggested that DEGs were primarily related to the cell cycle, DNA replication, and cancer progression. Additionally, significant differences in infiltration levels of activated CD4+ T cells, naive B cells, and activated NK cells were observed in two TMB groups. We also found that patients with higher TMBPS showed worse survival outcomes, which was validated in the Gene Expression Omnibus database. Our study systematically analyzed the mutation and identified a TMBPS combined with immune microenvironment infiltration in ACC. It is expected that this paper can promote the development of ACC treatment strategies.

| [1] |
J. Crona, F. Beuschlein, Adrenocortical carcinoma—towards genomics guided clinical care, Nat. Rev. Endocrinol., 15 (2019), 548-560. https://doi.org/10.1038/s41574-019-0221-7 doi: 10.1038/s41574-019-0221-7

|
| [2] |
G. G. F. Ranvier, W. B. R. Inabnet, Surgical management of adrenocortical carcinoma, Endocrinol. Metab. Clin., 44 (2015), 435-452. https://doi.org/10.1016/j.ecl.2015.02.008 doi: 10.1016/j.ecl.2015.02.008
|
| [3] |
N. Georgantzoglou, S. Kokkali, G. Tsourouflis, S. Theocharis, Tumor microenvironment in adrenocortical carcinoma: Barrier to immunotherapy success, Cancers, 13 (2021), 1798. https://doi.org/10.3390/cancers13081798 doi: 10.3390/cancers13081798
|
| [4] |
M. Fassnacht, S. Johanssen, M. Quinkler, P. Bucsky, H. S. Willenberg, F. Beuschlein, et al., Limited prognostic value of the 2004 international union against cancer staging classification for adrenocortical carcinoma: Proposal for a revised TNM classification, Cancer, 115 (2009), 243-250. https://doi.org/10.1002/cncr.24030 doi: 10.1002/cncr.24030
|
| [5] |
G. Assié, A. Jouinot, M. Fassnacht, R. Libé, S. Garinet, L. Jacob, et al., Value of molecular classification for prognostic assessment of adrenocortical carcinoma, JAMA Oncol., 5 (2019), 1440-1447. https://doi.org/10.1001/jamaoncol.2019.1558 doi: 10.1001/jamaoncol.2019.1558
|
| [6] |
P. Zhao, L. Li, X. Jiang, Q. Li, Mismatch repair deficiency/microsatellite instability-high as a predictor for anti-PD-1/PD-L1 immunotherapy efficacy, J. Hematol. Oncol., 12 (2019), 54. https://doi.org/10.1186/s13045-019-0738-1 doi: 10.1186/s13045-019-0738-1
|
| [7] |
S. T. Paijens, A. Vledder, M. de Bruyn, H. W. Nijman, Tumor-infiltrating lymphocytes in the immunotherapy era, Cell. Mol. Immunol., 18 (2021), 842-859. https://doi.org/10.1038/s41423-020-00565-9 doi: 10.1038/s41423-020-00565-9
|
| [8] |
T. A. Chan, M. Yarchoan, E. Jaffee, C. Swanton, S. A. Quezada, A. Stenzinger, et al., Development of tumor mutation burden as an immunotherapy biomarker: Utility for the oncology clinic, Ann. Oncol., 30 (2019), 44-56. https://doi.org/10.1093/annonc/mdy495 doi: 10.1093/annonc/mdy495
|
| [9] |
S. E. Stanton, M. L. Disis, Clinical significance of tumor-infiltrating lymphocytes in breast cancer, J. Immunother. Cancer, 4 (2016), 59. https://doi.org/10.1186/s40425-016-0165-6 doi: 10.1186/s40425-016-0165-6
|
| [10] |
R. M. Bremnes, L. Busund, T. L. Kilvær, S. Andersen, E. Richardsen, E. E. Paulsen, et al., The role of tumor-infiltrating lymphocytes in development, progression, and prognosis of non-small cell lung cancer, J. Thorac. Oncol., 11 (2016), 789-800. https://doi.org/10.1016/j.jtho.2016.01.015 doi: 10.1016/j.jtho.2016.01.015
|
| [11] |
M. Poch, M. Hall, A. Joerger, K. Kodumudi, M. Beatty, P. P. Innamarato, et al., Expansion of tumor infiltrating lymphocytes (TIL) from bladder cancer, Oncoimmunology, 7 (2018), e1476816. https://doi.org/10.1080/2162402X.2018.1476816 doi: 10.1080/2162402X.2018.1476816
|
| [12] |
L. Ye, T. Zhang, Z. Kang, G. Guo, Y. Sun, K. Lin, et al., Tumor-infiltrating immune cells act as a marker for prognosis in colorectal cancer, Front. Immunol., 10 (2019), 2368. https://doi.org/10.3389/fimmu.2019.02368 doi: 10.3389/fimmu.2019.02368
|
| [13] |
X. Tian, W. Xu, Y. Wang, A. Anwaier, H. Wang, F. Wan, et al., Identification of tumor-infiltrating immune cells and prognostic validation of tumor-infiltrating mast cells in adrenocortical carcinoma: Results from bioinformatics and real-world data, Oncoimmunology, 9 (2020), 1784529. https://doi.org/10.1080/2162402X.2020.1784529 doi: 10.1080/2162402X.2020.1784529
|
| [14] |
L. Fancello, S. Gandini, P. G. Pelicci, L. Mazzarella, Tumor mutational burden quantification from targeted gene panels: major advancements and challenges, J. Immunother. Cancer, 7 (2019), 183. https://doi.org/10.1186/s40425-019-0647-4 doi: 10.1186/s40425-019-0647-4
|
| [15] |
C. Luo, J. Chen, L. Chen, Exploration of gene expression profiles and immune microenvironment between high and low tumor mutation burden groups in prostate cancer, Int. Immunopharmacol., 86 (2020), 106709. https://doi.org/10.1016/j.intimp.2020.106709 doi: 10.1016/j.intimp.2020.106709
|
| [16] |
H. Zhou, L. Chen, Y. Lei, T. Li, H. Li, X. Cheng, Integrated analysis of tumor mutation burden and immune infiltrates in endometrial cancer, Curr. Probl. Cancer, 45 (2021), 100660. https://doi.org/10.1016/j.currproblcancer.2020.100660 doi: 10.1016/j.currproblcancer.2020.100660
|
| [17] |
N. A. Rizvi, M. D. Hellmann, A. Snyder, P. Kvistborg, V. Makarov, J. J. Havel, et al., Mutational landscape determines sensitivity to PD-1 blockade in non-small cell lung cancer, Science, 348 (2015), 124-128. https://doi.org/10.1126/science.aaa1348 doi: 10.1126/science.aaa1348
|
| [18] |
M. D. Hellmann, T. Ciuleanu, A. Pluzanski, J. S. Lee, G. A. Otterson, C. Audigier-Valette, et al., Nivolumab plus ipilimumab in lung cancer with a high tumor mutational burden, N. Engl. J. Med., 378 (2018), 2093-2104. https://doi.org/10.1056/NEJMoa1801946 doi: 10.1056/NEJMoa1801946
|
| [19] |
M. D. Hellmann, M. K. Callahan, M. M. Awad, E. Calvo, P. A. Ascierto, A. Atmaca, et al., Tumor mutational burden and efficacy of nivolumab monotherapy and in combination with ipilimumab in small-cell lung cancer, Cancer Cell, 33 (2018), 853-861. https://doi.org/10.1016/j.ccell.2018.04.001 doi: 10.1016/j.ccell.2018.04.001
|
| [20] |
C. Zhang, Z. Li, F. Qi, X. Hu, J. Luo, Exploration of the relationships between tumor mutation burden with immune infiltrates in clear cell renal cell carcinoma, Ann. Transl. Med., 7 (2019), 648. https://doi.org/10.21037/atm.2019.10.84 doi: 10.21037/atm.2019.10.84
|
| [21] |
J. Yan, X. Wu, J. Yu, Y. Zhu, S. Cang, Prognostic role of tumor mutation burden combined with immune infiltrates in skin cutaneous melanoma based on multi-omics analysis, Front. Oncol., 10 (2020), 570654. https://doi.org/10.3389/fonc.2020.570654 doi: 10.3389/fonc.2020.570654
|
| [22] |
J. D. Wasserman, A. Novokmet, C. Eichler-Jonsson, R. C. Ribeiro, C. Rodriguez-Galindo, G. P. Zambetti, et al., Prevalence and functional consequence of TP53 mutations in pediatric adrenocortical carcinoma: A children's oncology group study, J. Clin. Oncol., 33 (2015), 602-609. https://doi.org/10.1200/JCO.2013.52.6863 doi: 10.1200/JCO.2013.52.6863
|
| [23] |
N. Riaz, L. Morris, J. J. Havel, V. Makarov, A. Desrichard, T. A. Chan, The role of neoantigens in response to immune checkpoint blockade, Int. Immunol., 28 (2016), 411-419. https://doi.org/10.1093/intimm/dxw019 doi: 10.1093/intimm/dxw019
|
| [24] |
D. A. Braun, K. P. Burke, E. M. Van Allen, Genomic approaches to understanding response and resistance to immunotherapy, Clin. Cancer Res., 22 (2016), 5642-5650. https://doi.org/10.1158/1078-0432.CCR-16-0066 doi: 10.1158/1078-0432.CCR-16-0066
|
| [25] |
A. Mayakonda, D. Lin, Y. Assenov, C. Plass, H. P. Koeffler, Maftools: Efficient and comprehensive analysis of somatic variants in cancer, Genome Res., 28 (2018), 1747-1756. https://doi.org/10.1101/gr.239244.118 doi: 10.1101/gr.239244.118
|
| [26] |
M. E. Ritchie, B. Phipson, D. Wu, Y. Hu, C. W. Law, W. Shi, et al., Limma powers differential expression analyses for RNA-sequencing and microarray studies, Nucleic Acids Res., 43 (2015), e47. https://doi.org/10.1093/nar/gkv007 doi: 10.1093/nar/gkv007
|
| [27] | Gene Ontology Consortium, Gene Ontology Consortium: Going forward, Nucleic Acids Res., 43 (2015), D1049-D1056. https://doi.org/10.1093/nar/gku1179 |
| [28] |
G. Yu, L. Wang, Y. Han, Q. He, ClusterProfiler: An R package for comparing biological themes among gene clusters, Omics: J. Integr. Biol., 16 (2012), 284-287. https://doi.org/10.1089/omi.2011.0118 doi: 10.1089/omi.2011.0118
|
| [29] |
M. Kanehisa, S. Goto, KEGG: Kyoto encyclopedia of genes and genomes, Nucleic Acids Res., 28 (2000), 27-30. https://doi.org/10.1093/nar/28.1.27 doi: 10.1093/nar/28.1.27
|
| [30] |
A. Subramanian, P. Tamayo, V. K. Mootha, S. Mukherjee, B. L. Ebert, M. A. Gillette, et al., Gene set enrichment analysis: A knowledge-based approach for interpreting genome-wide expression profiles, Proc. Natl. Acad. Sci., 102 (2005), 15545-15550. https://doi.org/10.1073/pnas.0506580102 doi: 10.1073/pnas.0506580102
|
| [31] |
K. A. Zalocusky, M. J. Kan, Z. Hu, P. Dunn, E. Thomson, J. Wiser, et al., The 10,000 immunomes project: Building a resource for human immunology, Cell Rep., 25 (2018), 513-522. https://doi.org/10.1016/j.celrep.2018.09.021 doi: 10.1016/j.celrep.2018.09.021
|
| [32] |
B. Chen, M. S. Khodadoust, C. L. Liu, A. M. Newman, A. A. Alizadeh, Profiling tumor infiltrating immune cells with CIBERSORT, Methods Mol. Biol., 1711 (2018), 243-259. https://doi.org/10.1007/978-1-4939-7493-1_12 doi: 10.1007/978-1-4939-7493-1_12
|
| [33] |
Y. Ma, X. Feng, W. Yang, C. You, Exploring the pathological mechanism of bladder cancer based on tumor mutational burden analysis, Biomed. Res. Int., 2019 (2019), 1093815. https://doi.org/10.1155/2019/1093815 doi: 10.1155/2019/1093815
|
| [34] |
S. Turajlic, A. Sottoriva, T. Graham, C. Swanton, Resolving genetic heterogeneity in cancer, Nat. Rev. Genet., 20 (2019), 404-416. https://doi.org/10.1038/s41576-019-0114-6 doi: 10.1038/s41576-019-0114-6
|
| [35] |
Y. Ino, R. Yamazaki-Itoh, K. Shimada, M. Iwasaki, T. Kosuge, Y. Kanai, et al., Immune cell infiltration as an indicator of the immune microenvironment of pancreatic cancer, Br. J. Cancer, 108 (2013), 914-923. https://doi.org/10.1038/bjc.2013.32 doi: 10.1038/bjc.2013.32
|
| [36] |
M. V. Dieci, F. Miglietta, V. Guarneri, Immune infiltrates in breast cancer: Recent updates and clinical implications, Cells, 10 (2021). https://doi.org/10.3390/cells10020223 doi: 10.3390/cells10020223
|
| [37] |
X. Liu, S. Wu, Y. Yang, M. Zhao, G. Zhu, Z. Hou, The prognostic landscape of tumor-infiltrating immune cell and immunomodulators in lung cancer, Biomed. Pharmacother., 95 (2017), 55-61. https://doi.org/10.1016/j.biopha.2017.08.003 doi: 10.1016/j.biopha.2017.08.003
|
| [38] |
E. Billon, P. Finetti, A. Bertucci, P. Niccoli, D. Birnbaum, E. Mamessier, et al., PDL1 expression is associated with longer postoperative, survival in adrenocortical carcinoma, Oncoimmunology, 8 (2019), e1655362. https://doi.org/10.1080/2162402X.2019.1655362 doi: 10.1080/2162402X.2019.1655362
|
| [39] |
C. Zhang, L. Shen, F. Qi, J. Wang, J. Luo, Multi-omics analysis of tumor mutation burden combined with immune infiltrates in bladder urothelial carcinoma, J. Cell. Physiol., 235 (2020), 3849-3863. https://doi.org/10.1002/jcp.29279 doi: 10.1002/jcp.29279
|
| [40] |
K. Sakai, M. Tsuboi, H. Kenmotsu, T. Yamanaka, T. Takahashi, K. Goto, et al., Tumor mutation burden as a biomarker for lung cancer patients treated with pemetrexed and cisplatin (the JIPANG-TR), Cancer Sci., 112 (2021), 388-396. https://doi.org/10.1111/cas.14730 doi: 10.1111/cas.14730
|
| [41] |
T. Jiang, J. Shi, Z. Dong, L. Hou, C. Zhao, X. Li, et al., Genomic landscape and its correlations with tumor mutational burden, PD-L1 expression, and immune cells infiltration in Chinese lung squamous cell carcinoma, J. Hematol. Oncol., 12 (2019), 75. https://doi.org/10.1186/s13045-019-0762-1 doi: 10.1186/s13045-019-0762-1
|
| [42] |
A. Parrales, T. Iwakuma, Targeting oncogenic mutant p53 for cancer therapy, Front. Oncol., 5 (2015), 288. https://doi.org/10.3389/fonc.2015.00288 doi: 10.3389/fonc.2015.00288
|
| [43] |
M. Kanapathipillai, Treating p53 mutant aggregation-associated cancer, Cancers, 10 (2018). https://doi.org/10.3390/cancers10060154 doi: 10.3390/cancers10060154
|
| [44] |
A. Chassot, M. Le Rolle, M. Jourden, M. M. Taketo, N. B. Ghyselinck, M. Chaboissier, Constitutive WNT/CTNNB1 activation triggers spermatogonial stem cell proliferation and germ cell depletion, Dev. Biol., 426 (2017), 17-27. https://doi.org/10.1016/j.ydbio.2017.04.010 doi: 10.1016/j.ydbio.2017.04.010
|
| [45] |
D. Messerschmidt, W. N. de Vries, C. Lorthongpanich, S. Balu, D. Solter, B. B. Knowles, Β-catenin-mediated adhesion is required for successful preimplantation mouse embryo development, Development, 143 (2016), 1993-1999. https://doi.org/10.1242/dev.133439 doi: 10.1242/dev.133439
|
| [46] |
S. Devarakonda, F. Rotolo, M. Tsao, I. Lanc, E. Brambilla, A. Masood, et al., Tumor mutation burden as a biomarker in resected non-small-cell lung cancer, J. Clin. Oncol., 36 (2018), 2995-3006. https://doi.org/10.1200/JCO.2018.78.1963 doi: 10.1200/JCO.2018.78.1963
|
| [47] |
X. Wang, M. Li, Correlate tumor mutation burden with immune signatures in human cancers, BMC Immunol., 20 (2019), 4. https://doi.org/10.1186/s12865-018-0285-5 doi: 10.1186/s12865-018-0285-5
|
| [48] |
H. Kitao, M. Iimori, Y. Kataoka, T. Wakasa, E. Tokunaga, H. Saeki, et al., DNA replication stress and cancer chemotherapy, Cancer Sci., 109 (2018), 264-271. https://doi.org/10.1111/cas.13455 doi: 10.1111/cas.13455
|
| [49] |
S. Zheng, A. D. Cherniack, N. Dewal, R. A. Moffitt, L. Danilova, B. A. Murray, et al., Comprehensive pan-genomic characterization of adrenocortical carcinoma, Cancer Cell, 29 (2016), 723-736. https://doi.org/10.1016/j.ccell.2016.04.002 doi: 10.1016/j.ccell.2016.04.002
|
| [50] |
M. Ingham, G. K. Schwartz, Cell-cycle therapeutics come of age, J. Clin. Oncol., 35 (2017), 2949-2959. https://doi.org/10.1200/JCO.2016.69.0032 doi: 10.1200/JCO.2016.69.0032
|
| [51] |
M. Zhu, W. Xu, C. Wei, J. Huang, J. Xu, Y. Zhang, et al., CCL14 serves as a novel prognostic factor and tumor suppressor of HCC by modulating cell cycle and promoting apoptosis, Cell Death Dis., 10 (2019), 796. https://doi.org/10.1038/s41419-019-1966-6 doi: 10.1038/s41419-019-1966-6
|
| [52] |
L. Xu, W. Yu, H. Xiao, K. Lin, BIRC5 is a prognostic biomarker associated with tumor immune cell infiltration, Sci. Rep., 11 (2021), 1-13. https://doi.org/10.1038/s41598-020-79736-7 doi: 10.1038/s41598-020-79736-7
|
| [53] |
Y. Vahidi, Z. Faghih, A. Talei, M. Doroudchi, A. Ghaderi, Memory CD4(+) T cell subsets in tumor draining lymph nodes of breast cancer patients: A focus on T stem cell memory cells, Cell. Oncol., 41 (2018), 1-11. https://doi.org/10.1007/s13402-017-0352-6 doi: 10.1007/s13402-017-0352-6
|
| [54] |
K. Hiraoka, M. Miyamoto, Y. Cho, M. Suzuoki, T. Oshikiri, Y. Nakakubo, et al., Concurrent infiltration by CD8+ T cells and CD4+ T cells is a favourable prognostic factor in non-small-cell lung carcinoma, Br. J. Cancer, 94 (2006), 275-280. https://doi.org/10.1038/sj.bjc.6602934 doi: 10.1038/sj.bjc.6602934
|
| [55] |
L. E. Harrington, K. M. Janowski, J. R. Oliver, A. J. Zajac, C. T. Weaver, Memory CD4 T cells emerge from effector T-cell progenitors, Nature, 452 (2008), 356-360. https://doi.org/10.1038/nature06672 doi: 10.1038/nature06672
|
 mbe-19-07-333-Supplementary tables.zip mbe-19-07-333-Supplementary tables.zip |
 |
Figures(11) / Tables(2)

Yong Luo, Qingbiao Chen, Jingbo Lin. Identification and validation of a tumor mutation burden-related signature combined with immune microenvironment infiltration in adrenocortical carcinoma[J]. Mathematical Biosciences and Engineering, 2022, 19(7): 7055-7075. doi: 10.3934/mbe.2022333


 DownLoad: