Hybrid EEG-fNIRS brain-computer interface (HBCI) is widely employed to enhance BCI performance. EEG and fNIRS signals are combined to increase the dimensionality of the information. Time windows are used to select EEG and fNIRS singles synchronously. However, it ignores that specific modal signals have their own characteristics, when the task is stimulated, the information between the modalities will mismatch at the moment, which has a significant impact on the classification performance. Here we propose a novel crossing time windows optimization for mental arithmetic (MA) based BCI. The EEG and fNIRS signals were segmented separately by sliding time windows. Then crossing time windows (CTW) were combined with each one segment from EEG and fNIRS selected independently. Furthermore, EEG and fNIRS features were extracted using Filter Bank Common Spatial Pattern (FBCSP) and statistical methods from each sample. Mutual information was calculated for FBCSP and statistical features to characterize the discrimination of crossing time windows, and the optimal window would be selected based on the largest mutual information. Finally, a sparse structured framework of Fisher Lasso feature selection (FLFS) was designed to select the joint features, and conventional Linear Discriminant Analysis (LDA) was employed to perform classification. We used proposed method for a MA dataset. The classification accuracy of the proposed method is 92.52 ± 5.38% and higher than other methods, which shows the rationality and superiority of the proposed method.
Citation: Ming Meng, Luyang Dai, Qingshan She, Yuliang Ma, Wanzeng Kong. Crossing time windows optimization based on mutual information for hybrid BCI[J]. Mathematical Biosciences and Engineering, 2021, 18(6): 7919-7935. doi: 10.3934/mbe.2021392
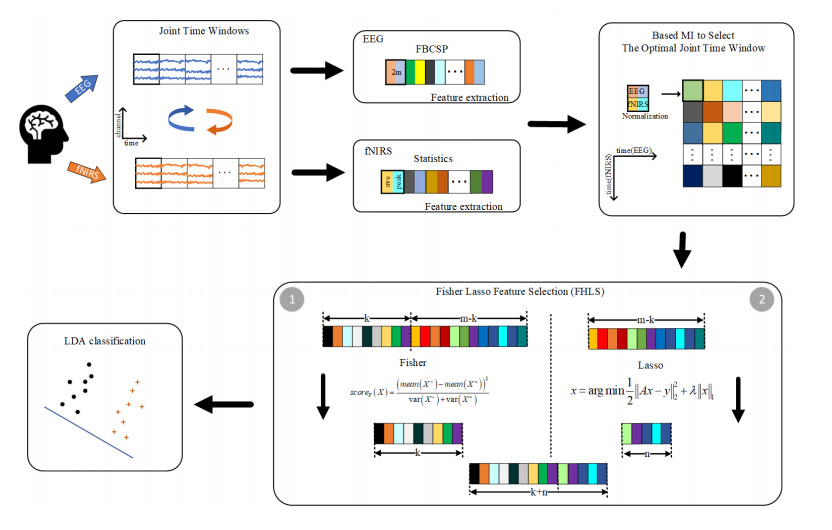
Hybrid EEG-fNIRS brain-computer interface (HBCI) is widely employed to enhance BCI performance. EEG and fNIRS signals are combined to increase the dimensionality of the information. Time windows are used to select EEG and fNIRS singles synchronously. However, it ignores that specific modal signals have their own characteristics, when the task is stimulated, the information between the modalities will mismatch at the moment, which has a significant impact on the classification performance. Here we propose a novel crossing time windows optimization for mental arithmetic (MA) based BCI. The EEG and fNIRS signals were segmented separately by sliding time windows. Then crossing time windows (CTW) were combined with each one segment from EEG and fNIRS selected independently. Furthermore, EEG and fNIRS features were extracted using Filter Bank Common Spatial Pattern (FBCSP) and statistical methods from each sample. Mutual information was calculated for FBCSP and statistical features to characterize the discrimination of crossing time windows, and the optimal window would be selected based on the largest mutual information. Finally, a sparse structured framework of Fisher Lasso feature selection (FLFS) was designed to select the joint features, and conventional Linear Discriminant Analysis (LDA) was employed to perform classification. We used proposed method for a MA dataset. The classification accuracy of the proposed method is 92.52 ± 5.38% and higher than other methods, which shows the rationality and superiority of the proposed method.

| [1] |
J. R. Wolpaw, N. Birbaumer, D. J. McFarland, G. Pfurtscheller, T. M. Vaughan, Brain-computer interfaces for communication and control, Clin. Neurophysiol., 113 (2002), 767-791. doi: 10.1016/S1388-2457(02)00057-3

|
| [2] |
L. F. Nicolas-Alonso, J. Gomez-Gil, Brain Computer Interfaces, a Review, Sensors, 12 (2012), 1211-1279. doi: 10.3390/s120201211
|
| [3] |
A. D. Bigirimana, N. Siddique, D. Coyle, Emotion-Inducing Imagery Versus Motor Imagery for a Brain-Computer Interface, IEEE Trans. Neural Syst. Rehab. Eng., 28 (2020), 850-859. doi: 10.1109/TNSRE.2020.2978951
|
| [4] |
H. Azizollahi, M. Darbas, M. M. Diallo, A. El Badia, S. Lohrengel, Eeg in Neonates: Forward Modeling and Sensitivity Analysis with Respect to Variations of the Conductivity, Math. Biosci. Eng., 15 (2018), 905-932. doi: 10.3934/mbe.2018041
|
| [5] |
J. W. Choi, S. Huh, S. Jo, Improving performance in motor imagery BCI-based control applications via virtually embodied feedback, Comput. Biol. Med., 127 (2020), 104079-104088. doi: 10.1016/j.compbiomed.2020.104079
|
| [6] | J. Unterweger, M. Seeber, S. Zanos, J. G. Ojemann, R. Scherer, ECoG Beta Suppression and Modulation During Finger Extension and Flexion, Front. Neurosci., 14 (2020), 35-45. |
| [7] |
R. Rosas-Romero, E. Guevara, K. Peng, D. K. Nguyen, F. Lesage, P. Pouliot, W. E. Lima-Saad, Prediction of epileptic seizures with convolutional neural networks and functional near-infrared spectroscopy signals, Comput. Biol. Med., 111 (2019), 103355-103365. doi: 10.1016/j.compbiomed.2019.103355
|
| [8] |
E. A. Aydin, Subject-Specific feature selection for near infrared spectroscopy based brain-computer interfaces, Comput. Methods Programs Biomed., 195 (2020), 105535-105547. doi: 10.1016/j.cmpb.2020.105535
|
| [9] |
C. G. Li, M. Su, J. C. Xu, H. D. Jin, L. N. Sun, A Between-Subject fNIRS-BCI Study on Detecting Self-Regulated Intention During Walking, IEEE Trans. Neural Syst. Rehab. Eng., 28 (2020), 531-540. doi: 10.1109/TNSRE.2020.2965628
|
| [10] | G. Lioi, S. Butet, M. Fleury, E. Bannier, A. Lecuyer, I. Bonan, C. Barillot, A Multi-Target Motor Imagery Training Using Bimodal EEG-fMRI Neurofeedback: A Pilot Study in Chronic Stroke Patients, Front. Hum. Neurosci., 14 (2020), 37-50. |
| [11] |
G. Valente, A. L. Kaas, E. Formisano, R. Goebela, Optimizing fMRI experimental design for MVPA-based BCI control: Combining the strengths of block and event-related designs, NeuroImage, 186 (2019), 369-381. doi: 10.1016/j.neuroimage.2018.10.080
|
| [12] |
J. Mellinger, G. Schalk, C. Braun, H. Preissl, W. Rosenstiel, N. Birbaumer, A. Kubler, An MEG-based brain-computer interface (BCI), NeuroImage, 36 (2007), 581-593. doi: 10.1016/j.neuroimage.2007.03.019
|
| [13] |
Q. Noirhomme, R. I. Kitney, B. Macq, Single-trial EEG source reconstruction for brain-computer interface, IEEE Trans. Biomed. Eng., 55 (2008), 1592-1601. doi: 10.1109/TBME.2007.913986
|
| [14] |
M. Arvaneh, C. T. Guan, K. K. Ang, C. Quek, Optimizing the Channel Selection and Classification Accuracy in EEG-Based BCI, IEEE Trans. Biomed. Eng., 58 (2011), 1865-1873. doi: 10.1109/TBME.2011.2131142
|
| [15] | S. R. Soekadar, M. Witkowski, E. G. Cossio, N. Birbaumer, L. G. Cohen, Learned EEG-based brain self-regulation of motor-related oscillations during application of transcranial electric brain stimulation: feasibility and limitations, Front. Behav. Neurosci., 8 (2014), 93-102. |
| [16] | D. Wang, D. Q. Miao, G. Blohm, Multi-class motor imagery EEG decoding for brain-computer interfaces, Front. Neurosci., 6 (2012), 151-164. |
| [17] |
A. Villringer, J. Planck, C. Hock, L. Schleinkofer, U. Dirnagl, Near infrared spectroscopy (NIRS): a new tool to study hemodynamic changes during activation of brain function in human adults, Neurosci. Lett., 154 (1993), 101-104. doi: 10.1016/0304-3940(93)90181-J
|
| [18] |
Y. Hoshi, H. Onoe, Y. Watanabe, J. Andersson, M. Bergstrom, A. Lilja, B. Langstrom, M. Tamura, Non-synchronous behavior of neuronal activity, oxidative metabolism and blood supply during mental tasks in man, Neurosci. Lett., 172 (1994), 129-133. doi: 10.1016/0304-3940(94)90679-3
|
| [19] |
Y. Hoshi, M. Tamura, Near-infrared optical detection of sequential brain activation in the prefrontal cortex during mental tasks, NeuroImage, 5 (1997), 292-297. doi: 10.1006/nimg.1997.0270
|
| [20] |
A. Villringer, B. Chance, Non-invasive optical spectroscopy and imaging of human brain function, Trends Neurosci., 20 (1997), 435-442. doi: 10.1016/S0166-2236(97)01132-6
|
| [21] |
K. S. Hong, H. D. Nguyen, State-space models of impulse hemodynamic responses over motor, somatosensory, and visual cortices, Biomed. Opt. Express, 5 (2014), 1778-1798. doi: 10.1364/BOE.5.001778
|
| [22] |
L. F. Nicolas-Alonso, J. Gomez-Gil, Brain computer interfaces, a review, Sensors (Basel), 12 (2012), 1211-1279. doi: 10.3390/s120201211
|
| [23] | N. Naseer, N. K. Qureshi, F. M. Noori, K. S. Hong, Analysis of Different Classification Techniques for Two-Class Functional Near-Infrared Spectroscopy-Based Brain-Computer Interface, Comput. Intell. Neurosci., 2016 (2016), 5480760-5480771. |
| [24] |
S. Fazli, J. Mehnert, J. Steinbrink, G. Curio, A. Villringer, K. R. Muller, B. Blankertz, Enhanced performance by a hybrid NIRS-EEG brain computer interface, NeuroImage, 59 (2012), 519-529. doi: 10.1016/j.neuroimage.2011.07.084
|
| [25] |
S. Firooz, S. K. Setarehdan, IQ estimation by means of EEG-fNIRS recordings during a logical mathematical intelligence test, Comput. Biol. Med., 110 (2019), 218-226. doi: 10.1016/j.compbiomed.2019.05.017
|
| [26] |
Y. Tomita, F. B. Vialatte, G. Dreyfus, Y. Mitsukura, H. Bakardjian, A. Cichocki, Bimodal BCI Using Simultaneously NIRS and EEG, IEEE Trans. Biomed. Eng., 61 (2014), 1274-1284. doi: 10.1109/TBME.2014.2300492
|
| [27] | A. P. Buccino, H. O. Keles, A. Omurtag, Hybrid EEG-fNIRS Asynchronous Brain-Computer Interface for Multiple Motor Tasks, Plos One, 11 (2016), 0146610-0146627. |
| [28] | A. Berger, F. Horst, S. Müller, F. Steinberg, M. Doppelmayr, Current State and Future Prospects of EEG and fNIRS in Robot-Assisted Gait Rehabilitation: A Brief Review, Front. Hum. Neurosci., 13 (2019), 172-172. |
| [29] |
S. K. Yeom, D.-O. Won, S. I. Chi, K.-S. Seo, H. J. Kim, K. R. Müller, S. W. Lee, Spatio-temporal dynamics of multimodal EEG-fNIRS signals in the loss and recovery of consciousness under sedation using midazolam and propofol, PLoS One, 12 (2017), e0187743. doi: 10.1371/journal.pone.0177197
|
| [30] | S. Mandal, B. K. Singh, K. Thakur, Classification of working memory loads using hybrid EEG and fNIRS in machine learning paradigm, ElL, 56 (2020), 1386-1388. |
| [31] |
Y. Zhang, C. S. Nam, G. X. Zhou, J. Jin, X. Y. Wang, A. Cichocki, Temporally Constrained Sparse Group Spatial Patterns for Motor Imagery BCI, IEEE Trans. Cyber., 49 (2019), 3322-3332. doi: 10.1109/TCYB.2018.2841847
|
| [32] | S. B. Borgheai, M. Abtahi, K. Mankodiya, J. McLinden, Y. Shahriari, Towards a Single Trial fNIRS-based Brain-Computer Interface for Communication, IEEE Int. Joint Conf. Neural Eng., 2019 (2019), 1030-1033. |
| [33] | M. J. Khan, K. S. Hong, Hybrid EEG-fNIRS-Based Eight-Command Decoding for BCI: Application to Quadcopter Control, Front. Neurorobot., 11 (2017), 6-19. |
| [34] |
S. Fazli, J. Mehnert, J. Steinbrink, G. Curio, A. Villringer, K. R. Muller, B. Blankertz, Enhanced performance by a hybrid NIRS-EEG brain computer interface, NeuroImage, 59 (2012), 519-529. doi: 10.1016/j.neuroimage.2011.07.084
|
| [35] |
F. M. Noori, N. Naseer, N. K. Qureshi, H. Nazeer, R. A. Khan, Optimal feature selection from fNIRS signals using genetic algorithms for BCI, Neurosci. Lett., 647 (2017), 61-66. doi: 10.1016/j.neulet.2017.03.013
|
| [36] |
P. Olejniczak, Neurophysiologic basis of EEG, Clin. Neurophysiol., 23 (2006), 186-189. doi: 10.1097/01.wnp.0000220079.61973.6c
|
| [37] | F. Matthews, B. A. Pearlmutter, T. E. Wards, C. Soraghan, C. Markham, Hemodynamics for Brain-Computer Interfaces, ISPM, 25 (2008), 87-94. |
| [38] |
B. K. Min, M. J. Marzelli, S. S. Yoo, Neuroimaging-based approaches in the brain-computer interface, Trends Biotechnol., 28 (2010), 552-560. doi: 10.1016/j.tibtech.2010.08.002
|
| [39] |
M. Essenpreis, C. E. Elwell, M. Cope, P. van der Zee, S. R. Arridge, D. T. Delpy, Spectral dependence of temporal point spread functions in human tissues, Appl. Opt., 32 (1993), 418-425. doi: 10.1364/AO.32.000418
|
| [40] |
F. Scholkmann, S. Kleiser, A. J. Metz, R. Zimmermann, J. M. Pavia, U. Wolf, M. Wolf, A review on continuous wave functional near-infrared spectroscopy and imaging instrumentation and methodology, Neuroimage, 85 (2014), 6-27. doi: 10.1016/j.neuroimage.2013.05.004
|
| [41] |
Y. Wang, P. Berg, M. Scherg, Common spatial subspace decomposition applied to analysis of brain responses under multiple task conditions: a simulation study, Clin. Neurophysiol., 110 (1999), 604-614. doi: 10.1016/S1388-2457(98)00056-X
|
| [42] | K. K. Ang, Z. Y. Chin, H. H. Zhang, C. T. Guan, Filter Bank Common Spatial Pattern (FBCSP) in Brain-Computer Interface, IEEE Int. Joint Conf. Neural Networks, 2008 (2008), 2390-2397. |
| [43] |
R. Sitaram, H. H. Zhang, C. T. Guan, M. Thulasidas, Y. Hoshi, A. Ishikawa, et al., Temporal classification of multichannel near-infrared spectroscopy signals of motor imagery for developing a brain-computer interface, Neuroimage, 34 (2007), 1416-1427. doi: 10.1016/j.neuroimage.2006.11.005
|
| [44] |
K. S. Hong, N. Naseer, Y. H. Kim, Classification of prefrontal and motor cortex signals for three-class fNIRS-BCI, Neurosci. Lett., 587 (2015), 87-92. doi: 10.1016/j.neulet.2014.12.029
|
| [45] |
L. Holper, M. Wolf, Single-trial classification of motor imagery differing in task complexity: a functional near-infrared spectroscopy study, J. Neuroeng. Rehabilitation, 8 (2011), 34-47. doi: 10.1186/1743-0003-8-34
|
| [46] |
G. Bauernfeind, R. Scherer, G. Pfurtscheller, C. Neuper, Single-trial classification of antagonistic oxyhemoglobin responses during mental arithmetic, Med. Biol. Eng. Comput., 49 (2011), 979-984. doi: 10.1007/s11517-011-0792-5
|
| [47] | N. Naseer, F. M. Noori, N. K. Qureshi, K. S. Hong, Determining Optimal Feature-Combination for LDA Classification of Functional Near-Infrared Spectroscopy Signals in Brain-Computer Interface Application, Front. Hum. Neurosci., 10 (2016), 237-247. |
| [48] | H. C. Peng, F. H. Long, C. Ding, Feature selection based on mutual information: Criteria of max-dependency, max-relevance, and min-redundancy, ITPAM, 27 (2005), 1226-1238. |
| [49] | K. R. Müller, M. Krauledat, G. Dornhege, G. Curio, B. J. B. T. Blankertz, Machine learning techniques for brain-computer interfaces, IEEE. Trans. Biomed. Eng., 49 (2004), 11-22. |
| [50] |
R. Tibshirani, Regression shrinkage and selection via the lasso: a retrospective, J. R. Stat. Soc. Series B Stat. Methodol., 73 (2011), 273-282. doi: 10.1111/j.1467-9868.2011.00771.x
|
| [51] |
L. Meier, S. A. van de Geer, P. Buhlmann, The group lasso for logistic regression, J. R. Stat. Soc. Series B Stat. Methodol., 70 (2008), 53-71. doi: 10.1111/j.1467-9868.2007.00627.x
|
| [52] |
R. Hosseini, B. Walsh, F. H. Tian, S. Y. Wang, An fNIRS-Based Feature Learning and Classification Framework to Distinguish Hemodynamic Patterns in Children Who Stutter, IEEE Trans. Neural Syst. Rehab. Eng., 26 (2018), 1254-1263. doi: 10.1109/TNSRE.2018.2829083
|
| [53] |
J. Shin, A. von Luhmann, B. Blankertz, D. W. Kim, J. Jeong, H. J. Hwang, et al., Open Access Dataset for EEG plus NIRS Single-Trial Classification, IEEE Trans. Neural Syst. Rehab. Eng., 25 (2017), 1735-1745. doi: 10.1109/TNSRE.2016.2628057
|


Figures(7) / Tables(3)

Ming Meng, Luyang Dai, Qingshan She, Yuliang Ma, Wanzeng Kong. Crossing time windows optimization based on mutual information for hybrid BCI[J]. Mathematical Biosciences and Engineering, 2021, 18(6): 7919-7935. doi: 10.3934/mbe.2021392


 DownLoad: