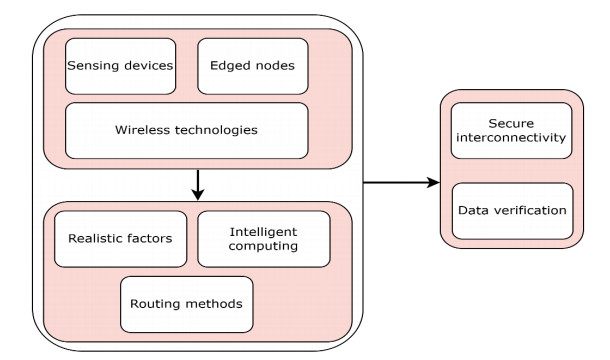
Smart technologies are advancing the development of cutting-edge systems by exploring the future network. The Internet of Things (IoT) and many multimedia sensors interact with each other for collecting and transmitting visual data. However, managing enormous amounts of data from numerous network devices is one of the main research challenges. In this context, various IoT systems have been investigated and have provided efficient data retrieval and processing solutions. For multimedia systems, however, controlling inefficient bandwidth utilization and ensuring timely transmission of vital information are key research concerns. Moreover, to transfer multimedia traffic while balancing communication costs for the IoT system, a sustainable solution with intelligence in real-life applications is demanded. Furthermore, trust must be formed for technological advancement to occur; such an approach provides the smart communication paradigm with the incorporation of edge computing. This study proposed a model for optimizing multimedia using a combination of edge computing intelligence and authentic strategies. Mobile edges analyze network states to discover the system's status and minimize communication disruptions. Moreover, direct and indirect authentication determines the reliability of data forwarders and network stability. The proposed authentication approach minimizes the possibility of data compromise and increases trust in multimedia surveillance systems. Using simulation testing, the proposed model outperformed other comparable work in terms of byte delivery, packet overhead, packet delay, and data loss metrics.
Citation: Faten S. Alamri, Khalid Haseeb, Tanzila Saba, Jaime Lloret, Jose M. Jimenez. Multimedia IoT-surveillance optimization model using mobile-edge authentic computing[J]. Mathematical Biosciences and Engineering, 2023, 20(11): 19174-19190. doi: 10.3934/mbe.2023847
Smart technologies are advancing the development of cutting-edge systems by exploring the future network. The Internet of Things (IoT) and many multimedia sensors interact with each other for collecting and transmitting visual data. However, managing enormous amounts of data from numerous network devices is one of the main research challenges. In this context, various IoT systems have been investigated and have provided efficient data retrieval and processing solutions. For multimedia systems, however, controlling inefficient bandwidth utilization and ensuring timely transmission of vital information are key research concerns. Moreover, to transfer multimedia traffic while balancing communication costs for the IoT system, a sustainable solution with intelligence in real-life applications is demanded. Furthermore, trust must be formed for technological advancement to occur; such an approach provides the smart communication paradigm with the incorporation of edge computing. This study proposed a model for optimizing multimedia using a combination of edge computing intelligence and authentic strategies. Mobile edges analyze network states to discover the system's status and minimize communication disruptions. Moreover, direct and indirect authentication determines the reliability of data forwarders and network stability. The proposed authentication approach minimizes the possibility of data compromise and increases trust in multimedia surveillance systems. Using simulation testing, the proposed model outperformed other comparable work in terms of byte delivery, packet overhead, packet delay, and data loss metrics.

| [1] |
Q. Tang, F. R. Yu, R. Xie, A. Boukerche, T. Huang, Y. Liu, Internet of intelligence: A survey on the enabling technologies, applications, and challenges, IEEE Commun. Surveys Tutor., 24 (2022), 1394–1434. https://doi.org/10.1109/COMST.2017.2691349 doi: 10.1109/COMST.2017.2691349

|
| [2] |
I. Abunadi, A. Rehman, K. Haseeb, T. Alam, G. Jeon, A multi-parametric machine learning approach using authentication trees for the healthcare industry, Expert Systems, (2022), e13202. https://doi.org/10.1111/exsy.13202 doi: 10.1111/exsy.13202
|
| [3] |
I. Sarrigiannis, K. Ramantas, E. Kartsakli, P.-V. Mekikis, A. Antonopoulos, C. Verikoukis, Online VNF lifecycle management in an MEC-enabled 5G IoT architecture, IEEE Int. Things J., 7 (2019), 4183–4194. https://doi.org/10.1109/JIOT.2019.2944695 doi: 10.1109/JIOT.2019.2944695
|
| [4] |
S. H. Alsamhi, F. Afghah, R. Sahal, A. Hawbani, M. A. Al-qaness, B. Lee, et al., Green internet of things using UAVs in B5G networks: A review of applications and strategies, Ad Hoc Networks, 117 (2021), 102505. https://doi.org/10.1016/j.adhoc.2021.102505 doi: 10.1016/j.adhoc.2021.102505
|
| [5] |
L. Qiao, Y. Li, D. Chen, S. Serikawa, M. Guizani, Z. Lv, A survey on 5G/6G, AI, and Robotics, Comput. Electr. Eng., 95 (2021), 107372. https://doi.org/10.1016/j.compeleceng.2021.107372 doi: 10.1016/j.compeleceng.2021.107372
|
| [6] |
M. A. Matheen, S. Sundar, IoT multimedia sensors for energy efficiency and security: A review of QoS aware and methods in wireless multimedia sensor networks, Int. J. Wireless Inform. Networks, 29 (2022), 407–418. https://doi.org/10.1007/s10776-022-00567-6 doi: 10.1007/s10776-022-00567-6
|
| [7] |
M. K. Gupta, P. Chandra, Effects of similarity/distance metrics on k-means algorithm with respect to its applications in IoT and multimedia: A review, Multi. Tools Appl., 81 (2022), 37007–37032. https://doi.org/10.1007/s11042-021-11255-7 doi: 10.1007/s11042-021-11255-7
|
| [8] |
L. A.Tawalbeh, F. Muheidat, M. Tawalbeh, M. Quwaider, IoT Privacy and security: Challenges and solutions, Appl. Sci., 10 (2020), 4102. https://doi.org/10.3390/app10124102 doi: 10.3390/app10124102
|
| [9] | J. Lloret, M. García, F. Boronat, IPTV: la televisión por Internet, Editorial Vértice, Málaga, España, (2008), 230. |
| [10] |
A. Rego, A. Canovas, J. M. Jiménez, J. Lloret, An intelligent system for video surveillance in IoT environments, IEEE Access, 6 (2018), 31580–31598. https://doi.org/10.1109/ACCESS.2018.2842034 doi: 10.1109/ACCESS.2018.2842034
|
| [11] |
I. H. Sarker, Machine learning: Algorithms, real-world applications and research directions, SN Computer Sci., 2 (2021), 160. https://doi.org/10.1007/s42979-021-00592-x doi: 10.1007/s42979-021-00592-x
|
| [12] |
K. Haseeb, T. Saba, A. Rehman, I. Ahmed, J. Lloret, Efficient data uncertainty management for health industrial internet of things using machine learning, Int. J. Commun. Syst., 34 (2021), e4948. https://doi.org/10.1002/dac.4948 doi: 10.1002/dac.4948
|
| [13] | J. Serra, L. Sanabria-Russo, D. Pubill, C. Verikoukis, Scalable and flexible IoT data analytics: When machine learning meets SDN and virtualization, in 2018 IEEE 23rd International Workshop on Computer Aided Modeling and Design of Communication Links and Networks (CAMAD), 2018, IEEE. https://doi.org/10.1109/CAMAD.2018.8514997 |
| [14] |
W. Chen, Intelligent manufacturing production line data monitoring system for industrial internet of things, Computer Commun., 151 (2020), 31–41. https://doi.org/10.1016/j.comcom.2019.12.035 doi: 10.1016/j.comcom.2019.12.035
|
| [15] |
A. Rehman, T. Saba, K. Haseeb, R. Singh, G. Jeon, Smart health analysis system using regression analysis with iterative hashing for IoT communication networks, Computers Electr. Eng., 104 (2022), 108456. https://doi.org/10.1016/j.compeleceng.2022.108456 doi: 10.1016/j.compeleceng.2022.108456
|
| [16] | L. Sanabria-Russo, J. Alonso-Zarate, C. Verikoukis. SDN-based pro-active flow installation mechanism for delay reduction in IoT, in 2018 IEEE Global Communications Conference (GLOBECOM), 2018, IEEE. https://doi.org/10.1109/GLOCOM.2018.8647382 |
| [17] |
B. Zong, C. Fan, X. Wang, X. Duan, B. Wang, J. Wang, 6G technologies: Key drivers, core requirements, system architectures, and enabling technologies, IEEE Vehicular Technol. Mag., 14 (2019), 18–27. https://doi.org/10.1109/MVT.2019.2921398 doi: 10.1109/MVT.2019.2921398
|
| [18] | L. Mucchi, S. Jayousi, S. Caputo, E. Paoletti, P. Zoppi, S. Geli, et al., How 6G technology can change the future wireless healthcare, in 2020 2nd 6G wireless summit (6G SUMMIT), 2020, IEEE. https://doi.org/10.1109/6GSUMMIT49458.2020.9083916 |
| [19] |
S. A. Dehkordi, K. Farajzadeh, J. Rezazadeh, R. Farahbakhsh, K. Sandrasegaran, M. A. Dehkordi, A survey on data aggregation techniques in IoT sensor networks, Wireless Networks, 26 (2020), 1243–1263. https://doi.org/10.1007/s11276-019-02142-z doi: 10.1007/s11276-019-02142-z
|
| [20] |
M. Alam, A. A. Aziz, S. Latif, A. Awang, Error-aware data clustering for in-network data reduction in wireless sensor networks, Sensors, 20 (2020), 1011. https://doi.org/10.3390/s20041011 doi: 10.3390/s20041011
|
| [21] |
X. Duan, N. Song, F. Mo, An edge intelligence-enhanced quantitative assessment model for implicit working gain under mobile internet of things, Math. Biosci. Eng., 20 (2023), 7548–7564. https://doi.org/10.3934/mbe.2023326 doi: 10.3934/mbe.2023326
|
| [22] |
L. P.Verma, V. K. Sharma, M. Kumar, A. Mahanti, An adaptive multi-path data transfer approach for MP-TCP, Wireless Networks, (2022), 1–28. https://doi.org/10.1007/s11276-022-02958-2 doi: 10.1007/s11276-022-02958-2
|
| [23] |
H.-S. Kim, J. Paek, D. E. Culler, S. Bahk, PC-RPL: Joint control of routing topology and transmission power in real low-power and lossy networks, ACM Transact. Sensor Networks (TOSN), 16 (2020), 1–32. https://doi.org/10.1145/3372026 doi: 10.1145/3372026
|
| [24] |
N. A. Zardari, R. Ngah, O. Hayat, A. H. Sodhro, Adaptive mobility-aware and reliable routing protocols for healthcare vehicular network, Math. Biosci. Eng., 19 (2022), 7156–7177. https://doi.org/10.1007/s11036-022-02042-1 doi: 10.1007/s11036-022-02042-1
|
| [25] |
S. Ksibi, F. Jaidi, A. Bouhoula, A comprehensive study of security and cyber-security risk management within e-Health systems: Synthesis, analysis and a novel quantified approach, Mobile Networks Appl., (2022), 1–21. https://doi.org/10.3934/mbe.2022338 doi: 10.3934/mbe.2022338
|
| [26] |
J. Li, D. Greenwood, M. Kassem, Blockchain in the built environment and construction industry: A systematic review, conceptual models and practical use cases, Autom. Construct., 102 (2019), 288–307. https://doi.org/10.1016/j.autcon.2019.02.005 doi: 10.1016/j.autcon.2019.02.005
|
| [27] |
G. Fortino, A. Guerrieri, P. Pace, C. Savaglio, G. Spezzano, Iot platforms and security: An analysis of the leading industrial/commercial solutions, Sensors, 22 (2022), 2196. https://doi.org/10.3390/s22062196 doi: 10.3390/s22062196
|
| [28] |
D. C. Nguyen, M. Ding, P. N. Pathirana, A. Seneviratne, J. Li, D. Niyato, et al., 6G Internet of Things: A comprehensive survey, IEEE Int. Things J., 9 (2021), 359–383. https://doi.org/10.1109/JIOT.2021.3103320 doi: 10.1109/JIOT.2021.3103320
|
| [29] |
M. Banafaa, I. Shayea, J. Din, M. H. Azmi, A. Alashbi, Y. I. Daradkeh, et al., 6G mobile communication technology: Requirements, targets, applications, challenges, advantages, and opportunities, Alexandr. Eng. J., (2022). https://doi.org/10.1016/j.aej.2022.08.017 doi: 10.1016/j.aej.2022.08.017
|
| [30] | H. Lu, L. Wu, G. Fortino, S. Dustdar, Introduction to the special section on cognitive robotics on 5G/6G networks, 2021, in ACM Transactions on Internet Technology (TOIT), 21(2021), 1–3. https://doi.org/10.1145/3476466 |
| [31] |
W. Shi, W. Xu, X. You, C. Zhao, K. Wei, Intelligent reflection enabling technologies for integrated and green Internet-of-Everything beyond 5G: Communication, sensing, and security, IEEE Wireless Commun., 2022. https://doi.org/10.1109/MWC.018.2100717 doi: 10.1109/MWC.018.2100717
|
| [32] |
H. H. H.Mahmoud, A. A. Amer, T. Ismail, 6G: A comprehensive survey on technologies, applications, challenges, and research problems, Transact. Emerg. Telecommun. Technol., 32 (2021), e4233. https://doi.org/10.1002/ett.4233 doi: 10.1002/ett.4233
|
| [33] |
G. Rathee, A. Sharma, H. Saini, R. Kumar, R. Iqbal, A hybrid framework for multimedia data processing in IoT-healthcare using blockchain technology, Multi. Tools Appl., 79 (2020), 9711–9733. https://doi.org/10.1007/s11042-019-07835-3 doi: 10.1007/s11042-019-07835-3
|
| [34] |
D. Singh, A. K. Maurya, R. K. Dewang, N. Keshari, A review on Internet of Multimedia Things (IoMT) routing protocols and quality of service, Int. Multi. Things (IoMT), (2022), 1–29. https://doi.org/10.1016/B978-0-32-385845-8.00006- doi: 10.1016/B978-0-32-385845-8.00006-
|
| [35] |
A. A. Khan, A. A. Laghari, Z. A. Shaikh, Z. Dacko-Pikiewicz, S. Kot, Internet of Things (IoT) security with blockchain technology: A state-of-the-art review, IEEE Access, (2022). https://doi.org/10.1109/ACCESS.2022.3223370 doi: 10.1109/ACCESS.2022.3223370
|
| [36] |
M. A. Jan, J. Cai, X.-C. Gao, F. Khan, S. Mastorakis, M. Usman, et al., Security and blockchain convergence with Internet of Multimedia Things: Current trends, research challenges and future directions, J. Network Computer Appl., 175 (2021), 102918. https://doi.org/10.1016/j.jnca.2020.102918 doi: 10.1016/j.jnca.2020.102918
|
| [37] |
Moussa, N., D. Benhaddou, A. El Belrhiti El Alaoui, EARP: An Enhanced ACO-Based Routing Protocol for Wireless Sensor Networks with Multiple Mobile Sinks. Int. J. Wireless Inform. Networks, 29 (2022), 118–129. https://doi.org/10.1007/s10776-021-00545-4 doi: 10.1007/s10776-021-00545-4
|
| [38] |
N. Hu, Z. Tian, X. Du, M. Guizani, An energy-efficient in-network computing paradigm for 6G, IEEE Transact. Green Commun. Network., 5 (2021), 1722–1733. https://doi.org/10.1109/TGCN.2021.3099804 doi: 10.1109/TGCN.2021.3099804
|
| [39] |
A. Kumar, S. Sharma, N. Goyal, S. K. Gupta, S. Kumari, S. Kumar, Energy-efficient fog computing in Internet of Things based on routing protocol for low-power and lossy network with Contiki, Int. J. Commun. Syst., 35 (2022), e5049. https://doi.org/10.1002/dac.5049 doi: 10.1002/dac.5049
|
| [40] |
Z. Liao, J. Peng, J. Huang, J. Wang, J. Wang, P. K. Sharma, et al., Distributed probabilistic offloading in edge computing for 6G-enabled massive Internet of Things, IEEE Int. Things J., 8 (2020), 5298–5308. https://doi.org/10.1109/JIOT.2020.3033298 doi: 10.1109/JIOT.2020.3033298
|
| [41] |
K. Thangaramya, K. Kulothungan, S. I. Gandhi, M. Selvi, S. S. Kumar, K. Arputharaj, Intelligent fuzzy rule-based approach with outlier detection for secured routing in WSN, Soft Comput., 24 (2020), 16483–16497. https://doi.org/10.1007/s00500-020-04955-z doi: 10.1007/s00500-020-04955-z
|
| [42] |
A. Singh, A. Nagaraju, Low latency and energy efficient routing-aware network coding-based data transmission in multi-hop and multi-sink WSN, Ad Hoc Networks, 107 (2020), 102182. https://doi.org/10.1016/j.adhoc.2020.102182 doi: 10.1016/j.adhoc.2020.102182
|
| [43] |
Z. Ming, J. Chen, L. Cui, S. Yang, Y. Pan, W. Xiao, et al., Edge-based video surveillance with graph-assisted reinforcement learning in smart construction, IEEE Int. Things J., 9 (2021), 9249–9265. https://doi.org/10.1109/JIOT.2021.3090513 doi: 10.1109/JIOT.2021.3090513
|
| [44] |
B. Kizilkaya, , E. Ever, H. Y. Yatbaz, A. Yazici, An effective forest fire detection framework using heterogeneous wireless multimedia sensor networks, ACM Transact. Multi. Comput., Commun. Appl. (TOMM), 18 (2022), 1–21. https://doi.org/10.1145/3473037 doi: 10.1145/3473037
|
| [45] | O. Ibrihich, S.-d. Krit, J. Laassiri, S. El Hajji, Study and simulation of protocols of WSN using NS2, Transact. Eng. Technol., 2015, Springer, 467–480. https://doi.org/10.1007/978-94-017-9804-4_32 |


Figures(10) / Tables(3)

Faten S. Alamri, Khalid Haseeb, Tanzila Saba, Jaime Lloret, Jose M. Jimenez. Multimedia IoT-surveillance optimization model using mobile-edge authentic computing[J]. Mathematical Biosciences and Engineering, 2023, 20(11): 19174-19190. doi: 10.3934/mbe.2023847


 DownLoad: