
Citation: Alhaji Cherif, Vaibhav Maheshwari, Doris Fuertinger, Gudrun Schappacher-Tilp, Priscila Preciado, David Bushinsky, Stephan Thijssen, Peter Kotanko. A mathematical model of the four cardinal acid-base disorders[J]. Mathematical Biosciences and Engineering, 2020, 17(5): 4457-4476. doi: 10.3934/mbe.2020246
[1] | Fu-Yuan Tsai, Feng-BinWang . Mathematical analysis of a chemostat system modeling the competition for light and inorganic carbon with internal storage. Mathematical Biosciences and Engineering, 2019, 16(1): 205-221. doi: 10.3934/mbe.2019011 |
[2] | Siddhartha Kundu . Mathematical model of a short translatable G-quadruplex and an assessment of its relevance to misfolding-induced proteostasis. Mathematical Biosciences and Engineering, 2020, 17(3): 2470-2493. doi: 10.3934/mbe.2020135 |
[3] | Houssein Ayoub, Bedreddine Ainseba, Michel Langlais, Rodolphe Thiébaut . Parameters identification for a model of T cell homeostasis. Mathematical Biosciences and Engineering, 2015, 12(5): 917-936. doi: 10.3934/mbe.2015.12.917 |
[4] | Gustavo Carrero, Joel Makin, Peter Malinowski . A mathematical model for the dynamics of happiness. Mathematical Biosciences and Engineering, 2022, 19(2): 2002-2029. doi: 10.3934/mbe.2022094 |
[5] | Xinyan Ma, Yunyun Liang, Shengli Zhang . iAVPs-ResBi: Identifying antiviral peptides by using deep residual network and bidirectional gated recurrent unit. Mathematical Biosciences and Engineering, 2023, 20(12): 21563-21587. doi: 10.3934/mbe.2023954 |
[6] | Daniele Bernardo Panaro, Andrea Trucchia, Vincenzo Luongo, Maria Rosaria Mattei, Luigi Frunzo . Global sensitivity analysis and uncertainty quantification for a mathematical model of dry anaerobic digestion in plug-flow reactors. Mathematical Biosciences and Engineering, 2024, 21(9): 7139-7164. doi: 10.3934/mbe.2024316 |
[7] | J. Ignacio Tello . On a mathematical model of tumor growth based on cancer stem cells. Mathematical Biosciences and Engineering, 2013, 10(1): 263-278. doi: 10.3934/mbe.2013.10.263 |
[8] | Ying Xu, Jinyong Cheng . Secondary structure prediction of protein based on multi scale convolutional attention neural networks. Mathematical Biosciences and Engineering, 2021, 18(4): 3404-3422. doi: 10.3934/mbe.2021170 |
[9] | Xiaoman Zhao, Xue Wang, Zhou Jin, Rujing Wang . A normalized differential sequence feature encoding method based on amino acid sequences. Mathematical Biosciences and Engineering, 2023, 20(8): 14734-14755. doi: 10.3934/mbe.2023659 |
[10] | Xinpeng Xu, Xuedong Tian, Fang Yang . A retrieval and ranking method of mathematical documents based on CA-YOLOv5 and HFS. Mathematical Biosciences and Engineering, 2022, 19(5): 4976-4990. doi: 10.3934/mbe.2022233 |
Tight regulation of pH and acid-base homeostasis in the blood and in the extracellular fluid plays a pivotal role in many physiological aspects of cellular metabolism and function. The impact of acid-base alterations has far reaching implications. In addition to physiochemical buffering, acid-base homeostasis is regulated by respiratory and renal systems. Changes in pH affects numerous physiochemical reactions and buffering systems, transport/channel kinetics, muscle contraction, metabolic enzymatic reactivities, and protein/membrane structure and function [1,2,3,4,5]. Alterations in pH also impact cardiovascular, central nervous, renal and pulmonary systems, tissue metabolism and oxygenation, and bone remodeling. For example, chronic H+ retention can lead to increased muscle protein degradation and muscle wasting. In addition, through different synergistic pathways, H+ retention can increase bone dissolution, cell-mediated bone resorption, and decrease bone formation. Similarly, H+ retention can also result in renal injury and nephrolithiasis, and may accelerate progression of chronic kidney disease.
Pulmonary ventilation is controlled by partial arterial pressure of CO2 (pCO2), partial pressure of oxygen, and pH. Central chemoreceptors (located near the ventral surface of medulla oblongata of the brain) and peripheral chemoreceptors (located in the carotid and aortic bodies in the aortic arch) respond to changes in pCO2 by triggering respiratory response, which in turn affects bicarbonate concentration (HCO−3) and thereby changing the pH level [6,7,8,9,10,11,12,13,14,15,16,17,18,19,20]. Similarly, the kidney is responsible for the regulation of HCO−3 through reabsorption, production, and, in some situations, excretion of HCO−3. Kidneys reabsorb almost all of the filtered HCO−3 in the proximal and distal tubular segments of the nephron, and produce new HCO−3 to replace the amount consumed by acids through excretion of titratable acids and ammonium (see references [6,7,9,10,11,12,13,15,16,18,19,20,21] for more details).
Pure alterations in acid-base homeostasis are characterized by one of the four primary disorders, namely: (1) metabolic acidosis, (2) metabolic alkalosis, (3) respiratory acidosis, and (4) respiratory alkalosis. In addition to these pure acid-base alterations, combinations can occur ("mixed" acid-base disorders). The acid-base disorder is metabolic or respiratory depending whether the changes in HCO−3 or in pCO2 are due to dysregulation of renal or respiratory functions, respectively. In particular, the acid-base disorder is termed metabolic when the primary abnormality can be attributed to changes in HCO−3, either as a result of an inequality between net H+ production and renal HCO−3 reabsorption [18,22,23,24,25], or due to HCO−3 renal or gastrointestinal absorptive and secretion defects. Similarly, an acid-base disorder is termed respiratory if the primary abnormality is due to changes in pCO2, caused by imbalances between production and pulmonary excretion of CO2, or abnormality in respiratory function. The status of acid-base disorders is termed acidotic or alkalotic if the blood pH is below or above the normal physiological range (pH=7.40±0.02), respectively. Hence, acidosis or alkalosis refers to the process in which H+ concentration is increased or decreased, respectively.
Several mathematical models describing acid-base homeostasis in different systems have been proposed. Many of these models have been formulated as systems of algebraic equations, linear or nonlinear ordinary and partial differential equations [22,23,24,25,26,27]. Starting with the algebraic expression of Henderson-Hasselbalch relating pH, CO2 and HCO−3, there have been a series of context-specific applications of models describing acid-base homeostasis [26,27,28,29,30,31,32,33,34,35]. Lang and Zander [26], and Wolf and DeLand [27] developed a series of compartmentalized algebraic mathematical equations to describe acid-base status. In particular, Lang and Zander quantitatively examined the classical concept of HCO−3 dilution during dialysis [26]. Similarly, Wolf and DeLand described equilibrium distribution of water, electrolytes, metabolites and simple ionic species between plasma, erythrocyte and interstitial fluids [27]. The authors investigated the dilution effect of saline, acid or base addition on acid-base status. Thews and Hutten [34], and Dash and Bassingthwaighte [30] provided a comprehensive model of the transport exchange during hemodialysis. For example, Thews and Hutten [34], Ursino and colleagues [29,35] described the exchange processes of sodium, potassium, chloride, HCO−3, CO2, H+, O2, uremic catabolites, and other solute kinetics during hemodialysis. Similarly, Dash and Bassingthwaighte provided a detailed axially distributed nonlinear model to describe the transport and exchange of O2, CO2 and HCO−3 in red blood cells, plasma, interstitial fluid and parenchymal cells [30]. More recently, a series of sophisticated and large compartmental models have also been proposed. Sargent and colleagues and Marano and Marano [31,33] provided a simple analysis of bicarbonate-acetate kinetics to investigate bicarbonate disappearance during hemodialysis, and provide an analytical solution for the model. However, the model does not incorporate renal and respiratory mechanisms. Martin and colleagues [32] described an acid-base status model in the context of tumor-blood pH exchange kinetics, where renal and pulmonary regulatory mechanisms were included, but the authors ignored non-bicarbonate buffuring of the HCO−3/CO2 buffer system. In this paper, we include renal and pulmonary regulation of the acid-base kinetics, bicarbonate and bicarbonate buffering.
To examine quantitative alterations of systemic buffer kinetics, we present a mathematical model of serum pH regulation by the HCO−3/CO2 system, including renal and respiratory regulatory mechanisms (see section 2). Using the model, we simulate the four cardinal acid-base disorders, namely metabolic acidosis and alkalosis, and respiratory acidosis and alkalosis (see section 3.1), and provide quantitative validation of the model by comparing the model predictions with clinical data (see section 3.2). In addition, we perform uncertainty quantification and sensitivity analysis to identify parameters that can easily be altered to correct the pathophysiological disorders of interest in section 3.3. We end with a summary and concluding remarks outlining the shortcomings of the model and further research directions in section 4.
To model the effect of systemic acid-base homeostasis, we present a system of coupled nonlinear ordinary differential equations to describe the acid-base buffering kinetics through the HCO−3/CO2 system. In addition, we incorporate the relevant physiological regulatory mechanisms. We focus mainly on HCO−3/CO2 buffering kinetics, as it is the most effective buffer system that controls systemic pH. The pH of extracellular fluid is mainly regulated by three regulatory mechanisms, which act on different timescales, namely: (ⅰ) chemical acid-base buffering, (ⅱ) respiratory control, and (ⅲ) renal glomerular filtration and tubular function. We consider the following HCO−3 buffering system:
HCO−3+H+KH+,HCO−3⇌KCO2CO2+H2O. | (2.1) |
where we assume that carbonic anhydrase (CA) accelerates the carbonic acid reactions. Chemical acid-base buffering prevents excessive changes in pH, where the timescale of this process is usually in seconds. The ability of the lung to increase or decrease ventilation allows it to regulate CO2 removal as a gas in the expired air from the extracellular fluid, thereby adjusting the pH. In particular, due to continuous production of CO2 as a by-product of cellular metabolism, the ventilation rate must be able to accommodate alterations in CO2 in order to equilibriate the pH of the extracellular fluid. Although the process is fast (occurs in minutes), it is less effective than chemical buffering. If the acid-base imbalance persists, then kidneys excrete either excess acid or base. An adaptation process that takes hours to days. The kidneys, representing a very powerful regulatory system, have the ability to secrete large amount of H+ into the tubular lumen during metabolic acidosis. Also, excretion and reabsorption of HCO−3 also take place in the proximal tubule and distal tubule. In particular, in the proximal tubule, H+ is secreted through Na+/H+ countertransport-facilitated process, while HCO−3 is reabsorbed by combining with H+ to form carbonic acid, H2CO3, which is converted into CO2 and H2O (via carbonic anhydrase enzymatic activity). Most of the secreted H+ is used to reclaim the filtered HCO−3, and this rate of HCO−3 reabsorption is related to the rate of acid excretion.
To model acid-base homeostatic process, we track the concentrations of bicarbonate (YHCO−3(t)), carbon dioxide (YCO2(t)) and free hydrogen ions (YH+(t)). Using the Henderson-Hasselbalch mass-action kinetics with renal and pulmonary regulatory mechanisms described above (see [36,37]), the homeostatic dynamics of HCO−3/CO2 acid-base system is given as follows:
dYH+(t)dt=PH+−γH+YH+(t)−KH+,HCO−3YH+(t)YHCO−3(t)+KCO2YCO2(t), | (2.2) |
dYHCO−3(t)dt=PHCO−3+ϕCO2YCO2(t)−DHCO−3YHCO−3(t)−KH+,HCO−3YH+(t)YHCO−3(t)+KCO2YCO2, | (2.3) |
dYCO2(t)dt=PCO2−DCO2V0YCO2(t)+KH+,HCO−3YH+(t)YHCO−3(t)−KCO2YCO2(t), | (2.4) |
for t∈R0:=[0,+∞) with the following initial conditions YH+(0)=H0, YHCO−3(0)=B0 and YCO2(0)=C0, where the values are set to normal physiological state. The parameter PH+ represents the cellular production of H+, γH+ denotes H+ loss either due to renal clearance and/or non-bicarbonate buffering (e.g., buffering with albumin, Ca2+, PO3−4). The hydration and dehydration reaction rates are given by the parameters KH+,HCO−3 and KCO2, respectively, where the values have been adjusted to reflect the carbonic anhydrase activity [38]. In addition, PHCO−3 denotes HCO−3 therapy and/or supplementation, ϕCO2 represents acid secretion rate, PCO2 is the body or cellular (mitochondrial) production of CO2, and DHCO−3 the renal filtration rate of HCO−3. The effective ventilation rate (DCO2V0) captures the pulmonary removal of CO2, where V0 is the minute volume ventilation, and DCO2 is the ventilation rate. We note that the kinetics of H2O is not included in the above system of equations, for H2O is assumed to be abundant as a solvent. Figure 1 provides the model schematic.
The first two terms in Eq (2.2) account for production PH+ of H+ from the body, either through consumption and/or through other processes (e.g., cellular metabolism), and γH+YH+ is the removal of H+ as either a titratable acid and/or ammonium or non-carbonate buffering (e.g., buffering with phosphate, calcium). The third and last terms correspond to buffering reaction kinetics. For Eq (2.3), the first term, PHCO−3, represents HCO−3 therapy, the second and third terms, ϕCO2YCO2(t)−DHCO−3YHCO−3(t), describe renal filtration processes, where we assume that the amount of HCO−3 lost to kidney from the blood through filtration is related to filtered load, and the equivalence of HCO−3 reabsorption and acid excretion is through the splitting of CO2 by intracellular carbonic anhydrase enzymatic activity. That is, an increase in CO2 concentration increases the conversion of CO2 into H+ and HCO−3 in a normally functioning kidney, which, in turn, results in higher acid secretion into the urine and HCO−3 absorption into bloodstream. Hence, the second term describes acid secretion, whereas the third term is the HCO−3 load to be filtered. Similarly, Eq (2.4) constitutes the buffering kinetics, where the first term, PCO2, is production of CO2 in the body (e.g., cellular metabolic or mitochondrial process), and the second term, DCO2V0YCO2(t), is the removal of CO2 through respiratory ventilation by the lung, which depends on blood volume, cardiac output, arteriovenous difference (concentration difference between arterial and venous blood) of CO2 (see [25,39]). In principle, the ventilation rate V0 depends on pCO2, oxygen partial pressure (pO2), and pH [24,25,39]. But we assume that V0 is constant in the above model. In addition, PH+, PHCO−3 and PCO2 can also be time-dependent. For example, in the context of hemodialysis, PH+, PHCO−3, pO2 and V0 may vary during the treatment.
Throughout this paper, Eqs (2.2)–(2.4) were solved using stiff ode15s solver in MATLAB (The MathWorks, Inc., Natick, MA, USA), where the model is parametrized to normal physiological initial conditions of pCO2=40 mm Hg, HCO–3=24 mmol/L, and pH =7.4 (other model parameters are obtained from literature data, see Table 1). Due to the nonlinear nature of the model, we do not provide an analytical solution of the systems in Eqs (2.2)–(2.4), but solve the system numerically. Perturbation methods and other similar analysis can be used to disentangle the multiple scale aspects of the model but are beyond the scope of this study.
Bicarbonate buffer kinetic system | ||||
Description | Symbols | Values (range) | Units | Refs. |
Parameters | ||||
Hydration reaction rate | KH+,HCO−3 | 3.437(1.72,6.87)×1010 | L/mol/s | calculated |
Dehydration reaction rate | KCO2 | 2.736(1.37,5.46)×104 | s−1 | [23] |
Production of hydrogen ion | PH+ | 1.2(0.6,2.4)×10−6 | mol/L/s | [23] |
Bicarbonate Supplementation/Therapy | PHCO−3 | 0(−1.2,1.2×10−6) | mol/L/s | assumed, [22,23] |
Production of carbon dioxide | PCO2 | 3(1.5,6)×10−6 | mol/L/s | [22,23] |
Acid secretion rate | ϕCO2 | 7.09(3.55,14.2)×10−3 | s−1 | calculated |
Renal filtration rate | DHCO−3 | 3.5461(1.77,7.09)×10−4 | s−1 | [22] |
Ventilation rate | DCO2 | 2.5(1.25,5)×10−2 | L−1 | [22,23] |
Removal of H+ | γH+ | 30.151(15.08,60.30) | s−1 | calculated |
Initial conditions | ||||
Hydrogen ion concentration (H+) | Y0H+ | 3.98×10⁻⁸ | mol/L | [22] |
Bicarbonate ion concentration (HCO−3) | Y0HCO−3 | 2.4×10⁻² | mol/L | [22] |
Carbon dioxide concentration (CO2) | Y0CO2 | 1.2×10⁻³ | mol/L | [22] |
Minute ventilation | V0 | 0.10 | L/s | [24] |
In order to ensure the model can be useful in the context of prescribing therapeutic interventions and for precision and predictive medicine, the model must accurately and verifiably describe clinically observed pathophysiological conditions, both in terms of serum pH and secondary physiologic compensatory responses. To that effect, we simulate the normal physiological condition, and pathophysiological disorders, namely: (ⅰ) respiratory acidosis and (ⅱ) alkalosis, and (ⅲ) metabolic acidosis and (ⅳ) alkalosis. It should be noted that each of these disorders can further be subdivided into subetaoups, depending on the anion gap in the case of metabolic acidosis, Cl− sensitivity in metabolic alkalosis, or chronic or acute status of the respiratory disorders. In the proceeding discussion, we will not distinguish between these subdivisions.
Under normal physiological state, the normal range of HCO−3 is 24±2 mmol/L, and the range for pCO2 is 40±2 mm Hg, resulting in a normal pH range of 7.40±0.02. Figure 2 shows that, under normal physiological condition, the blood pH is set to the steady state value of 7.40, with pCO2 value of 40 mm Hg and HCO−3 of 24 mmol/L.
To simulate the four disorders, we can alter various parameter values to disequilibrate pCO2 and HCO−3 either individually or jointly, thereby changing the value of pH. In particular, creating an imbalance between body (mitochondrial) CO2 production and pulmonary CO2 excretion will result in changes in pCO2, while disturbing H+ production and renal HCO−3 generation and HCO−3 reclamation/H+ excretion will affect HCO−3 levels.
In metabolic acidosis, the rate of renal generation of HCO−3 fails to equate the rate of the exogenous and/or endogenous H+ production, often caused by an increased influx of H+ (exogenous and/or endogenous means such as intoxication or ketoacidosis), a decreased renal HCO−3 generation (e.g., renal failure) or excessive loss of renal (e.g., proximal tubular acidosis) or gastrointestinal (e.g., diarrhea) absorptive capabilities. Figure 3 shows that, as the level of bicarbonate concentration drops, pCO2 level decreases and reaches a new equilibrium. This is due to the fact, as a secondary compensatory response, the respiratory center is stimulated to increase alveolar ventilation, creating a rate differential between mitochrondial production and pulmonary excretion of CO2. It should be noted that, although we have assumed that renal acid excretion rate is constant, changes in net renal filtration in response to chronic metabolic acidosis is mediated by increased generation and excretion of ammonia, which is not included in our model. However, the dynamics observed in Figure 3 are still valid, where the cause of metabolic acidosis is due to diseases such as chronic kidney disease and distal renal tubular acidosis (see Appendix A for additional illustration of the behavior of the model where metabolic acidosis is induced by administration of 7 mEq/l/kg/day of HCl in mongrel dogs). In metabolic alkalosis, the disorder is caused by an increased influx of HCO−3 into the extracellular fluid due to the inability of the kidney to excrete excess HCO−3 as a result of either (1) decreased GFR as in volume depleted patients, or (2) increased rate of renal absorption of HCO−3 (e.g., enhanced renal tubular HCO−3 reclamation). Figure 4 illustrates the temporal behavior of the model in metabolic alkalosis, where pH level increases as a consequence of increased serum HCO−3 and pCO2 as a secondary compensatory respiratory response induced by hypoventilation. Furthermore, we observe that each of these metabolic disorders equilibrate at different timescales. These observations are consistent with clinical observation (see [40]) where the compensatory responses take 12–24 hours for metabolic acidosis (Figure 3), and approximately 24–72 hours for metabolic alkalosis (Figure 4).
Simulating respiratory disorders by altering pulmonary excretion of CO2 (e.g., hyper- or hypoventilation, where CO2 production and removal are changed), we observe that changes in CO2 induce clinically expected alterations in HCO−3 and H+, before the effect of secondary renal compensatory responses affect the level of reabsorbed HCO−3 and restore pH to normal range. In particular, Figure 5 shows that during respiratory acidosis, pH level decreases initially before renal mechanism restores pH homeostasis to a value close to 7.4. Similarly, for respiratory alkalosis, the trajectory is reversed, where pH level increases before decreasing to a level above pH = 7.4 while both pCO2 and HCO−3 decreases (Figure 6). In addition, the timescale of renal compensation to equilibrate pH level is within 1–2 days in the case of alkalosis and 2–3 days in the case of respiratory acidosis [22,23,24,25]. Both of these timescales are observed clinically [41,42,43,44]. In addition, pCO2 is inversely proportional to alveolar ventilation. Moreover, we also note that the steady-state values of the secondary compensatory responses predicted by the primary disturbances in both metabolic and respiratory disorders are in good agreement with clinical studies examining these disorders [22,23,24,25,41,42,43,44].
In the previous discussion, we illustrated that the model qualitatively predicts clinical observations in terms of pH, the directionality of primary disturbances and secondary compensatory responses, and timescales. To quantitatively compare the results of the model to that of clinical data on acid-base disorders, we generated multiple type of disturbances by alterating relevant parameters to induce metabolic and respiratory disorders, and track the steady-state values of the state variables in order to compare them with the clinically observed values.
For metabolic acidosis, Figure 7 shows the model validation results where we compared the model steady state output with that of empirical data from Bushinsky and colleagues [42]. Figure 7a shows the empirical serum HCO−3 value with respect to pCO2 level as a result of secondary respiratory compensation, where each data point corresponds to a single patient with metabolic acidosis due to acetazolamide-induced (23 patients), NH4Cl-induced (40 patients), renal tubular (48 patients), uremic (113 patients), and mixed (118 patients) acidosis. Figure 7b shows similar results of model steady-state values for those involved exhibiting metabolic acidosis, where H+ production and buffering, and renal filtration terms and HCO−3 depletion are uniformly randomly generated. The 95% confidence interval region and regression line are those of the Figure 7a. We can see that the model generated results are within the confidence interval of the empirical data observed by Bushinsky et al. [42]. For example, for metabolic acidosis, we observe a simulated steady state value around 18.6 mM for HCO−3 and a respiratory compensation value of 36.8 mmHg for pCO2 (Figure 3b, c). If we use the equation in Table 2 (i.e., a linear equation regressed against the data provided in [42], instead of the piece-wise linear equation of Bushinsky and colleague), we obtain a predicted value of 33.3 mmHg for pCO2. This value is 3.5 mmHg below the simulated pCO2. However, both values are within the confidence interval of Figure 7. Similarly, if we instead use Winters Formula (see [41]) for the same simulated HCO−3 value, we obtain a predicted pCO2 value of 35.8±2 mmHg. Then, the observed pCO2 is within the value predicted by Winters formula. In addition, comparing the given secondary respiratory compensation simulated by the model with that of the predicted clinical values (as computed from the empirical equation in Table 2), we obtained a linear relationship, where the regression line, with a slope of 0.898 and intercept of 2.22, has a R2=0.929 as compared to identity line with R2=0.916 (Figure 8a). For all intended purposes, the dynamic model performs very well with respect to metabolic acidosis.
Secondary Compensatory Responses | |||||
Types | y | Intercept (b) | Slope (m) | x | Refs. |
Metabolic Disorders | |||||
Acidosis | pCO2 | 10.6494 | 1.2152 | HCO−3 | [41,42]⋆ |
Alkalosis | pCO2 | 20 | 0.7 | HCO−3 | [45,46] |
Respiratory Disorders | |||||
Acidosis (chronic) | HCO−3 | 4.7364 | 0.4760 | pCO2 | [43,44]⋆⋆ |
Alkalosis (chronic) | HCO−3 | 4.0 | 0.5 | pCO2 | [47] |
Similarly for metabolic alkalosis, there is a predictable relationship between the primary metabolic disturbance of excess HCO−3 and the corresponding secondary respiratory compensation. Taking the HCO−3 steady-state values simulated by the model and calculating the clinically predicted observed pCO2 values from Table 2, we compare the results with the observed pCO2 values from the model. We observe that the predicted and the observed secondary compensations are in good agreement (Figure 8b). Performing similar computation as in the case of metabolic acidosis, we observe that, with a steady-state HCO−3 value of 33.5, the predicted compensation value for pCO2 is 43.45 mmHg, which is close to the model-simulated value of 43.5 mmHg (Figure 4). As in Figure 8a, most of the points in Figure 8b are on the identity line with a R2=0.805, while the regression line has a slope of 0.779 and intercept of 9.32, with R2=0.893, which implies that the predicted and the observed secondary respiratory compensation to metabolic alkalosis are very similar. Similar observations are made in the case of respiratory disorders, where we have only considered the chronic cases (Figure 8c, d). There is clearly a linear correlation between the model and expected observations (for respiratory acidosis, the identity line has R2=0.865 whereas the regression line has R2=0.870 with the slope of 0.926 and intercept of 2.46 (Figure 8c), and for respiratory alkalosis, the identity line has R2=0.903 whereas the regression line has R2=0.926 with the slope of 0.872 and intercept of 2.20 (Figure 8d). Clearly, in most of these quantitative validations, the model predicted the secondary responses to the primary disturbances of both metabolic and respiratory disorders. For metabolic disorders, the comparisons between simulated and clinically predicted values are close. For respiratory disorders, we observe that the steady state values in Figures 5 and 6 are over- and under-corrected with that clinically expected values, respectively, for respiratory acidosis and alkalosis. This could be due to the fact that we assume linear respiratory compensation term with a constant ventilation rate, particularly in V0. In theory, V0 depends on pH, pO2, and pCO2, which could be one possible reason for the divergence between some of the model simulated and clinically expected compensatory responses for respiratory disorders.
To quantify the levels of uncertainty and sensitivity of model output of Eqs (2.2)–(2.4), we characterize the level of uncertainty each of the model parameters exhibits. Following Blower and Dowlabatadi [48], and Marino and colleagues [49], latin hypercube sampling (LHS) (with 10,000 uniformly distributed samples) is used to quantify the uncertainties associated with the parameter values and their effects on the in silico results. In conjunction with the uncertainty quantification, we employed partial rank correlation coefficient (PRCC) to quantitate the impact of sensitivity of all the state variables to each of the model parameters (the parameter values and ranges used in these analyses are listed in Table S1 in Appendix B, for normal physiological condition and different types of acidemia). Table S1 summarizes the full results of the sensitivity analysis with sensitivity coefficients (PRCC values). The sensitivity analyses with respect to steady-state values of pH are for normal physiological condition, and for metabolic acidosis as a result of renal insufficiency, proximal and distal tubular acidosis (Figure 9).
For healthy individuals, Figure 9a shows that the predominant parameters affecting pH are those involving renal function (acid secretion rate (ϕCO2) and HCO−3 reabsorption rate (DHCO−3)), HCO−3 therapy (PHCO−3), reaction rates or pKa of the buffer system, production (PH) and removal or non-bicarbonate buffering of protons (γH). Therapies targeting these parameters may have a strong effect on correcting pH disturbances, where the sign of the correlation indicates the directionality of therapeutic targets. That is, since acid secretion rate, ϕCO2, bicarbonate therapy, PHCO−3, forward reaction (hydration) rate, KH+,HCO−3 and removal or non-bicarbonate buffering of protons γH are positively correlated with respect to pH levels, therapeutic interventions increasing these parameters will increase pH level. For example, HCO−3 supplementation or usage of acid-binders will increase serum pH. Similarly, due to negative correlation, therapeutic intervention decreasing HCO−3 reabsorption rate (DHCO−3), backward (dehydration) reaction rate and hydrogen body production, PH, will also increase pH.
For individuals with metabolic acidosis, correcting acidosis requires correcting the pH level to near normal. Sensitivity analysis, as shown in Figure 9b suggests that, for metabolic acidosis due to renal insufficiency or failure (RF), increasing respiratory CO2 removal (DCO2), HCO−3 supplementation or therapy (PHCO−3, e.g., NaHCO3 or Hemodialysis), hydration reaction rate (KH,HCO−3), and/or removal of excess proton (e.g., through acid-binder supplementation) will be effective. Alternatively, similar correction of pH can be achieved by decreasing body production of CO2 (PCO2), dehydration reaction rate (KCO2), and/or body production of acid (e.g., through dietary restriction of protein-rich diets). For distal or Type Ⅰ renal tubular acidosis (dRTA or RTA-Ⅰ), the directionality of most of the sensitive parameters shown in the case of RF (Figure 9c) are also observed in the case of RTA type Ⅱ or proximal tubular (pRTA or RTA-Ⅱ, Figure 9d). In addition, decreasing HCO−3 renal reabsorption (DHCO−3) can help increase the level of pH to normal. Unlike RTA-Ⅰ, the set of sensitive parameters are different in the case of RTA-Ⅱ. In particular, Figure 9d shows that, increasing ventilation rate (DCO2), acid secretion rate, ϕCO2, HCO−3 supplementation or therapy (PHCO−3), and/or hydration reaction rate (KHHCO−3), or decreasing dehydration reaction rate (KCO2) can increase the level pH and thereby correct metabolic disorder. We note that, in the case of RTA-Ⅱ, body production of CO2 is no longer effective in correcting pH level as observed in the case of RTA-Ⅰ. In all of the analysis, it should be noted that the reaction rates are important and can strongly change the effect of the buffer since they determine the pKa value of the system, which is not surprising. Thus, sensitivity analysis suggests that, (1) altering the sensitive parameters outlined above under different induced acidemia can help increase the level of pH, and (2) therapeutic strategies for some of the disorders may be different depending on the pathophysiology. It should be noted that some model parameters might be difficult to physiologically manipulate while other parameters are easier to control in order to achieve certain desired effects. For instance, controlling hydration and dehydration reaction rates may, in practice, require physiological modification of enzymatic activities of carbonic anhydrase, whereas controlling body production and/or removal of acid can be achievable by dietary modification and/or by using acid-binders such as veverimer (or TRC101).
We developed a system of three coupled multiscale nonlinear ordinary differential equations to describe HCO−3/CO2 buffering system with Henderson-Hasselbalch mass-action kinetics. We incorporated relevant physiological processes, including renal and respiratory regulatory mechanisms, body production of both CO2 and H+, and lumped together the effects of non-bicarbonate buffering of H+. We accurately predicted normal physiological conditions, as well as metabolic and respiratory disorders (e.g., acidosis and alkalosis), where the in silico results are in good agreement with qualitative and quantitative clinical observations of metabolic and respiratory acid-base disorders. In particular, we showed that, under respiratory disorders, disturbance in CO2 induces changes in HCO−3 and H+ concentrations, before secondary renal compensatory response alters the amount of reabsorbed HCO−3 and restores pH. Furthermore, when inducing metabolic acid-base disorders, we do not observe such effective respiratory compensation, and the pH never returns to the normal range. These predictions were quantitatively verified by comparing the predicted responses with clinically observed secondary compensations. Results were found to be consistent. There are several clinical studies showing that there is a predictable linear relationship between primary acid-base disturbances and elicited secondary compensatory responses [41,42,43,44]. Furthermore, in order to identify potential effective therapeutic interventions, we performed uncertainty quantitification and sensitive analysis under normal and pathological conditions due to complete renal failure, and promixal and distal renal tubular disorders by disturbing the acid secretion and/or bicarbonate reabsorption terms or both. We found that systemic pH is sensitive to renal acid secretion and reabsorption, acid production and excretion/removal, reaction kinetics rates, and bicarbonate therapeutic interventions. In addition, we found that different pathologies might require different therapeutic interventions. For example, bicarbonate supplementation or HD therapy, acid-binder based therapy and acid-reducing dietary strategies might be effective in increasing systemic pH under pathologies caused by renal failure and dRTA, but not necessarily in the case of pRTA where acid-binder based therapy and acid-reducing dietary strategies are not sensitive. Ongoing studies by our research group are currently exploring these possibilities, including, but not limited to, HCO−3, alkali and TRC101 (a novel sodium-free non-absorbed hydrochloric acid binding agent to treat chronic kidney disease-associated metabolic acidosis, see Bushinsky and colleagues [50]) therapies in the context of chronic kidney and end-stage renal diseases.
The model presented herein is based on some simplistic assumptions of the renal and respiratory regulatory mechanisms that might be more restrictive. In the model, we assume that body production rates of H+ and CO2 are constant, which depend on consumption and/or other processes (e.g., cellular/mitochondrial metabolism) and may not be realistic. We also use a very simplified description of renal and respiratory regulation of the acid-base system, and restrictive assumptions on other intrinsic non-bicarbonate buffers. For instance, we did not include a detailed mechanistic description of renal filtration of HCO−3, and ventilation. For example, clinical observations suggest that ventilation rate is a function of CO2, and depends on pH and, to some extent, oxygen O2 [24,25]. The effects of peripheral chemoreceptors on inducing intrinsic delay in respiratory response are ignored. Incorporation of these refinements could further strengthen the quantitative predictive power of the model. We also do not include the dynamics of increased ammonia genesis to correct metabolic acidosis and detailed bone buffering of acid and base [21]. Despite all these shortcomings and simplifications, the model was able to qualitatively and quantitatively predict systemic acid-base homeostasis under normal physiological condition, and primary metabolic and respiratory acid-base disturbances and secondary compensatory responses. The model can be extended to incorporate different therapeutic modules in order to provide pathophysiologic insights and to assess the safety and efficacy of different therapeutic strategies to control or correct these disorders.
The authors are grateful to the two anonymous reviewers for their very constructive comments, which have significantly enhanced the manuscript.
P.K. holds performance stock in Fresenius Medical Care (FMC). The Renal Research Institute is a wholly owned subsidiary of FMC. P.K. receives author royalties from UpToDate.
To further illustrate the applicability of the model described in the text, we digitally extracted the mongrel dog data in [51]. The authors administered a daily dose of 7 mEq/kg of HCl to dogs (Figure 1 of [51]). We assumed body weight of 17 kg, a GFR of 2.9±0.3 mL/min/kg, and 86 mL/kg of blood volume for average mongrel dog; we kept KCO2 and KHHCO3 values the same. Assuming that the dog is in steady state during the period before the administration of HCl, DHCO−3=GFRBloodvolume and ϕCO2=DHCO−3YHCO−3(0)YCO2(0) for the renal filtration components of the model are calculated. From the model, remaining 3 parameters (i.e., PCO2, ˜DCO2=DCO2V0, γH+) are estimated using the Nelder-Mead algorithm. Figure S1 shows that the model was able to capture the dynamics of academia in mongrel dogs.
In this section, we summarize the parameter uncertainty and sensitivity analyses. Parameter uncertainty and sensitivity analyses are performed on the steady state values of the model, namely HCO−3,H+, pH and CO2. These are used to determine the sensitivity of the acid-base dynamics and homeostatic control. Uniform distribution is assigned for each of the model parameters, where baseline value of each of the parameter is multiplied and divided by a factor of 2, as maximum and minimum for the distribution. For JHCO−3, we assume JHCO−3∈[−1.2,1.2]×10−6 mol/L/s. In addition, for each of the parameters, sample sizes of 10000 values are randomly generated over 10 realizations, where Latin Hypercube Sampling technique is used (see [48,49]). Table S1 shows the summary, and all the values are statistically significant with p<0.001, except few parameters (indicated by ∗ or ∗∗). Table S1 shows the detailed results of PRCCs for normal healthy conditions (full model), and under renal insufficiency, dRTA Ⅰ and pRTA Ⅱ scenarios.
PRCC | ||||||||
Parameters | HCO−3 | CO2 | H+ | pH | HCO−3 | CO2 | H+ | pH |
Healthy | Complete Renal Insufficiency | |||||||
PH | 0.3199 | 0.5679 | 0.4186 | −0.4186 | −0.4326 | 0.3910 | 0.7628 | −0.7628 |
γH | −0.4630 | −0.6930 | −0.5311 | 0.5311 | 0.6998 | −0.6543 | −0.9292 | 0.9292 |
KHHCO3 | 0.5190 | 0.7245 | −0.8273 | 0.8273 | −0.6825 | 0.6990 | −0.6320 | 0.6320 |
KCO2 | −0.4762 | −0.7002 | 0.8358 | −0.8358 | 0.6945 | −0.6702 | 0.6360 | −0.6360 |
PHCO3 | 0.5935 | 0.3460 | −0.3820 | 0.3820 | 0.8562 | 0.6607 | −0.6768 | 0.6768 |
DHCO3 | −0.7407 | −0.3999 | 0.5633 | −0.5633 | – | – | – | – |
ϕCO2 | 0.8909 | 0.6333 | −0.7601 | 0.7601 | – | – | – | – |
PCO2 | 0.9157 | 0.9161 | 0.1127∗∗ | −0.1127∗∗ | 0.9030 | 0.9533 | 0.7415 | −0.7415 |
DCO2 | −0.7728 | −0.8297 | −0.2714 | 0.2715 | −0.6515 | −0.8345 | −0.6390 | 0.6390 |
dRTA or RTA Ⅰ | pRTA or RTA Ⅱ | |||||||
PH | −0.2916 | 0.3864 | 0.7675 | −0.7675 | 0.3086 | 0.5811 | 0.3373 | −0.3373 |
γH | 0.6376 | −0.7442 | −0.9518 | 0.9518 | −0.4972 | −0.6316 | −0.1611 | 0.1611 |
KHHCO3 | −0.6260 | 0.7546 | −0.6009 | 0.6009 | 0.4013 | 0.5949 | −0.8707 | 0.8707 |
KCO2 | 0.6572 | −0.7288 | 0.5992 | −0.5992 | −0.4566 | −0.6256 | 0.8828 | −0.8828 |
PHCO3 | 0.8546 | 0.7110 | −0.5625 | 0.5625 | 0.5889 | 0.2830 | −0.4806 | 0.4806 |
DHCO3 | −0.7470 | −0.5817 | 0.4915 | −0.4915 | – | – | – | – |
ϕCO2 | – | – | – | – | 0.8886 | 0.4728 | −0.8224 | 0.8224 |
PCO2 | 0.9130 | 0.9528 | 0.8516 | −0.8516 | 0.9143 | 0.9196 | −0.1126∗ | 0.1126∗ |
DCO2 | −0.5897 | −0.7536 | −0.5804 | 0.5804 | −0.7729 | −0.8902 | −0.4156 | 0.4156 |
In the text, we emphasize pH as response quantity with respect to the model parameters. For healthy person, in order to correct HCO−3 level, say increase, either γH, KCO2, DHCO3 and DCO2 must be decreased or KHHCO3, PHCO3, ϕCO2 and PCO2 be increased, as these parameters are the most influential in affecting the dynamics HCO−3. While from CO2 perspective, decreasing γH, KCO2 and DCO2 or increasing PH, KHHCO3, ϕCO2 and PCO2 will increase CO2 level. These relationship are different in the case of physiopathologies inducing difficiency in some of these parameters to change HCO−3 or CO2 level. For example, for complete renal failure, decreasing PH, DCO2 and KHHCO3 or increasing γH, KCO2, PCO2 and PHCO3 will have the most significant impact on increasing HCO−3 level, whereas only decreasing γH, KCO2 and DCO2 or increasing KHHCO3, PHCO3 and PCO2 will increase CO2 level. Similarly observations can be seen in the cases of RTA Ⅰ and Ⅱ. In addition, the directionality of the sensitivity analysis suggests therapeutic approaches. For instance, in renal failure, to increase HCO−3 level usually HCO−3 supplementation or minimal consumption of protein-rich diets are suggested. These two approaches usually affect PHCO3 and PH, respectively. Increasing γH is equivalent to removing H+, which could increase HCO−3. This approach is related to the suggested use of TRC101, an acid-binder that bind to H+ and Cl, to increase HCO−3.
[1] | W. B. Busa, R. Nuccitelli, Metabolic regulation via intracellular pH, Am. J. Physiol., 246 (1984), R409-R438. |
[2] | T. E. DeCoursey, The intimate and controversial relationship between voltage-gated proton channels and the phagocyte NADPH oxidase, Immunol. Rev., 273 (2016), 194-218. |
[3] | E. K. Hoffmann, L. O. Simonsen, Membrane mechanisms in volume and pH regulation in vertebrate cells, Physiol. Rev., 69 (1989), 315-382. |
[4] | A. Roos, W. F. Boron, Intracellular pH, Physiol. Rev., 61 (1981), 296-434. |
[5] | A. Schonichen, B. A. Webb, M. P. Jacobson, D. L. Barber, Considering protonation as a posttranslational modification regulating protein structure and function, Annu. Rev. Biophys., 42 (2013), 289-314. |
[6] | K. F. Atkinson, S. M. Nauli, pH sensors and ion Transporters: Potential therapeutic targets for acid-base disorders, Int. J. Pharma Res. Rev., 5 (2016), 51. |
[7] | W. F. Boron, Acid-base transport by the renal proximal tubule, J. Am. Soc. Nephrol., 17 (2006), 2368-2382. |
[8] | V. Fencl, J. Vale, J. Broch, Respiration and cerebral blood flow in metabolic acidosis and alkalosis in humans, J. Appl. Phys., 27 (1969), 67-76 |
[9] | L. L. Hamm, N. Nakhou, K. S. Hering-Smith, Acid-base homeostasis, Clin. J. Am. Soc. Nephrol., 10 (2015), 2232-2242. |
[10] | D. Hornick, An approach to the analysis of arterial blood gases and acid-base disorders, Virtual Hospital, University of Iowa Health Care [On-line], 2003. |
[11] | M. Levitzky, Pulmonary Physiology, McGraw-Hill Book Company, 2003. |
[12] | C. Lote, Principles of Renal Physiology, Kluwer Academic Publishers, 1999. |
[13] | N. A. Masco, Acid-base homeostasis, J. Infusion Nurs., 39 (2016), 288-295. |
[14] | R. Mitchell, M. Singer, Respiration and cerebrospinal fluid pH in metabolic acidosis and alkalosis, J. Appl. Phys., 20 (1965), 905-911. |
[15] | G. T. Nagami, L. L. Hamm, Regulation of acid-base balance in chronic kidney disease, Adv. Chronic kidney Dis., 24 (2017), 274-279. |
[16] | R. Pitts, Physiology of the Kidney and Body Fluids, Year Book Medical Publishers Inc, 1970. |
[17] | J. Poppell, P. Vanamee, K. Roberts, H. Randall, The effect of ventilatory insufficiency on respiratory compensations in metabolic acidosis and alkalosis, J. Lab. Clin. Med., 47 (1956), 885-890. |
[18] | R. Quigley, Acid-base homeostasis. Clin. Pediatr. Nephrol., 2016, 235. |
[19] | W. B. Schwartz, J. J. Cohen, The nature of the renal response to chronic disorders of acid-base equilibrium, Am. J. Med., 64 (1978), 417-428. |
[20] | L. A. Skelton, W. F. Boron, Y. Zhou, Acid-base transport by the renal proximal tubule, J. Nephrol., 23 (2010), S4. |
[21] | J. Lemann Jr., D. A. Bushinsky, L. L. Hamm, Bone buffering of acid and base in humans, Am. J. Physiol. Renal Physiol., 285 (2003), F811-F832. |
[22] | H. Davenport, The ABC of acid-base chemistry, The University of Chicago, Chicago, IL, 1974. |
[23] | R. Hainsworth, Acid-Base Balance, Manchester University, UK, 1986. |
[24] | J. B. West, Respiratory Physiology, 9th edition, Lippincott Williams and Wilkins, Philadelphia, PA, 2012. |
[25] | J. Widdicombe, A. Davies, Respiratory Physiology, Edward Arnold Publishers, 1983. |
[26] | W. Lang, R. Zander, Prediction of dilutional acidosis based on the revised classical dilution concept for bicarbonate, J. Appl. Phys., 98 (2005), 62-71. |
[27] | M. B. Wolf, E. C. DeLand, A mathematical model of blood-interstitial acid-base balance: Application to dilution acidosis and acid-base status, J. Appl. Phys., 110 ( 2011), 988-1002. |
[28] | K. Annan, Mathematical modeling of the dynamic exchange of solutes during bicarbonate dialysis, Math. Comput. Modell., 55 (2012), 1691-1704. |
[29] | L. Coli, M. Ursino, A. De Pascalis, C. Brighenti, V. Dalmastri, G. La Manna, et al., Evaluation of intradialytic solute and fluid kinetics, Blood Purif., 18 (2000), 37-49. |
[30] | R. K. Dash, J. B. Bassingthwaighte, Simultaneous bloodtissue exchange of oxygen, carbon dioxide, bicarbonate, and hydrogen ion, Ann. Biomed. Eng., 34 (2006), 1129-1148. |
[31] | S. Marano, M. Marano, Frontiers in hemodialysis: Solutions and implications of mathematical models for bicarbonate restoring, Biomed. Signal Process. Control, 52 (2019), 321-329. |
[32] | N. K. Martin, E. A. Gaffney, R. A. Gatenby, R. J. Gillies, I. F. Robey, P. K. Maini, A mathematical model of tumour and blood pHe regulation: The HCO3-/CO2 buffering system, Math. Biosci., 230 (2011), 1-11. |
[33] | J. A. Sargent, M. Marano, S. Marano, F. J. Gennari, Acidbase homeostasis during hemodialysis: New insights into the mystery of bicarbonate disappearance during treatment, Semin. Dial., (2018), 1-11. |
[34] | O. Thews, H. Hutten, A comprehensive model of the dynamic exchange processes during hemodialysis, Med. Prog. Technol., 16 (1990), 145-161. |
[35] | M. Ursino, L. Coli, C. Brighenti, L. Chiari, A. De Pascalis, G. Avanzolini, Prediction of solute kinetics, acid-base status, and blood volume changes during profiled hemodialysis, Ann. Biomed. Eng., 28 (2000), 204-216. |
[36] | K. A. Hasselbalch, Die berechnung der wasserstoffzahl des blutes aus der freien und gebundenen kohlensure desselben, und die sauerstoffbindung des blutes als funktion der wasserstoffzahl, Biochem. Z., 78 (1917), 112-144. |
[37] | L. J. Henderson, Concerning the relationship between the strength of acids and their capacity to preserve neutrality, Am. J. Physiol., 21 (1908), 173-179. |
[38] | C. Chegwidden, E. Edwards, Carbonic Anhydrases: New Horizons, Birkhauser Press, 2000. |
[39] | J. J. Batzel, F. Kappel, D. Schneditz, H. T. Tran, Cardiovascular and Respiratory Systems: Modeling, Analysis, and Control, SIAM, Philadelphia, 2007. |
[40] | Memorang, Compensation Reactions to Acid/Base Imbalance [online]. Available from: https://www.memorangapp.com/flashcards/94371/Compensation+Reactions+to+Acid/2FBase+Imbalance (last accessed 24 April 2020). |
[41] | M. S. Albert, R. B. Dell, R. W. Winters, Quantitative displacement of acid-base equilibrium in metabolic acidosis, Ann. Int. Med., 66 (1967), 312-322. |
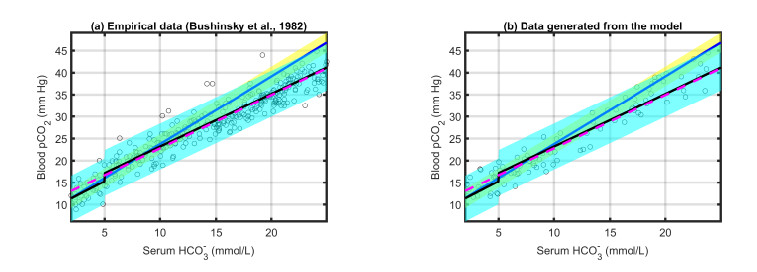
[42] | D. A. Bushinsky, F. L. Coe, C. Katzenberg, J. P. Szidon, J. H. Parks, Arterial PCO2 in chronic metabolic acidosis, Kidney Int., 22 (1982), 311-314. |
[43] | K. Engel, R. B. Dell, W. J. Rahill, C. R. Denning, R. W. Winters, Quantitative displacement of acid-base equilibrium in chronic respiratory acidosis, J. Appl. Phys., 24 (1968), 288-295. |
[44] | S. B. Gonzlez, G. Menga, G. A. Raimondi, H. Tighiouart, H. J. Adrogu, N. E. Madias, Secondary response to chronic respiratory acidosis in humans: A prospective study, Kidney Int. Rep., 3 (2018), 1163-1170. |
[45] | A. Hasan, The Analysis of Blood Gases: Handbook of Blood Gas/Acid-Base Interpretation, Springer London, (2013), 253-266. |
[46] | S. Javaheri, N. S. Shore, B. Rose, H. Kazemi, Compensatory hypoventilation in metabolic alkalosis, Chest, 81 (1982), 296-301. |
[47] | K. Roberts, J. Poppell, P. Vanamee, R. Beals, H. Randall, Evaluation of respiratory compensation in metabolic alkalosis, J. Clin. Invest., 35 (1956), 261-266. |
[48] | S. M. Blower, H. Dowlatabadi, Sensitivity and uncertainty analysis of complex models of disease transmission: An HIV model, as an example, Int. Stat. Rev., 2 (1994), 229-243. |
[49] | S. Marino, I. B. Hogue, C. J. Ray, D. E. Kirschner, A methodology for performing global uncertainty and sensitivity analysis in systems biology, J. Theor. Biol., 254 (2008), 178-196 |
[50] | D. A. Bushinsky, T. Hostetter, G. Klaerner, Y. Stasiv, C. Lockey, S. McNulty, et al., Randomized, controlled trial of tRC101 to increase serum bicarbonate in patients with CKD, Clin. J. Am. Soc. Nephrol., 13 (2018), 26-35. |
[51] | R. C. De Sousa, J. T. Harrington, E. S. Ricanati, J. W. Shelkrot, W. B. Schwartz, Renal regulation of acid-base equilibrium during chronic administration of mineral acid, J. Clin. Invest., 53 (1974), 465-476. |
1. | Paulo Paneque Galuzio, Alhaji Cherif, Recent Advances and Future Perspectives in the Use of Machine Learning and Mathematical Models in Nephrology, 2022, 29, 15485595, 472, 10.1053/j.ackd.2022.07.002 | |
2. | O. I. Dotsenko , The whole-cell kinetic metabolic model of the pH regulation mechanisms in human erythrocytes , 2022, 13, 2520-2588, 272, 10.15421/022235 | |
3. | Mohammad Partohaghighi, Abdullahi Yusuf, Mustafa Bayram, New Fractional Modelling, Analysis and Control of the Three Coupled Multiscale Non-Linear Buffering System, 2022, 8, 2349-5103, 10.1007/s40819-022-01290-9 | |
4. | Mauro Pietribiasi, Jacek Waniewski, John K. Leypoldt, Emre Avci, Mathematical modelling of bicarbonate supplementation and acid-base chemistry in kidney failure patients on hemodialysis, 2023, 18, 1932-6203, e0282104, 10.1371/journal.pone.0282104 | |
5. | Ratchakit Phetrittikun, Kerdkiat Suvirat, Kanakorn Horsiritham, Thammasin Ingviya, Sitthichok Chaichulee, Prediction of Acid-Base and Potassium Imbalances in Intensive Care Patients Using Machine Learning Techniques, 2023, 13, 2075-4418, 1171, 10.3390/diagnostics13061171 | |
6. | Vaibhav Maheshwari, Nadja Grobe, Xin Wang, Amrish Patel, Alhaji Cherif, Xia Tao, Joshua Chao, Alexander Heide, Dejan Nikolic, Jiaming Dong, Peter Kotanko, Allo-Hemodialysis, a Novel Dialytic Treatment Option for Patients with Kidney Failure: Outcomes of Mathematical Modelling, Prototyping, and Ex Vivo Testing, 2024, 16, 2072-6651, 292, 10.3390/toxins16070292 | |
7. | Giovanni Aloisi, What the future ocean has in common with an asthma attack, 2024, 11, 2053-0196, 329, 10.1177/20530196231204340 |
Bicarbonate buffer kinetic system | ||||
Description | Symbols | Values (range) | Units | Refs. |
Parameters | ||||
Hydration reaction rate | KH+,HCO−3 | 3.437(1.72,6.87)×1010 | L/mol/s | calculated |
Dehydration reaction rate | KCO2 | 2.736(1.37,5.46)×104 | s−1 | [23] |
Production of hydrogen ion | PH+ | 1.2(0.6,2.4)×10−6 | mol/L/s | [23] |
Bicarbonate Supplementation/Therapy | PHCO−3 | 0(−1.2,1.2×10−6) | mol/L/s | assumed, [22,23] |
Production of carbon dioxide | PCO2 | 3(1.5,6)×10−6 | mol/L/s | [22,23] |
Acid secretion rate | ϕCO2 | 7.09(3.55,14.2)×10−3 | s−1 | calculated |
Renal filtration rate | DHCO−3 | 3.5461(1.77,7.09)×10−4 | s−1 | [22] |
Ventilation rate | DCO2 | 2.5(1.25,5)×10−2 | L−1 | [22,23] |
Removal of H+ | γH+ | 30.151(15.08,60.30) | s−1 | calculated |
Initial conditions | ||||
Hydrogen ion concentration (H+) | Y0H+ | 3.98×10⁻⁸ | mol/L | [22] |
Bicarbonate ion concentration (HCO−3) | Y0HCO−3 | 2.4×10⁻² | mol/L | [22] |
Carbon dioxide concentration (CO2) | Y0CO2 | 1.2×10⁻³ | mol/L | [22] |
Minute ventilation | V0 | 0.10 | L/s | [24] |
PRCC | ||||||||
Parameters | HCO−3 | CO2 | H+ | pH | HCO−3 | CO2 | H+ | pH |
Healthy | Complete Renal Insufficiency | |||||||
PH | 0.3199 | 0.5679 | 0.4186 | −0.4186 | −0.4326 | 0.3910 | 0.7628 | −0.7628 |
γH | −0.4630 | −0.6930 | −0.5311 | 0.5311 | 0.6998 | −0.6543 | −0.9292 | 0.9292 |
KHHCO3 | 0.5190 | 0.7245 | −0.8273 | 0.8273 | −0.6825 | 0.6990 | −0.6320 | 0.6320 |
KCO2 | −0.4762 | −0.7002 | 0.8358 | −0.8358 | 0.6945 | −0.6702 | 0.6360 | −0.6360 |
PHCO3 | 0.5935 | 0.3460 | −0.3820 | 0.3820 | 0.8562 | 0.6607 | −0.6768 | 0.6768 |
DHCO3 | −0.7407 | −0.3999 | 0.5633 | −0.5633 | – | – | – | – |
ϕCO2 | 0.8909 | 0.6333 | −0.7601 | 0.7601 | – | – | – | – |
PCO2 | 0.9157 | 0.9161 | 0.1127∗∗ | −0.1127∗∗ | 0.9030 | 0.9533 | 0.7415 | −0.7415 |
DCO2 | −0.7728 | −0.8297 | −0.2714 | 0.2715 | −0.6515 | −0.8345 | −0.6390 | 0.6390 |
dRTA or RTA Ⅰ | pRTA or RTA Ⅱ | |||||||
PH | −0.2916 | 0.3864 | 0.7675 | −0.7675 | 0.3086 | 0.5811 | 0.3373 | −0.3373 |
γH | 0.6376 | −0.7442 | −0.9518 | 0.9518 | −0.4972 | −0.6316 | −0.1611 | 0.1611 |
KHHCO3 | −0.6260 | 0.7546 | −0.6009 | 0.6009 | 0.4013 | 0.5949 | −0.8707 | 0.8707 |
KCO2 | 0.6572 | −0.7288 | 0.5992 | −0.5992 | −0.4566 | −0.6256 | 0.8828 | −0.8828 |
PHCO3 | 0.8546 | 0.7110 | −0.5625 | 0.5625 | 0.5889 | 0.2830 | −0.4806 | 0.4806 |
DHCO3 | −0.7470 | −0.5817 | 0.4915 | −0.4915 | – | – | – | – |
ϕCO2 | – | – | – | – | 0.8886 | 0.4728 | −0.8224 | 0.8224 |
PCO2 | 0.9130 | 0.9528 | 0.8516 | −0.8516 | 0.9143 | 0.9196 | −0.1126∗ | 0.1126∗ |
DCO2 | −0.5897 | −0.7536 | −0.5804 | 0.5804 | −0.7729 | −0.8902 | −0.4156 | 0.4156 |
Bicarbonate buffer kinetic system | ||||
Description | Symbols | Values (range) | Units | Refs. |
Parameters | ||||
Hydration reaction rate | KH+,HCO−3 | 3.437(1.72,6.87)×1010 | L/mol/s | calculated |
Dehydration reaction rate | KCO2 | 2.736(1.37,5.46)×104 | s−1 | [23] |
Production of hydrogen ion | PH+ | 1.2(0.6,2.4)×10−6 | mol/L/s | [23] |
Bicarbonate Supplementation/Therapy | PHCO−3 | 0(−1.2,1.2×10−6) | mol/L/s | assumed, [22,23] |
Production of carbon dioxide | PCO2 | 3(1.5,6)×10−6 | mol/L/s | [22,23] |
Acid secretion rate | ϕCO2 | 7.09(3.55,14.2)×10−3 | s−1 | calculated |
Renal filtration rate | DHCO−3 | 3.5461(1.77,7.09)×10−4 | s−1 | [22] |
Ventilation rate | DCO2 | 2.5(1.25,5)×10−2 | L−1 | [22,23] |
Removal of H+ | γH+ | 30.151(15.08,60.30) | s−1 | calculated |
Initial conditions | ||||
Hydrogen ion concentration (H+) | Y0H+ | 3.98×10⁻⁸ | mol/L | [22] |
Bicarbonate ion concentration (HCO−3) | Y0HCO−3 | 2.4×10⁻² | mol/L | [22] |
Carbon dioxide concentration (CO2) | Y0CO2 | 1.2×10⁻³ | mol/L | [22] |
Minute ventilation | V0 | 0.10 | L/s | [24] |
Secondary Compensatory Responses | |||||
Types | y | Intercept (b) | Slope (m) | x | Refs. |
Metabolic Disorders | |||||
Acidosis | pCO2 | 10.6494 | 1.2152 | HCO−3 | [41,42]⋆ |
Alkalosis | pCO2 | 20 | 0.7 | HCO−3 | [45,46] |
Respiratory Disorders | |||||
Acidosis (chronic) | HCO−3 | 4.7364 | 0.4760 | pCO2 | [43,44]⋆⋆ |
Alkalosis (chronic) | HCO−3 | 4.0 | 0.5 | pCO2 | [47] |
PRCC | ||||||||
Parameters | HCO−3 | CO2 | H+ | pH | HCO−3 | CO2 | H+ | pH |
Healthy | Complete Renal Insufficiency | |||||||
PH | 0.3199 | 0.5679 | 0.4186 | −0.4186 | −0.4326 | 0.3910 | 0.7628 | −0.7628 |
γH | −0.4630 | −0.6930 | −0.5311 | 0.5311 | 0.6998 | −0.6543 | −0.9292 | 0.9292 |
KHHCO3 | 0.5190 | 0.7245 | −0.8273 | 0.8273 | −0.6825 | 0.6990 | −0.6320 | 0.6320 |
KCO2 | −0.4762 | −0.7002 | 0.8358 | −0.8358 | 0.6945 | −0.6702 | 0.6360 | −0.6360 |
PHCO3 | 0.5935 | 0.3460 | −0.3820 | 0.3820 | 0.8562 | 0.6607 | −0.6768 | 0.6768 |
DHCO3 | −0.7407 | −0.3999 | 0.5633 | −0.5633 | – | – | – | – |
ϕCO2 | 0.8909 | 0.6333 | −0.7601 | 0.7601 | – | – | – | – |
PCO2 | 0.9157 | 0.9161 | 0.1127∗∗ | −0.1127∗∗ | 0.9030 | 0.9533 | 0.7415 | −0.7415 |
DCO2 | −0.7728 | −0.8297 | −0.2714 | 0.2715 | −0.6515 | −0.8345 | −0.6390 | 0.6390 |
dRTA or RTA Ⅰ | pRTA or RTA Ⅱ | |||||||
PH | −0.2916 | 0.3864 | 0.7675 | −0.7675 | 0.3086 | 0.5811 | 0.3373 | −0.3373 |
γH | 0.6376 | −0.7442 | −0.9518 | 0.9518 | −0.4972 | −0.6316 | −0.1611 | 0.1611 |
KHHCO3 | −0.6260 | 0.7546 | −0.6009 | 0.6009 | 0.4013 | 0.5949 | −0.8707 | 0.8707 |
KCO2 | 0.6572 | −0.7288 | 0.5992 | −0.5992 | −0.4566 | −0.6256 | 0.8828 | −0.8828 |
PHCO3 | 0.8546 | 0.7110 | −0.5625 | 0.5625 | 0.5889 | 0.2830 | −0.4806 | 0.4806 |
DHCO3 | −0.7470 | −0.5817 | 0.4915 | −0.4915 | – | – | – | – |
ϕCO2 | – | – | – | – | 0.8886 | 0.4728 | −0.8224 | 0.8224 |
PCO2 | 0.9130 | 0.9528 | 0.8516 | −0.8516 | 0.9143 | 0.9196 | −0.1126∗ | 0.1126∗ |
DCO2 | −0.5897 | −0.7536 | −0.5804 | 0.5804 | −0.7729 | −0.8902 | −0.4156 | 0.4156 |