Loading [Contrib]/a11y/accessibility-menu.js
Research article Special Issues

A novel clustering algorithm for time-series data based on precise correlation coefficient matching in the IoT

  • Received: 24 May 2019 Accepted: 14 July 2019 Published: 19 July 2019
  • In smart environments based on the Internet of Things (IoT), almost all of the object information that is collected by various sensors is time series data, which records the behavior of the objects. Analyzing the correlation between different time series data, other than those in the same time series, is more helpful to discovering their behavioral relations. This has become one of the important current issues in the IoT. To analyze the correlation, a clustering algorithm named the CPCCM (clustering algorithm based on precise correlation coefficient matching) is presented. First, each initial sequence is split into a set of subsequences by adopting a preset sliding window. Then, the correlation coefficients between any pair of subsequence sets from two sequences are resolved. Those pairs that pass some preset Pearson correlation coefficient threshold are clustered. In the CPCCM, a cross-traversal strategy is introduced to improve the search efficiency. The cross-traversal strategy alternatively searches the subsequences in two subsequence sets. To improve the clustering efficiency, in each initial sequence, adjacent subsequences are merged into longer subsequences and replaced by it if they appear in the same subsequence set. Finally, by analyzing practical electric power consumption data, the CPCCM is shown to be promising and able to be applied in similar scenarios. By comparison with the agglomerative hierarchical clustering algorithm, the major contributions of this work is that the clustering quality is improved by using the strategy of precise matching and cross-traversal, and complexity of the algorithm is reduced by merging adjacent subsequences. Therefore, CPCCM can be applied to analyze behavior between different objects in smart environments.

    Citation: Haibo Li, Juncheng Tong. A novel clustering algorithm for time-series data based on precise correlation coefficient matching in the IoT[J]. Mathematical Biosciences and Engineering, 2019, 16(6): 6654-6671. doi: 10.3934/mbe.2019331

    Related Papers:

    [1] George L. Mendz, Nadeem O. Kaakoush, Julie A. Quinlivan . New techniques to characterise the vaginal microbiome in pregnancy. AIMS Microbiology, 2016, 2(1): 55-68. doi: 10.3934/microbiol.2016.1.55
    [2] Oluwafolajimi Adesanya, Tolulope Oduselu, Oluwawapelumi Akin-Ajani, Olubusuyi M. Adewumi, Olusegun G. Ademowo . An exegesis of bacteriophage therapy: An emerging player in the fight against anti-microbial resistance. AIMS Microbiology, 2020, 6(3): 204-230. doi: 10.3934/microbiol.2020014
    [3] Makayla Schissel, Rebecca Best, Shelby Liesemeyer, Yuan-De Tan, Darby J. Carlson, Julie J. Shaffer, Nagavardhini Avuthu, Chittibabu Guda, Kimberly A. Carlson . Effect of Nora virus infection on native gut bacterial communities of Drosophila melanogaster. AIMS Microbiology, 2021, 7(2): 216-237. doi: 10.3934/microbiol.2021014
    [4] Stephen T. Abedon . Active bacteriophage biocontrol and therapy on sub-millimeter scales towards removal of unwanted bacteria from foods and microbiomes. AIMS Microbiology, 2017, 3(3): 649-688. doi: 10.3934/microbiol.2017.3.649
    [5] Alaa Fathalla, Amal Abd el-mageed . Salt tolerance enhancement Of wheat (Triticum Asativium L) genotypes by selected plant growth promoting bacteria. AIMS Microbiology, 2020, 6(3): 250-271. doi: 10.3934/microbiol.2020016
    [6] Stephen T. Abedon . Phage “delay” towards enhancing bacterial escape from biofilms: a more comprehensive way of viewing resistance to bacteriophages. AIMS Microbiology, 2017, 3(2): 186-226. doi: 10.3934/microbiol.2017.2.186
    [7] McKenna J. Cruikshank, Justine M. Pitzer, Kimia Ameri, Caleb V. Rother, Kathryn Cooper, Austin S. Nuxoll . Characterization of Staphylococcus lugdunensis biofilms through ethyl methanesulfonate mutagenesis. AIMS Microbiology, 2024, 10(4): 880-893. doi: 10.3934/microbiol.2024038
    [8] Bahram Nikmanesh, Kazem Ahmadikia, Muhammad Ibrahim Getso, Sanaz Aghaei Gharehbolagh, Shima Aboutalebian, Hossein Mirhendi, Shahram Mahmoudi . Candida africana and Candida dubliniensis as causes of pediatric candiduria: A study using HWP1 gene size polymorphism. AIMS Microbiology, 2020, 6(3): 272-279. doi: 10.3934/microbiol.2020017
    [9] Rania Abozahra, Amal Gaballah, Sarah M. Abdelhamid . Prevalence of the colistin resistance gene MCR-1 in colistin-resistant Klebsiella pneumoniae in Egypt. AIMS Microbiology, 2023, 9(2): 177-194. doi: 10.3934/microbiol.2023011
    [10] Amira H. El-Ashry, Shimaa R. Hendawy, Noha Mostafa Mahmoud . Prevalence of pks genotoxin among hospital-acquired Klebsiella pneumoniae. AIMS Microbiology, 2022, 8(1): 73-82. doi: 10.3934/microbiol.2022007
  • In smart environments based on the Internet of Things (IoT), almost all of the object information that is collected by various sensors is time series data, which records the behavior of the objects. Analyzing the correlation between different time series data, other than those in the same time series, is more helpful to discovering their behavioral relations. This has become one of the important current issues in the IoT. To analyze the correlation, a clustering algorithm named the CPCCM (clustering algorithm based on precise correlation coefficient matching) is presented. First, each initial sequence is split into a set of subsequences by adopting a preset sliding window. Then, the correlation coefficients between any pair of subsequence sets from two sequences are resolved. Those pairs that pass some preset Pearson correlation coefficient threshold are clustered. In the CPCCM, a cross-traversal strategy is introduced to improve the search efficiency. The cross-traversal strategy alternatively searches the subsequences in two subsequence sets. To improve the clustering efficiency, in each initial sequence, adjacent subsequences are merged into longer subsequences and replaced by it if they appear in the same subsequence set. Finally, by analyzing practical electric power consumption data, the CPCCM is shown to be promising and able to be applied in similar scenarios. By comparison with the agglomerative hierarchical clustering algorithm, the major contributions of this work is that the clustering quality is improved by using the strategy of precise matching and cross-traversal, and complexity of the algorithm is reduced by merging adjacent subsequences. Therefore, CPCCM can be applied to analyze behavior between different objects in smart environments.


    Most females experience vaginitis at least once in their lifetime [1]. As one of the most commonly reported vaginal infections, the condition accounts for more than 10% of cases in health care clinics [2]. Vaginitis generally refers to inflammation of the vaginal wall, with several infectious and noninfectious triggers responsible for this inflammation. Bacterial vaginosis (BV), vulvovaginal candidiasis (VVC) and trichomonal vaginitis are the most common vaginal infections [3]. Lactobacillus spp. constitute over 95% of vaginal bacteria and are the predominant microorganisms [4]. They are believed to protect the vagina against infection, in part by maintaining an acidic pH and ensuring a hydrogen peroxide environment in the vaginal atmosphere [5]. BV is the most common cause of abnormal vaginal discharge, is mediated by disturbances in vaginal microbiota and may be temporary or permanent [6]. Also, Candida species, in particular Candida albicans, are part of the normal vaginal microbiota; however, its presence is often asymptomatic. Thus, a VVC diagnosis requires the comprehensive laboratory investigation of all symptoms [7].

    Vaginitis is very common, especially in developing countries such as Egypt [8]. Also, vaginal infection during pregnancy is associated with a high incidence of preterm labor and neonatal ICU admission [9].

    In this study, we investigated the prevalence of causative vaginitis microorganisms using clinical methods, conventional laboratory methods and molecular applications, in both pregnant and nonpregnant females. Also, the study assessed the main risk factors associated with vaginitis.

    The study was conducted between September 2019 and March 2020. A total of 516 vaginal swabs were collected from female patients admitted to El-Shateby University Hospital. All patients were experiencing vaginitis with one or more of the following symptoms: change in color and odor of vaginal discharge, pain during intercourse, vaginal itching and inflammation and dysuria.

    A full medical history was taken from each patient; this included the evaluation of several risk factors such as diabetes mellitus (DM), hypertension, anemia, and frequency of intercourse.

    Besides physical examination, direct examinations included vaginal pH tests using pH paper and the whiff test to detect BV; a fish odor after treating samples with 10% potassium hydroxide (KOH) indicates positive results [10].

    Three swab/discharge samples were collected from patients and immediately transported to the laboratory. On a slide, vaginal discharge was examined for Candida by mixing samples with 10% KOH and examining under a microscope, and candidiasis was diagnosed by hyphae and budding yeast cells [11]. On another slide, vaginal discharge was mixed with saline and used to detect Trichomonas vaginalis, a motile flagellated pear-shaped organism. Also, this film was used to evaluate the presence of clue cells, which are vaginal epithelial cells with adherent coccobacilli. An increased number of round parabasal cells was considered a sign of atrophic vaginitis [12],[13]. A third slide was used for Gram-stain; prepared mounts were examined and quantified for Lactobacillus, Bacteroides/Gardnerella, and Mobiluncus for calculation of Nugent's score [14]. A rapid diagnostic test was conducted using Liofilchem TM S. l R strips to determine Gardnerella spp. in samples.

    BV was diagnosed using the following two methods: (a) Amsel's criteria established a positive BV diagnosis if three of the following four clinical signs were present: 1) thin, gray and homogenous discharge; 2) a vaginal secretion of pH > 4.5; 3) a positive whiff test; and 4) the presence of clue cells on wet mounts [15],[16]. (b) Nugent's scores [17] were generated using a semiquantitative evaluation method to estimate the relative prevalence of Lactobacilli, G. vaginalis/Bacteroides, and Mobiluncus in Gram-stained vaginal wet mounts: 0–3 = normal, 4–6 = intermediate, and 7–10 = BV.

    Samples showing no pathogenic growth upon culturing, a negative microscopy result and a G. vaginalis rapid test, were investigated using real-time PCR. Immediately after collection, a vaginal swab was added to a tube containing 500 µL sterile-buffered saline and mixed thoroughly. If real time PCR was needed, DNA was extracted using a DNA extraction kit (PREP-GS) (www.dna-technology.ru). The Femoflor Screen real-time PCR detection kit was used to determine the presence and relative abundance of vaginal normal flora, opportunistic flora and pathogens using multiplex quantitative real-time PCR. The kit is designed to detect and quantitively determine a wide range of etiologically significant opportunistic aerobic organisms and anaerobic organisms; also, it can detect Mycoplasma spp. and Candida spp. Moreover, it can detect genital pathogens such as Chlamydia trachomatis, Neisseria gonorrhoeae, T. vaginalis, and viral pathogens (Cytomegalovirus, herpes simplex viruses 1 and 2). The test was prepared according to the manufacturer's guidelines. Positive and negative controls were supplied with the kit. The negative control was subjected to the whole DNA extraction procedure. Both controls were added to each strip in separate tubes.

    Data were analyzed using SPSS (ver. 20, Chicago, IL, USA). Pearson's chi square test was used for association between categorical variables and expressed by p-value; the level of significance was 0.05, below which the results were considered to be statistically significant.

    Approval of this study was obtained from the Ethical Committee at the Medical Research Institute, Alexandria University, approval number E\C. S/N. T15/2019. An informed consent was obtained from all participants before sampling. The study was conducted in accordance with the standards set forth in the Declaration of Helsinki principles of 1975, as revised in 2013 (http://ethics.iit.edu/ecodes/node/3931).

    In this study, 310 (60.1%) females were pregnant and 206 (39.9%) were not. The majority were in their 20s and 30s (mean age: 29.92 ± 8 years). Vaginal discharge was the most common symptom (81.7%), followed by itching (58.1%) and dysuria (14.7%), whereas 12.4% complained of painful sexual intercourse. Itching was the most common symptom among nonpregnant females, whereas vaginal discharge was the common symptom among pregnant females. We observed no significant differences in symptom distribution between pregnant and nonpregnant females, except for painful sexual intercourse, which was significantly higher in nonpregnant females (Table 1).

    Among the reported risk factors (Table 1), diabetes mellitus (DM) was the most common (18.2%), followed by anemia (15.3%). Hypertension was significantly higher among pregnant females. However, in 47.5% of females, no other risk factors were identified (Table 1).

    Table 1.  Distribution of age, risk factors, and symptoms among the study groups.
    Pregnant Nonpregnant Total
    Total no. 310 (60.1%) 206 (39.9%) 516 (100%)
    Mean age 28.71 ± 7.23 31.75 ± 8.79 29.92 ± 8
    Signs and symptoms
    Discharge 250 (80.6%) 172 (83.4%) 422 (81.7%)
    Itching 177 (57.1%) 123 (59.7%) 300 (58.1%)
    Dysuria 42 (13.5%) 34 (16.5%) 76 (14.7%)
    Painful sexual intercourse 31 (10%)* 33 (16%)* 64 (12.4%)
    Inflammation & redness 18 (5.8%) 12 (5.8%) 30 (5.8%)
    Risk factors Reported in 159 (51.3%) Reported in 112 (54.4%) Reported in 271 (52.5%)
    Diabetes mellitus 52 (16.8%) 42 (20.4) 94 (18.2%)
    Hypertension 13 (4.2%)** 5 (2.4%)** 18 (3.4%)
    Frequent intercourse 44 (14.2%) 25 (12.1%) 69 (13.4%)
    Anemia 44 (14.2%) 35 (17%) 79 (15.3%)

    *Note: For χ2 (chi-squared) test: * significant at p ≤ 0.05; ** highly significant at p ≤ 0.01.

     | Show Table
    DownLoad: CSV

    All Amsel criteria were identified in only 31.4% of females. The most reported single criteria were homogenous discharge (67.4%), positive whiff test (54.7%) and the presence of clue cells (50.2%). Clue cell numbers were statistically higher in the nonpregnant group (60.7%). The presence of all three criteria together was significantly higher in nonpregnant than in pregnant females.

    In terms of Nugent's scores, the majority of cases (44.2%) scored 7–10, which indicated BV, whereas 28.7% scored 4–6 (intermediate), and 27.1% scored 1–3 (normal or negative for BV) (Table 2).

    Table 2.  Comparison of Amsel's criteria and the calculated Nugent's score among pregnant and non-pregnant groups.
    Pregnant Nonpregnant Total
    Amsel's criteria
    Clue cells 134 (43.2%)** 125 (60.7%)** 259 (50.2%)**
    Whiff test 161 (51.9%) 121 (58.7%) 282 (54.7%)
    Homogenous discharge 201 (64.8%) 147 (71.4%) 348 (67.4%)
    All criteria present 74 (23.9%)** 88 (42.7%)** 162 (31.4%)**

    Nugent Score
    Normal (1–3) 75 (24.2%) 65 (31.6%) 140 (27.1%)
    Intermediate (4–6) 97 (31.3%) 51 (24.8%) 148 (28.7%)
    Bacterial vaginosis (7–10) 138 (44.5%) 90 (43.7%) 228 (44.2%)

    *Note: For χ2 (chi-squared) test: * significant at p ≤ 0.05; ** highly significant at p ≤ 0.01.

     | Show Table
    DownLoad: CSV

    We identified a week association between Amsel's criteria and Nugent's scores for BV (p < 0.01). We observed that 211 (40.9%) females were negative for Amsel's criteria and Nugent's score when compared with 85 (16.5%) positive females. However, 77 females (14.9%) were positive for Amsel's criteria while Nugent's scores were negative. However, 143 (27.7%) females were negative for Amsel's criteria while Nugent's scores were positive.

    Using Gram-stain, culturing, Amsel's criteria, Nugent's scores and G. vaginalis rapid tests, BV was diagnosed in 59.1% (305/516) of females. Using rapid testing, Gardnerella spp. represented 65.9% (201/305) of BV cases, with a total prevalence of 39% among females. Candida was identified in 50.2% of females (259/516), with GBS in 5.6% and T. vaginalis in two females (Table 3).

    Table 3.  Causative agent of vaginitis detected by conventional methods and real time PCR among pregnant and nonpregnant women.
    Diagnosis Pregnant Nonpregnant Total
    Identified by conventional methods
    Total bacterial vaginosis 211 (68.1%) * 94 (45.6%)* 305 (59.1%)
    Gardnerella vaginalis 139 (44.8) ** 62 (30.1) ** 201 (39%)
    Candida spp. 141 (45.5%) ** 118 (57.3%) ** 259 (50.2%)
    GBS (Group B Streptococci) 17 (5.5%) 12 (5.8%) 29 (5.6%)
    Trichomonas vaginalis 1 (0.3%) 1 (0.5%) 2 (0.4%)

    Identified by PCR (45 cases)
    Lactobacilli 10 (3.2%) 13 (6.3%) 23 (4.5%)
    Lactobacilli, G. vaginalis / Prevotella sp. 3 (0.96%) 3 (1.5%) 6 (1.2%)
    Gardnerella vaginalis / Prevotella sp. 4 (1.3%) 3 (1.5%) 7 (1.4%)
    Ureaplasma 1 (0.32%) 2 (0.97%) 3 (0.58%)
    Mycoplasma genitalium 0 1 (0.49%) 1 (0.19%)
    Mycoplasma hominis 1 (0.32%) 1 (0.49%) 2 (0.38%)
    Trichomonas vaginalis 2 (0.65%) 1 (0.49%) 3 (0.58%)

    *Note: For χ2 (chi-squared) test: * significant at p ≤ 0.05; ** highly significant at p ≤ 0.01.

     | Show Table
    DownLoad: CSV

    We observed that 24% of females (124/516) had mixed infections. Mixed Candida species infections with BV were identified in 108 cases (21%). Also, GBS coinfection with Candida species was identified in 10 cases (1.93%), and that with T. vaginalis was identified in two cases. Colonization with both GBS and BV was identified in four cases.

    The Candida and BV isolation rate was significantly higher in nonpregnant females, whereas Gardnerella detection rates were statistically higher in pregnant females. In terms of other vaginitis causes, GBS and T. vaginalis were detected in 17 (5.5%) and one (0.3%) pregnant female(s), respectively, when compared with 12 (5.8%) and one (0.5%) nonpregnant female(s), respectively (Table 3).

    Forty-five cases uncharacterized by conventional methods were identified using real-time PCR. G. vaginalis Prevotella were detected in 13 cases, with or without Lactobacilli. Ureaplasma, Mycoplasma genitalium and Mycoplasma hominis were detected in three (0.58%), one (0.19%) and two (0.38%) cases, respectively. Three more T. vaginalis cases were also identified via real-time PCR. Thus, the overall prevalence of T. vaginalis using conventional methods and real time PCR was 5/516 (0.98%). Neisseria, Chlamydia and viral pathogens were not detected.

    We identified 259 Candida isolates at the species level using Candida chromogenic agar (Candida albicans, Candida glabrata, Candida tropicalis and Candida kruesi. Two species were identified using VITEK 2 technology (Candida dubliniensis and Candida guilliermondii). C. albicans was a major causative agent of vaginal candidiasis (194/259, 74.9%). Non-C. albicans isolates were also detected in 65/259 (25.1%) cases: C. tropicalis was the most common non-C. albicans type (31/259, 11.9%), followed by C. glabrata (21/259, 8.1%) and C. kruesi (11/259, 4.2%).

    In terms of antifungal agent sensitivity, all Candida species were sensitive to ketoconazole, miconazole, micafungin, nystatin, clotrimazole, and caspofungin. For fluconazole, all C. kruesi isolates were intrinsically resistant, whereas six (3.1%) C. albicans and six (19.4%) C. tropicalis isolates were resistant. Also, two C. albicans (1.14%) and one C. tropicalis (3.2%) isolate were resistant to voriconazole. Two C. albicans isolates were resistant to amphotericin B.

    Vaginitis is defined as vaginal inflammation and is typically characterized by several signs and symptoms, including vaginal discharge, vulvar itching, vaginal erythema and dysuria [3].

    The majority of females in this study were in their 20s and 30s. Pregnant females were more common (60%). Several other studies showed similar age group prevalence. Mahakal et al. [21] found that among 272 females included in their study, the commonest age-group with vaginal discharge was 20–40 years (83%), among whom only 21% of females were pregnant. Similar results were reported in an Indonesian descriptive study [22] comprising 492 women, where the average age was 30.9 ± 0.27 years.

    Vaginal discharge was the most common symptom (81.7%) presented, followed by itching (58.1%). This was contrary to Mahakal et al. [21], who reported that 83% of their patients presented with pruritus, and 46% and 44% of them complained of dysuria and dyspareunia, respectively.

    We observed no significant differences in symptom distribution between pregnant and nonpregnant females. However, painful sexual intercourse was significantly higher in the nonpregnant group and was putatively explained by less frequent sexual intercourse when compared with pregnant females.

    In our study, no risk factors were identified in 47.6%. Among the reported risk factors, DM was the most common (18.2%), followed by frequent sexual intercourse (13.4%). Diabetes mellitus predisposes to Candidiasis, as well as bacterial infections. Vulvovaginal candidiasis (VVC) has been proposed by many investigators in diabetics to be more frequent [23],[24]. Furthermore, chronic recurring VVC may be a marker of diabetes [25].

    European guidelines recommend a BV diagnosis may be based on clinical symptoms and signs when supported by additional experimental findings. Thus, Amsel's clinical criteria, Nugent's scores or culture-based techniques can be used [26].

    We diagnosed BV in 305/516 (59.1%) females using either Nugent's scores or Amsel's criteria. A weak agreement was identified between these indices for BV. Several studies have reported that Amsel's criteria are as good as Nugent's scores for diagnosing BV; both are simple, easy, cost effective and reliable methods [27]. However, by applying molecular techniques, we also diagnosed a further 13 additional BV cases. As both Nugent's scores and Amsel's criteria have inherent limitations, DNA-based assays targeting BV are reproducible and may be used to diagnose difficult cases [28]. A lower BV prevalence was reported in an Ethiopian study, in which BV was diagnosed using Nugent's score in 20.1% of the patients [29]. The prevalence in other African countries was reported to be also lower; in a meta-analysis, the prevalence of BV in sub-Saharan Africa was 42.1% [30]. The higher prevalence in our study could be explained by the usage of more than one technique for diagnosis of BV. Also, there are differences in the prevalent microbial populations between countries [31].

    In this study, 50.2% of females were diagnosed with VVC. Candida infections were significantly higher in nonpregnant females and may have been exacerbated by pregnancy, high oral estrogen contraception use, antibiotics and health conditions such as DM, which was the highest reported predisposing factor among pregnant and nonpregnant females in our study. VVC also appears to be more frequent in diabetics [32],[33]. Uncommon, non-C. albicans strains were also identified using VITEK 2 technology: C. dubliniensis (1/65, 1.53%) and C. guilliermondii (1/65, 1.53%).

    In terms of Candida distribution, our data agreed with Hassan et al. (2017) [27]. We identified six Candida species: C. albicans was the predominant strain (62.9%), followed by Candida lusitaniae (13.7%), C. krusei (10.7%), C. glabrata (6.3%), C. tropicalis, and Candida parapsilosis [34]. Previously, in an Argentinian study, 55 Candida isolates or other yeasts were identified in patients with VVC; C. albicans was the predominant species (85%), followed by C. dubliniensis and C. glabrata [35].

    Identifying yeast at the species level is vital for choosing appropriate antifungal treatments. C. albicans is the main pathogen seen in VVC; however, other Candida species, as presented in our study, may not share the same susceptibility profile with C. albicans. This could lead to recurrent VVC, which is distinguished from persistent infection by symptom-free intervals [36]. The reported Candida resistance to antifungal drugs could be attributed to empirical long-term treatment without identifying species and susceptibility.

    We identified T. vaginalis in five females (0.96%), two using wet mounts and three using real-time PCR. Similar findings were identified in a cross-sectional study [37] in reproductive-age females. Using microscopy, these authors reported T. vaginalis as the least frequent cause of vaginitis, with a detection rate of < 1.0% in their cohort. This low prevalence contrasted with a Vietnamese study [38] where 249 symptomatic and 534 asymptomatic females had an overall trichomoniasis prevalence of 6.6% by microscopy.

    We identified GBS in 5.6% of females; however, there was no significant difference in the prevalence between pregnant and nonpregnant females. GBS are part of the typical recto-vaginal flora and are transiently identified in asymptomatic females [39][42]. In another Egyptian study, a higher GBS prevalence (25.3%) was identified using vaginal swabs cultured on ISLAM'S media [43]. The sensitivity of the ISLAM media used may explain the difference in the prevalence.

    The detection of genital Mycoplasma in females is important and is augmented by the high rate of vertical transmission and associations with neonatal morbidity and mortality [44]. Mycoplasma culturing is costly and requires specialized media and expertise. Infectious agents may be detected in 8 h using nucleic acid amplification techniques. In our study, we used multiplex real-time PCR to characterize vaginitis etiology in females where no definitive causes were identified using conventional methods. Using real time PCR, three Ureaplasma species, M. genitalium (1) and M. hominis (2) were identified in 45 females.

    However, using culturing techniques, discrepant prevalence rates were reported in Australia [38]. Out of 175 cervical swabs cultured from Australian females, with and without cervicitis, 16% tested positive for M. hominis and 68% for Ureaplasma species [45]. This difference in prevalence may be explained by different sexual behaviors and restricted sexual activities in Egypt when compared with Western countries. Additionally, only 45/516 samples with no obvious cause for vaginitis were tested in our study.

    We detected no viral pathogens. This result may be explained by several factors: Only one sample per patient was tested, and viral loads below detection limits may have been missed. We used commercially available specimen collection swabs and transportation media, which may not have provided optimum conditions for viral nucleic acid recovery. Moreover, the majority of the females included in this study did not present with genital ulcers, potentially explaining the absence of vaginal viral infections.

    Alarmingly, we identified mixed vaginal infections in 24% of females, suggesting that nearly one in four may be diagnosed and treated for one causative pathogen, with the other(s) left undiagnosed, thereby prolonging patient suffering. The most commonly observed mixed infection was VVC with BV (21%). Although vaginal infections are extremely common, little information is available on mixed infection prevalence, especially VVC and BV. The co-incidence of microscopy-defined VVC and BV varies considerably and ranges from 3% to 27% [46],[47]. In spite of this high incidence, these infections remain poorly studied. Thus, improved diagnostic procedures are recommended to facilitate mixed infection diagnoses and provide appropriate and timely therapeutic options [48].

    BV is the most common cause of vaginitis. C. albicans is the most common fungal species causing VVC, with a low rate of antifungal resistance. Species identification and susceptibility testing for VVC patients is recommended, especially for recurrent cases. T. vaginalis may be underestimated using conventional diagnostic methods. Mixed vaginal infections remain underestimated in clinical practice. It is recommended that diagnostic methods be improved to capture potential mixed infection risks and bridge the therapeutic gap using combination therapy.


    [1] M. Weiser, R. Gold and J. S. Brown, The origins of ubiquitous computing research at PARC in the late 1980s, IBM Syst. J., 38 (1999), 693–696.
    [2] V. A. Memos, K. E. Psannis, Y. Ishibashi, et al., An efficient algorithm for media-based surveillance system (EAMSuS) in IoT smart city framework, Future Gener. Comp. Syst., 83 (2018), 619–628.
    [3] S. Tang, D. R. Shelden, C. M. Eastman, et al., A review of building information modeling (BIM) and the internet of things (IoT) devices integration: Present status and future trends, Automat. Const., 101 (2019), 127–139.
    [4] T. Baker, A. Taleb-Bendiab, M. Randles, et al., Understanding elasticity of cloud services compositions, In 2012 IEEE Fifth International Conference on Utility and Cloud Computing, Chicago(USA), IEEE, (2012), 231–232.
    [5] A. Jula, E. Sundararajan and Z. Othman, Cloud computing service composition: A systematic literature review, Expert Syst. Appl., 41 (2014), 3809–3824.
    [6] Q. Wu, G. Ding, Y. Xu, et al., Cognitive internet of things: a new paradigm beyond connection, IEEE Int. Things J., 1 (2014), 129–143.
    [7] C. Gomez, S. Chessa, A. Fleury, et al., Internet of Things for enabling smart environments: A technology-centric perspective, J. Ambient Int. Smart Environ., 11 (2019), 23–43.
    [8] L. Atzori, A. Iera and G. Morabito, The internet of things: A survey, Comput. Netw., 54 (2010), 2787–2805.
    [9] F. Chen, P. Deng, J. F. Wan, et al., Data Mining for the Internet of Things. Literature Review and Challenges, Int. J. Distrib. Sensor Netw., 11 (2015), P431047.
    [10] H. Li, Z. Zhang, X. Wang, et al., Electricity consumption behaviour analysis based on time sequence clustering, In 2018 International Conference on Computer Information Engineering and Bioinformatics, Guangzhou(China), IOP Publishing, (2018), 032011.
    [11] S. Pravilovic, M. Bilancia, A. Appice, et al., Using multiple time series analysis for geosensor data forecasting, Inf. Sci., 380 (2017), 31–52.
    [12] J. Liu, W. Li, J. Wu, et al., Visualizing the intercity correlation of PM2. 5 time series in the Beijing-Tianjin-Hebei region using ground-based air quality monitoring data, PloS One, 13 (2018), e0192614.
    [13] J. Soares, P. A. Makar, Y. Aklilu, et al., The use of hierarchical clustering for the design of optimized monitoring networks, Atmos. Chem. Phys., 18 (2018), 6543–6566.
    [14] A. Zaslavsky, C. Perera and D. Georgakopoulos, Sensing as a service and big data, In International Conference on Advances in Cloud Computing (ACC-2012), Bangalore(India), Eprint Arxiv, (2012), 21–29.
    [15] C. Chang and C. Li, Algebraic secret sharing using privacy homomorphisms for IoT-based healthcare systems, Math. Biosci. Eng., 16 (2019), 3367–3381.
    [16] Y. Ren, Y. Leng, Y Cheng, et al., Secure data storage based on blockchain and coding in edge computing, Math. Biosci. Eng., 16 (2019), 1874–1892.
    [17] C. Li and B. Palanisamy, Privacy in internet of things: From principles to technologies, IEEE Int. Things J., 6 (2019), 488–505.
    [18] A. P. Plageras, K. E. Psannis, C. Stergiou, et al., Efficient IoT-based sensor BIG Data collection–processing and analysis in smart buildings, Future Gener. Comp. Syst., 82 (2018), 349–357.
    [19] K. P. Kibiwott, Y. Zhao, J. Kogo, et al., Verifiable fully outsourced attribute-based signcryption system for IoT eHealth big data in cloud computing, Math. Biosci. Eng., 16 (2019), 3561–3594.
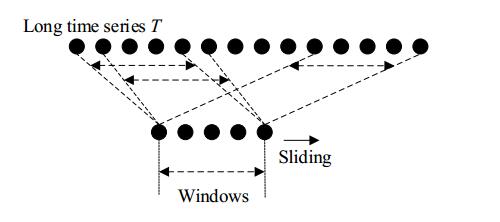
    [20] S. K. Jensen, T. B. Pedersen and C. Thomsen, Time series management systems: A survey, IEEE T. Knowledge Data Eng., 29 (2017), 2581–2600.
    [21] C. Stergiou, K. E. Psannis, A. P. Plageras, et al., Algorithms for efficient digital media transmission over IoT and cloud networking, J. Multimedia Inf. Syst., 5 (2018), 27–34.
    [22] K. E. Psannis, C. Stergiou and B. B. Gupta, Advanced media-based smart big data on intelligent cloud systems, IEEE T. Sustain. Comput., 4 (2018), 77–87.
    [23] W. Ejaz, M. Naeem, A. Shahid, et al., Efficient energy management for the internet of things in smart cities, IEEE Commun. Mag., 55 (2017), 84–91.
    [24] A. F. Mohammad and V. Korosh, Energy management-as-a-service over fog computing platform, IEEE Int. Things J., 3 (2015), 161–169.
    [25] F. Adenugba, S. Misra, R. Maskeliūnas, et al., Smart irrigation system for environmental sustainability in Africa: An Internet of Everything (IoE) approach, Math. Biosci. Eng., 16 (2019), 5490–5503.
    [26] M. Izal, D. Morató, E. Magaña, et al., Computation of traffic time series for large populations of IoT devices, Sensors, 19 (2019), 78.
    [27] Ş. Kolozali, D. Puschmann, M. Bermudez-Edo, et al., On the effect of adaptive and nonadaptive analysis of time-series sensory data, IEEE Int. Things J., 3 (2016), 1084–1098.
    [28] R. Salles, P. Mattos, A. M. D. Iorgulescu, et al., Evaluating temporal aggregation for predicting the sea surface temperature of the Atlantic Ocean. Ecol. Inform., 36 (2016), 94–105.
    [29] J. Roberts, M. Curran, S. Poynter, et al., Correlation confidence limits for unevenly sampled data, Comput. Geosci., 104 (2017), 120–124.
    [30] I. Ozken, D. Eroglu, S. F. Breitenbach, et al., Recurrence plot analysis of irregularly sampled data, Phys. Rev. E., 98 (2018), 052215.
    [31] H. Li, K. C. C. Chan, M. Liang, et al., Composition of resource-service chain for cloud manufacturing, IEEE T. Ind. Informat., 12 (2016), 211–219.
    [32] H. Li, M. Liang and T. Liang, Optimizing the composition of a resource service chain with inter-organizational collaboration, IEEE T. Ind. Informat., 13 (2017), 1152–1161.
    [33] H. Li and T. He, Selecting key feature sequence of resource services in industrial internet of things, IEEE Access, 6 (2018), 72152–72162.
    [34] L. Wen, L. Gao, Y. Dong, et al., A negative correlation ensemble transfer learning method for fault diagnosis based on convolutional neural network, Math. Biosci. Eng., 16 (2019), 3311–3330.
    [35] Z. Zhang, L. Liu, S. Zhang, et al., A service-based method for multiple sensor streams aggregation in fog computing, Wireless Commun. Mobile Comput., 1 (2018), 1–11.
    [36] M. Mehdizadeh, R. Ghazi and M. Ghayeni, Power system security assessment with high wind penetration using the farms models based on their correlation, IET Renew. Power Gener., 12 (2018), 893–900.
    [37] Z. Chen, Z. Xue, L. Zhang, et al., Analyzing the correlation and predictability of wind speed series based on mutual information, IEEE T. Electr. Electr. Eng., 13 (2018), 1829–1830.
    [38] J. Olauson and M. Bergkvist, Correlation between wind power generation in the European countries, Energy, 114 (2016), 663–670.
    [39] F. Wang, A novel coefficient for detecting and quantifying asymmetry of California electricity market based on asymmetric detrended cross-correlation analysis, Chaos Interdiscipl. J. Nonlinear Sci., 26 (2016), 063109.
    [40] T. Cui, F. Caravelli and C. Ududec, Correlations and clustering in wholesale electricity markets, Physica A., 492 (2018), 1507–1522.
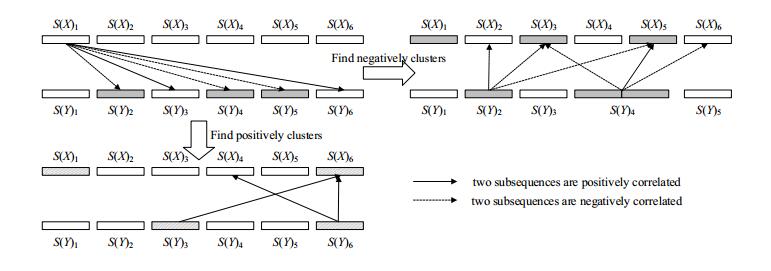
    [41] R. Lin, B Wu and Y Su, An adaptive weighted pearson similarity measurement method for load curve clustering, Energies, 11 (2018), 1–17.
    [42] A. Mueen, H. Hamooni and T. Estrada, Time series join on subsequence correlation, In 2014 IEEE International Conference on Data Mining, Shenzhen(China), IEEE Computer Society Press, (2014), 450–459.
    [43] Z. Ye, S. Mistry, A. Bouguettaya, et al., Long-term QoS-aware cloud service composition using multivariate time series analysis, IEEE T. Services Comput., 9 (2014), 382–393.
    [44] M. Disegna, P. D'Urso and F. Durante, Copula-based fuzzy clustering of spatial time series, Spat. Stat., 21 (2017), 209–225.
    [45] J. C. Dunn, Well-separated clusters and optimal fuzzy partitions, J. Cybernetics, 4 (1974), 95–104.
    [46] M. Halkidi, Y. Batistakis and M Vazirgiannis, On clustering validation techniques, J. Intell. Inf. Syst., 17 (2001), 107–145.
  • This article has been cited by:

    1. T.M. Tutchenko, T.F. Tatarchuk, L.О. Borysova, E.F. Chaikivska, Benefits and limitations of clinical assessment of abnormal vaginal discharge etiology, 2023, 2411-1295, 48, 10.18370/2309-4117.2023.68.48-56
    2. Sylwia M. Berus, Beata Młynarczyk-Bonikowska, Grażyna Przedpełska, Tomasz Szymborski, Agnieszka Kamińska, Surface-enhanced Raman spectroscopy analysis of menstrual cycle: From biochemical changes to diagnostics of vaginal infections, 2024, 409, 09254005, 135571, 10.1016/j.snb.2024.135571
    3. Nasser Mohamed Abd El-kareem, Ahmed Kamal Dyab, Nada Oudah Albalawi, Abdalla Abd El Samea, Mohamed Ahmed Ali Taha, Hajar AlQadeeb, Ahmed Gareh, Elham Adel Hiekal, Hind Alzaylaee, Ehab Kotb Elmahallawy, Microscopic and molecular detection of Trichomonas vaginalis in outpatients seeking medical care in Upper Egypt, 2024, 15, 1664-302X, 10.3389/fmicb.2024.1499270
    4. Yan Yang, Yue Qu, Bin Yan, Changzheng Wang, Shun Liu, The prevalence trends of Trichomonas vaginalis infection among women in Jingzhou, central of China, 2019–2023, 2025, 25, 1471-2334, 10.1186/s12879-025-10815-8
  • Reader Comments
  • © 2019 the Author(s), licensee AIMS Press. This is an open access article distributed under the terms of the Creative Commons Attribution License (http://creativecommons.org/licenses/by/4.0)
通讯作者: 陈斌, bchen63@163.com
  • 1. 

    沈阳化工大学材料科学与工程学院 沈阳 110142

  1. 本站搜索
  2. 百度学术搜索
  3. 万方数据库搜索
  4. CNKI搜索

Metrics

Article views(5056) PDF downloads(553) Cited by(9)

Other Articles By Authors

/

DownLoad:  Full-Size Img  PowerPoint
Return
Return

Catalog