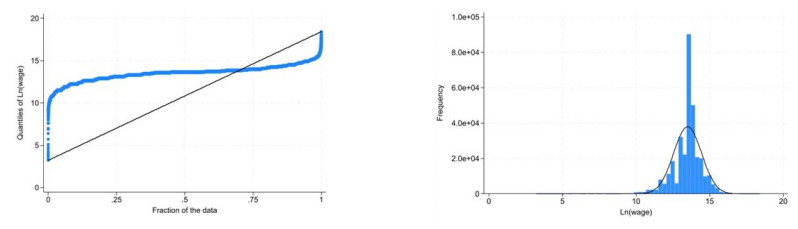
We investigated the returns to education by economic sector in Colombia, focusing on the relationship between educational levels (degree of highest educational level) and wages in different labor areas (economic sectors), as well as vulnerable populations such as women and migrants. Quantile and interquantile regressions were employed, correcting for selection bias through the inverse Mills ratio and using monthly data from Colombia's Great Integrated Household Survey (GEIH) for 2019, to explore how the effect of education varies at different points of the income distribution and between these points. Using quantile regression provided a more comprehensive view of this relationship than traditional statistical regression approaches. Traditional Mincerian socioeconomic variables such as gender, experience, hours worked, marital status, relationship with the head of the household, and social security affiliation, were controlled for. Results show that while there is a positive effect between educational level and income in all economic sectors studied, this relationship varies in magnitude and form along the wage distribution.
Citation: Jacobo Campo-Robledo, Cristian Castillo-Robayo, Julimar da silva Bichara. Quantile and interquantile regression models for returns to education by economic sector and vulnerable population in Colombia[J]. AIMS Mathematics, 2024, 9(12): 35091-35124. doi: 10.3934/math.20241669
We investigated the returns to education by economic sector in Colombia, focusing on the relationship between educational levels (degree of highest educational level) and wages in different labor areas (economic sectors), as well as vulnerable populations such as women and migrants. Quantile and interquantile regressions were employed, correcting for selection bias through the inverse Mills ratio and using monthly data from Colombia's Great Integrated Household Survey (GEIH) for 2019, to explore how the effect of education varies at different points of the income distribution and between these points. Using quantile regression provided a more comprehensive view of this relationship than traditional statistical regression approaches. Traditional Mincerian socioeconomic variables such as gender, experience, hours worked, marital status, relationship with the head of the household, and social security affiliation, were controlled for. Results show that while there is a positive effect between educational level and income in all economic sectors studied, this relationship varies in magnitude and form along the wage distribution.

| [1] | G. Becker, Human Capital: A Theoretical and Empirical Analysis, with Special Reference to Education, New York: Columbia University Press, 1964. |
| [2] | T. Schultz, Investment in Human Capital, Am. Econ. Rev., 51 (1961): 1–17.https://www.jstor.org/stable/1818907 |
| [3] |
A. Spence, Job market signaling, Q. J. Econ., 87 (1973), 355–374. https://doi.org/10.2307/1882010 doi: 10.2307/1882010

|
| [4] |
K. Arrow, Higher education as a filter, J. Publ. Econ., 2 (1973), 193–216. https://doi.org/10.1016/0047-2727(73)90013-3 doi: 10.1016/0047-2727(73)90013-3
|
| [5] | J. Mora, Sheepskin effects and screening in Colombia, Colomb. Econ. J., 1 (2003), 95–108. |
| [6] |
C. Castillo-Robayo, J. Da Silva Bichara, M. Pérez-Trujillo, Wage Returns to Colombia: A Quantile Analysis, Apuntes del Cenes, 36 (2017), 211–246. https://doi.org/10.19053/01203053.v36.n63.2017.5830 doi: 10.19053/01203053.v36.n63.2017.5830
|
| [7] | M. García-Bermeo, Evolución de los retornos de la educación en Colombia en el periodo 2002-2010, Bogotá: Universidad Externado de Colombia, 2019. |
| [8] |
P. Herrera-Idárraga, E. López-Bazo, E. Motellón, Double Penalty in Returns to Education: Informality and Educational Mismatch in the Colombian Labour Market, J. Dev. Stud., 51 (2015), 1683–1701. https://doi.org/10.1080/00220388.2015.1041516 doi: 10.1080/00220388.2015.1041516
|
| [9] | J. Tenjo, O. Alvarez, A. Gaviria, M. Jiménez, Evolution of Returns to Education in Colombia (1976–2014), Coyuntura Económica, 47 (2017), 15–48. |
| [10] | J. Mincer, Schooling, Experience and Earnings, New York: National Bureau of Economic Research, 1974. |
| [11] | A. Iregui, L. Melo, M. Ramírez, Wage differentials across economic sectors in the Colombian formal labor market: Evidence from a survey of firms, 2010. Available from: https://www.banrep.gov.co/en/borrador-629. |
| [12] | J. Urrutia, A. Ruiz, Ciento Setenta Años de Salarios Reales en Colombia. Revista ESPE - Ensayos Sobre Política Económica, Banco de la República, 28 (2010), 154–189. |
| [13] | D. Mesa, A. García, M. Roa, Estructura salarial y segmentación en el mercado laboral de Colombia: Un análisis de las siete principales ciudades, 2001-2005, Universidad del Rosario, Facultad de Economía, Serie Documentos de Trabajo, 2008, No. 52.https://doi.org/10.48713/10336_10858 |
| [14] |
O. Gracia, G. Hernández, J. Ramírez, Diferenciales salariales y mercados laborales en la industria colombiana, Desarrollo y Sociedad, 1 (2010), 53–100. https://doi.org/10.13043/dys.48.2 doi: 10.13043/dys.48.2
|
| [15] |
L. Bonilla-Mejía, The impact of gold mining on human capital accumulation: Evidence from Colombia, J. Dev. Econ., 145 (2020), 102471. https://doi.org/10.1016/j.jdeveco.2020.102471 doi: 10.1016/j.jdeveco.2020.102471
|
| [16] | P. Laplace, Th´eorie Analytique des Probabilit´es, Paris: Courcier, 1820. |
| [17] |
R. Koenker, G. Bassett, Regression Quantiles, Econometrica, 46 (1978), 33–50. https://doi.org/10.2307/1913643 doi: 10.2307/1913643
|
| [18] | G. Becker, B. Chiswick, Education and the Distribution of Earnings, Am. Econ. Rev., 56 (1966), 358–369. http://www.jstor.org/stable/1821299 |
| [19] |
W. Johnson, A Theory of Job Shopping, Q. J. Econ., 92 (1978), 261–277. https://doi.org/10.2307/1884162 doi: 10.2307/1884162
|
| [20] | B. Jovanovic, Job Matching and the Theory of Turnover, J. Polit. Econ., 87 (1979), 972–990. http://www.jstor.org/stable/1833078 |
| [21] |
J. Stiglitz, Information and Economic Analysis: A Perspective, Econ. J., 95 (1985), 21–41. https://doi.org/10.2307/2232867 doi: 10.2307/2232867
|
| [22] | L. Thurow, Generating Inequality: Mechanisms of distribution in the U. S. Economy, Basic Books: New York, 1975. |
| [23] | N. Sicherman, Overeducation in the labor market, J. Labor Econ., 9 (1991), 101–122. |
| [24] | N. Sicherman, O. Galor, A theory of career mobility, J. Polit. Econ. 98 (1990), 169–192. |
| [25] | C. Shapiro, J. Stiglitz, Equilibrium Unemployment as a Worker Discipline Device, Am. Econ. Rev., 74 (1984), 433–444. |
| [26] |
M. Caliendo, D. Cobb-Clark, A. Uhlendorff, Locus of Control and Job Search Strategies, Rev. Econ. Stat., 97 (2015), 88–103. https://doi.org/10.1162/REST_a_00459 doi: 10.1162/REST_a_00459
|
| [27] |
D. Card, F. Devicienti, A. Maida, Rent-Sharing, Hold-Up, and Wages: Evidence from Matched Panel Data, Rev. Econ. Stud., 81 (2014), 84–111. https://doi.org/10.1093/restud/rdt030 doi: 10.1093/restud/rdt030
|
| [28] |
Kurt, Lavetti, Compensating Differentials in Labor Markets: Empirical Challenges and Applications, J. Econ. Perspect., 37 (2023), 189–212. https://doi.org/10.1257/jep.37.3.189 doi: 10.1257/jep.37.3.189
|
| [29] | R. Collins, The Credential Society: An Historical Sociology of Education and Stratification, New York: Academic Press, 1979. |
| [30] |
W. Groot, H. Oosterbeek, Earnings Effects of Different Components of Schooling; Human Capital Versus Screening, Rev. Econ. Stat., 76 (1994), 317–321. https://doi.org/10.2307/2109885 doi: 10.2307/2109885
|
| [31] | K. Wolpin, Education and Screening, Am. Econ. Rev., 67 (1977), 949–956. |
| [32] |
F. Bourguignon, F. Ferreira, M. Menéndez, Inequality of opportunity in Brazil, Rev. Income Wealth, 53 (2007), 585–618. https://doi.org/10.1111/j.1475-4991.2007.00247.x doi: 10.1111/j.1475-4991.2007.00247.x
|
| [33] | D. Battiston, G. Cruces, L. López-Calva, M. Lugo, M. Santos, Income and beyond: Multidimensional poverty in six Latin American countries, Soc. Indic. Res., 112 (2013), 291–314. |
| [34] | S. Firpo, N. Fortin, T. Lemieux, Unconditional Quantile Regressions, Econometrica, 77 (2009), 953–973. |
| [35] |
D. Acemoglu, D. Autor, Skills, tasks and technologies: Implications for employment and earnings, Handb. Labor Econ, 4 (2011), 1043–1171. https://doi.org/10.1016/S0169-7218(11)02410-5 doi: 10.1016/S0169-7218(11)02410-5
|
| [36] |
S. McGuinness, E. Kelly, T. Pham, T. Ha, A. Whelan, Returns to education in Vietnam: A changing landscape, World Dev., 138 (2021), 105205. https://doi.org/10.1016/j.worlddev.2020.105205 doi: 10.1016/j.worlddev.2020.105205
|
| [37] |
S. Ozawa, S. Laing, C. Higgins, T. Yemeke, C. Park, R. Carlson, et al., Educational and economic returns to cognitive ability in low- and middle-income countries: A systematic review, World Dev., 149 (2022), 105668. https://doi.org/10.1016/j.worlddev.2021.105668 doi: 10.1016/j.worlddev.2021.105668
|
| [38] |
E. Peet, G. Fink, W. Fawzi, Returns to education in developing countries: Evidence from the living standards and measurement study surveys, Econ. Educ. Rev., 49 (2015), 69–90. https://doi.org/10.1016/j.econedurev.2015.08.002 doi: 10.1016/j.econedurev.2015.08.002
|
| [39] |
B. Vargas-Urrutia, Retornos a la educación y migración rural-urbana en Colombia, Revista Desarrollo Y Sociedad, 1 (2013), 205–223. https://doi.org/10.13043/dys.72.5 doi: 10.13043/dys.72.5
|
| [40] |
S. Mamun, B. Taylor, S. Nghiem, M. Rahman, R. Khanam, The private returns to education in rural Bangladesh, Int. J. Educ. Dev., 84 (2021), 102424. https://doi.org/10.1016/j.ijedudev.2021.102424 doi: 10.1016/j.ijedudev.2021.102424
|
| [41] | R. Ribero, C. Meza, Earnings of Men and Women in Colombia: 1976–1995, Archivos de macroeconomía, 1997. http://doi.org/10.2139/ssrn.44587 |
| [42] | N. Forero, L. Gamboa, Cambios en los retornos de la educación en Bogotá entre 1997 y 2003, Lect. Econ., 66 (2007), 225–250. |
| [43] |
A. García-Suaza, J. Guataquí, J. Guerra, D. Maldonado, Beyond the Mincer equation: The internal rate of return to higher education in Colombia, Educ. Econ., 22 (2011), 328–344. https://doi.org/10.1080/09645292.2011.595579 doi: 10.1080/09645292.2011.595579
|
| [44] |
M. Freire Seoane, M. Teijeiro Álvarez, La inversión en capital humano de los jóvenes gallegos: ¿sigue siendo rentable la educación? Cuadernos de Economía, 33 (2010), 45–69. https://doi.org/10.1016/s0210-0266(10)70064-9 doi: 10.1016/s0210-0266(10)70064-9
|
| [45] |
J. Heckman, Sample Selection Bias as a Specification Error, Econometrica, 47 (1979), 153–161. https://doi.org/10.2307/1912352 doi: 10.2307/1912352
|
| [46] |
J. Mora, D. Herrera, J. Álvarez, J. Arroyo, Returns to human capital in a developing country: A pseudo-panel approach for Colombia, Econ. Soc., 16 (2023), 57–70. https://doi.org/10.14254/2071-789X.2023/16-1/4 doi: 10.14254/2071-789X.2023/16-1/4
|
| [47] | J. Wooldridge, Econometric Analysis of Cross Section and Panel Data, 2 Eds., The MIT Press, 2010. |
| [48] | R. Koenker, Quantile Regression, Cambridge: Cambridge University Press, 2005. |
| [49] | P. Huber, The Behavior of Maximum Likelihood Estimates under Nonstandard Conditions, In: Proceedings of the Fifth Berkeley Symposium in Mathematical Statistics, Berkeley: University of California Press, 1967,221–233. |
| [50] | F. Perracchi, Econometrics, Chichester: Wiley, 2001. |
| [51] |
M. Buchinsky, Estimating the asymptotic covariance matrix for quantile regression models, A Monte Carlo study, J. Econ., 68 (1995), 303–338. https://doi.org/10.1016/0304-4076(94)01652-G doi: 10.1016/0304-4076(94)01652-G
|
| [52] |
M. Buchinsky, Recent Advances in Quantile Regression Models: A Practical Guideline for Empirical Research, J. Hum. Resour., 33 (1998), 88–126. https://doi.org/10.2307/146316 doi: 10.2307/146316
|


Figures(3) / Tables(5)

Jacobo Campo-Robledo, Cristian Castillo-Robayo, Julimar da silva Bichara. Quantile and interquantile regression models for returns to education by economic sector and vulnerable population in Colombia[J]. AIMS Mathematics, 2024, 9(12): 35091-35124. doi: 10.3934/math.20241669


 DownLoad: