
Citation: C. Zwanenburg, G. Erkens. Uitdam, the Netherlands: test site for soft fibrous peat[J]. AIMS Geosciences, 2019, 5(4): 804-830. doi: 10.3934/geosci.2019.4.804
[1] | Jubert A. Pineda, Richard B. Kelly, Laxmi Suwal, Lachlan Bates, Scott W. Sloan . The Ballina soft soil Field Testing Facility. AIMS Geosciences, 2019, 5(3): 509-534. doi: 10.3934/geosci.2019.3.509 |
[2] | Bruno Di Buò, Marco D’Ignazio, Juha Selänpää, Markus Haikola, Tim Länsivaara, Marta Di Sante . Investigation and geotechnical characterization of Perniö clay, Finland. AIMS Geosciences, 2019, 5(3): 591-616. doi: 10.3934/geosci.2019.3.591 |
[3] | Santiago Quinteros, Aleksander Gundersen, Jean-Sebastien L'Heureux, J. Antonio H. Carraro, Richard Jardine . Øysand research site: Geotechnical characterisation of deltaic sandy-silty soils. AIMS Geosciences, 2019, 5(4): 750-783. doi: 10.3934/geosci.2019.4.750 |
[4] | Annika Bihs, Mike Long, Steinar Nordal, Priscilla Paniagua . Consolidation parameters in silts from varied rate CPTU tests. AIMS Geosciences, 2021, 7(4): 637-668. doi: 10.3934/geosci.2021039 |
[5] | Annika Bihs, Mike Long, Steinar Nordal . Geotechnical characterization of Halsen-Stjørdal silt, Norway. AIMS Geosciences, 2020, 6(3): 355-377. doi: 10.3934/geosci.2020020 |
[6] | Graham L. Gilbert, Arne Instanes, Anatoly O. Sinitsyn, Arne Aalberg . Characterization of two sites for geotechnical testing in permafrost: Longyearbyen, Svalbard. AIMS Geosciences, 2019, 5(4): 868-885. doi: 10.3934/geosci.2019.4.868 |
[7] | Aleksander S. Gundersen, Ragnhild C. Hansen, Tom Lunne, Jean-Sebastien L’Heureux, Stein O. Strandvik . Characterization and engineering properties of the NGTS Onsøy soft clay site. AIMS Geosciences, 2019, 5(3): 665-703. doi: 10.3934/geosci.2019.3.665 |
[8] | Don J. DeGroot, Melissa E. Landon, Steven E. Poirier . Geology and engineering properties of sensitive Boston Blue Clay at Newbury, Massachusetts. AIMS Geosciences, 2019, 5(3): 412-447. doi: 10.3934/geosci.2019.3.412 |
[9] | Carlos Rodrigues, Nuno Cruz, Manuel Cruz . Geotechnical characterization of residual granite soils. The test site of Polytechnic Institute of Guarda (Portugal). AIMS Geosciences, 2025, 11(2): 442-467. doi: 10.3934/geosci.2025018 |
[10] | David Igoe, Kenneth Gavin . Characterization of the Blessington sand geotechnical test site. AIMS Geosciences, 2019, 5(2): 145-162. doi: 10.3934/geosci.2019.2.145 |
Due to the heterogeneity, susceptibility to creep and fibrous nature of peat, its material behaviour is complex. Consequently, building on a peat foundation imposes engineering challenges. Figure 1 shows the extent of peat layers in the Netherlands, with each dot on the map representing a boring in which a peat (or otherwise organic) layer was detected. The Netherlands has approximately 17.3 million inhabitants [1], 9 million of whom live in the area indicated by the dots in Figure 1, and an average population density of 416 inhabitants per km2. Building on peat deposits is therefore unavoidable. The tendency towards increasing urbanisation in the Netherlands makes knowledge about peat behaviour vital for the construction and maintenance of its infrastructure.
For the purposes of the reinforcement of a dike section on the bank of the Markermeer lake, a test site was established to study the strength behaviour of peats. The test site is located near Uitdam, approximately 30 km north of Amsterdam (see Figure 2). The main goal of the testing was to study operational undrained shear strength in the field and to establish correlations with field probe testing and laboratory testing.
This paper summarises work presented in earlier papers [3,4,5], and provides an overview of the testing conducted at the test site. It also shows how different laboratory and field measurement techniques were combined to produce an accurate description of the shear strength of peat.
A total of six field trials were conducted at the Uitdam site to establish the operational undrained shear strength of the peat deposit. The trials consisted of placing concrete slabs on top of the peat layer, followed by watertight containers and the excavation of a trench in front of the test set-up. Remote filling of the containers and the lowering of the water table in the excavated trench were used to induce failure. During loading, the displacements of the containers, horizontal displacement in the subsoil, pore water pressure, water level in the container, water level in the trench and vertical displacement of the bottom of the excavated trench were measured [3].
Figure 3 shows the set-up for the different tests. In Tests 1 and 2, only one layer of concrete slabs was used to create a stable foundation for the containers and the tests were conducted immediately after the excavation of the trench. Back analysis of Tests 1 and 2 resulted in an estimate of the original non-pre-loaded operational undrained shear strength of the peat layer. Test 3 failed prematurely and it will not be discussed further. In Tests 4 and 5, seven layers of concrete slabs were positioned and a consolidation time of approximately two months was applied. In Test 6, 10 layers of concrete slabs were used for pre-loading during a six-month period and no trench was excavated. Tests 4, 5 and 6 provided information about the effect of the field stress level on operational undrained shear strength. This information is important since the construction of stability berms is a conventional approach for the proposed dike reinforcement.
Figure 4 shows the layout of the test site and the location of the six field tests. The analyses of the tests drew on a large number of field probe tests and bore holes, see Table 1. The field investigation used two different CPTu cones. The cone with a superficial area of 10 cm2 can be considered as the standard cone in use in the Netherlands. This cone measures the pore pressure at the cone shoulder (the u2 position) and its area ratio is a = 0.86. The 15 cm2 cone was calibrated for low stress levels. This cone also measures the pore pressure at the shoulder of the cone (the u2 position) and its area ratio is a = 0.59. Furthermore, tests were conducted with cones that measure pore pressure at three levels—u1, u2 and u3—and tests were also conducted using a cone that can measure the cone temperature. A series of field vane tests was conducted with a vane diameter of 65 mm and a vane height of 130 mm. The vane was rotated at a speed of 6°/min. Finally, two series of ball penetrometer tests were conducted using slightly different balls. Samples for laboratory testing were taken with the Begemann continuous sampler [6]. A series of block samples, diameter 0.4 m and height 0.5 m, were taken for specific laboratory tests. The locations of the field measurements described in this paper are shown in Figure 4.
type of test | number |
CPTu, 10 cm2 cone | 36 |
CPTu, 15 cm2 cone calibrated for low stress levels | 26 |
ball penetrometer D = 80 mm | 10 |
ball penetrometer D = 78 mm | 16 |
CPTu, with u1, u2 and u3 measurements | 5 |
CPT, with temperature measurement | 4 |
Field vane test | 77* |
Begemann, continuous sampling | 15 |
Block samples | 30 |
*= six depth profiles from 12 measurements prior to testing, two depth profiles from 2 and 3 measurements after the completion of field trial 6. |
It should be noted that the Field Vane Test, FVT, is used sporadically in the Netherlands, [7], and that there is little experience with it in Dutch peats. The literature reports vary with respect to its use in peats. The application of a correction factor µ = 0.5 for peats is suggested ([8,9]). This correction is an empirical factor that follows from a comparison with laboratory test data or other field probe types. By contrast, some authors [10,11,12] conclude that the FVT generates unreliable results in peats and that it is of little engineering value. This conclusion is based upon the poor reproducibility these authors find in the tests and the expected failure mode around the blades for fibrous peat, [11]. In the Uitdam location, a good match was found between the corrected FVT results and the undrained shear strength obtained from CPTu and ball penetrometer tests, as shown later in this paper.
Table 2 summarises the laboratory testing programme, which consisted of undrained triaxial compression and triaxial extension tests, and direct simple shear tests. The results are discussed in Section 3. Furthermore, constant rate of strain, CRS, and incremental loading tests, IL, were conducted to obtain compression indices and yield stress values.
test type | number | |
Triaxial tests | isotropically consolidated undrained compression tests, CIUC | 23 |
anisotropically consolidated undrained compression tests, CAUC | 23 | |
isotropically consolidated undrained extension tests, CIUE | 6 | |
consolidated anisotropically undrained extension tests, CAUE | 8 | |
Direct Simple Shear tests, DSS | 51 | |
Constant Rate of Strain tests, CRS | 12 | |
Incremental loading tests, IL | 98 |
Table 3 provides a summary of the applied loads and operational undrained shear strength, su, found from the back analysis of the field trials, see also [3]. The operational undrained shear strength was determined by finite element analysis using a simple Tresca material model. The test set-up consisted of a row of four containers that acted uniformly in Tests 1, 2 and 6. In Tests 4 and 5 the subsoil deformed such that the concrete slab foundation started to tilt and the containers slid off individually. This behaviour was not captured by the failure planes found in the back analysis. An exception was one container in Test 4 for which a subsoil failure was found. The relatively high operational undrained shear strength found in the analysis of this single container is explained by 3D effects which were not considered in the back analysis. Test 6 induced a larger pre-loading during a longer period. Moreover, because no trench had been excavated, the failure plane also mobilised soil outside the pre-loaded area. Consequently, a different su was applied in the pre-loaded and non-pre-loaded area in the analysis. The undrained shear strength for the non-pre-loaded area was obtained from the CPTu readings discussed later in this paper.
Test number | pre-load [kN/m2] | duration pre-loading [days] | total loada [kN/m2] | su [kPa] | Comments |
Test 1 | - | - | 25 | 7.4 | Test 1 and 2 designed to derive the actual operational undrained shear strength |
Test 2 | - | - | 23.5 | 7.3 | |
Test 4 | 23.5 | 74f | 40.9/58.1 | 13.2b | Test 4 and 5 designed to study the strength increase due to a small pre-loading, e.g. a stability berm |
Test 5 | 23.5 | 62g | 41.5 | 8.5c | |
Test 6 | 33.6 | 160h | 78.6 | 5.5d | Test 6 designed to study the effect of higher pre-loading, e.g. below dike body |
12.6e | |||||
a The total load includes the pre-load mentioned in the second column. b Computed failure mechanism did not capture the sliding and toppling of the containers. The given su value refers to the single container for which subsoil failure was found. c Computed failure mechanism did not capture the sliding and toppling of containers. d assumed beyond the area influenced by pre-loading. e assessed in the region below pre-loading. f pre-load applied for a period of 22 days. g pre-load applied for a period of 35 days. h pre-load applied for a period of 56 days. |
In summary, the failure modes in Tests 1 to 5, the tests that include an excavated trench, involve almost vertical rupture planes. These planes developed behind the row of containers (in other words, the container row was between the rupture plane and the trench). Figure 5 shows an impression of these rupture planes as found for Test 5. After the completion of the field trials, inspection pits were excavated to establish the failure mode. It was found that the rupture planes were nearly vertical, extending to depths of up to 2 m, which is approximately the depth of the excavated trench. The rupture planes developed in combination with a horizontal subsoil displacement towards the trench. It was not possible to reproduce this type of failure in numerical analyses, which found circular sliding planes.
All elevation levels in this paper are related to normalised Amsterdam elevation, NAP, which is approximately mean sea level. The ground level at the test site is NAP −1.2 m to NAP −1.3 m, and the phreatic groundwater level during testing is approximately 0.2–0.3 m below surface level. Generally, the subsurface consists of a peat layer approximately 5.5 m thick above a clay deposit of the same thickness containing a succession of organic and silty clay layers. The clay layers are followed by a thin basal peat layer with a thickness of approximately 0.4–0.5 m resting on Pleistocene sand deposits.
There are deep polders nearby and the hydraulic head in the underlying Pleistocene sand layer is therefore relatively low at NAP −2.0 m, which is below the phreatic groundwater level, indicating infiltration. Measurements show that the pore pressure in the peat deposit is nearly hydrostatic and there is a drop in the hydraulic head in the clay deposit.
The peat can be described in general terms as Phragmites (Reed), with sedge and Sphagnum inclusions with minor vegetal decomposition, H2-H3 on the von Post scale [11]. Sphagnum inclusions tend to occur at relatively shallow locations since this oligotrophic peat (developed in an area poor in nutrients) was formed during the final stage of peat bog formation. Sedge peats dominate the central part of the peat sequence, with the lower part containing more and more Phragmites. The lower Phragmites peat below approximately NAP −5.5 m is often very clayey and may be classified as clayey peat to peaty clay. The clay layers underlying the peat were deposited in low-energy conditions on the landward side of former tidal basins. Deeper, more silty and sandy, clay layers probably represent small tidal channels, possibly subaqueous in nature. On top of the whole sequence, a thin layer (~30 cm) of recent marine clay can be found, indicating the increasing influence of newly formed lakes and tidal basins, now the Markermeer lake, see Figure 2. Figure 6 provides a more detailed description of the peat deposit as found in three borings, HB01 to HB03, the location of which is shown in Figure 4.
Figure 7 shows the depth profiles for the bulk density, ρ, solid density, ρs, loss on ignition, LOI, and water content, w. The laboratory bulk density for the peat deposit is 0.95 Mg/m3 ± 7%. This is slightly lower than the density of pore water and it can be explained by the observed presence of gas. Consequently, the low bulk density and relatively high groundwater table results in low effective stresses in the peat layer. It should be noted that a low effective stress level is typical for peat deposits (see, among others, [11,13]).
The solid density of the peat solids is 1.53 ± 1.6 Mg/m3, rapidly rising to 2.65 ± 3% Mg/m3 in the underlying clay layer. Figure 7a shows that the solid density provides a clear boundary between the peat layer and the underlying organic clay layer, while the bulk density changes more gradually.
Loss on ignition, LOI, is defined as the percentage of material lost when heating the sample. Different procedures are used by different researchers, ranging from 400 ℃ during 12 hours to 900 ℃ during 1.5 hours [13]. At temperatures above 450 ℃, the clay particles present may lose fixed water or other non-organic material. The organic content, OC, is related to LOI by a correction factor C: OC = 100 – C × (100 − LOI) [13], in which OC and LOI are stated as percentages. Different values for C are required at different temperatures: from 1.014 when heating to 400 ℃ during 12 hours to 1.168 when heating to 900 ℃ during 1.5 hours. In accordance with Dutch standards, [14], a temperature of 550 ℃ and burning time of four hours were used in this study, resulting in C = 1.04 (see [15]).
LOI varied between 75% and 92%, indicating the strong organic content of the tested material. The water content varied between 640% and 1240% and fell to 75% in the underlying clay layer. It should be noted that the water content increased in the peat layer from 640% at the top to 1240% at the bottom of the peat deposit.
In two boreholes, BT03d and B16d, the location of which is shown in Figure 4, specimens were taken for constant rate of strain oedometer tests at depth intervals of 0.5 m. Figure 8a gives the depth profile for the yield stress, σ'p, which was obtained by the applying the procedure given by Becker [16]. Relatively high yield stresses were found in the dry crust at the top. Below that, σ'p seems to fall from approximately 10–12 kPa to 5–7.5 kPa, with the lowest value being found at the same depth as the largest value for the water content in Figure 7c. The relation between water content, w, and yield stress, σ'p, can be found in Figure 8b. It should be noted that the high yield stress found in the dry crust, σ'p = 33 kN/m2, has been omitted from Figure 8b. Generally, the water content falls with increasing yield stress.
The increase in water content and decrease in yield stress in the peat layer could indicate a mild increment in the degree of humification over the peat layer. The intrusion of oxygen from above could have caused a larger degree of humification in the upper part of the layer. It should be noted that the Von Post procedure includes a visual test which indicated that the Uitdam peat is roughly in the range of H2 to H3, which may be not accurate enough to establish a gradient over the depth. An alternative explanation could be a difference in the growing conditions for the shallow peat as opposed to the deeper peat layers. Whereas the shallow peat layers formed in a peat dome where the phreatic water level may fluctuate to some extent, the deeper layers were formed in a fen where groundwater levels were levelled by the regional coastal groundwater system. The coastal groundwater system during fen formation was dominated by decelerated, but ongoing, eustatic sea level rise. As a result, the shallower peat is more likely to have experienced drained conditions in the geological past and this factor may have contributed to the increased yield stresses which we observed.
Figure 9a shows the comparison of the compression index, Cc, and natural water content, w0, for 72 incremental loading tests conducted on specimens from the test site. The results were compared with findings in literature. The relation suggested by Azzouz [17], that Cc = 0.0115 w0 seems to provide an upper limit for the Uitdam data, while Hobbs [13], provides a lower limit: Cc = 0.0065 w0. A best fit for the Uitdam data gives Cc = 0.0088 w0. It should be noted that a careful determination of the initial void ratio, e0, is needed to derive this correlation and that this derivation requires the solid density, ρs, to be determined for each specimen individually.
Figure 9b shows the relation between the initial void ratio e0 and the initial water content w0 as found for the incremental load tests discussed in Figure 9a. The relation between e0 and w0 found for the Uitdam peat deposit fits nicely to the results found for organic clay at three different locations in the Netherlands [7].
The creep parameters Cα found in the IL tests shown by Figure 8a range between 0.025 and 0.057 with an average of Cα = 0.036. The ratio of normal compression index to creep index, CR/Cα, ranges between 5.6 and 17, with an average value of 12.4. These values concur well with the values presented in the literature: ratios ranging from 10 to 14 for indices based on void ratio, Cc/Cα, [8] and a range of 7 to 15 for the indices ratio based on natural strain [7].
In situ permeability was measured in three falling head tests, the locations of which are shown in Figure 4: pb01 at 1.8 m below ground level, pb 02 at 3.5 m and pb03 at 3.9 m. It should be noted that the temporary road shown in Figure 4 was constructed at a later stage. Head differences of 0.3, 0.5, 0.8 and 1.0 m were used to establish permeability. The observed permeability ranged from 8.5 × 10⁻⁷ m/s to 2.3 × 10⁻⁶ m/s. The stepwise pre-loading in Test 6 allowed for the assessment of the permeability of the peat layer in the field by means of a back analysis of settlement data and pore pressure measurements (see also [3]). For the first loading step, it was found that k = 2.9 × 10⁻⁶ m/s, which is comparable with the upper range of the falling head data. The analysis of a later loading step, during which the vertical strain was 18% on average, found that k = 8.68 × 10⁻⁸ m/s.
Figure 10 compares the in situ and laboratory permeability to literature data [8]. For reasons of clarity, only one typical oedometer test is shown: Test 40A taken from boring A2 (see Figure 4) from a depth of 1.0 m below ground level. This test is an incremental loading test in which successive loading steps of 2.3, 5.1, 10.8, 20.7, 40.5 and 100.0 kPa are applied. Permeability is derived using the Casagrande method [18,19]. No clear curve was found for the first loading step and no value for permeability is therefore available for this loading step. Figure 10 shows permeability for the individual loading steps related to the average void ratio during the step. Free-field permeability is related to the average initial void ratio, e0, from all incremental loading tests: e0 = 15.3. Free-field permeability was larger than found in oedometer tests. The difference between free-field permeability and the laboratory results can be explained by different phenomena. For example, permeability in the field will be dominated by the larger pore structure, which might not be present in the tested specimen. This leads to permeability being underestimated by laboratory testing. By contrast, the presence of gas bubbles in the field will slow down the pore water flow, resulting in an apparent decrease in permeability. The use of fully saturated specimens in laboratory testing could overestimate actual permeability by comparison with field conditions of this kind. Finally, the derivation of permeability using the classical Casagrande method [18,19] or Taylor method [19,20] is usually not successful in the first loading steps of incremental loading tests. Realistic values for permeability are obtained in later loading steps when some compression has occurred. The permeability obtained with the analysis of the data from Test 6 at 18% vertical strain seems to match the oedometer test data.
The Uitdam data fits nicely with the literature data [8]. Furthermore, during compression, the observed permeability in the individual steps remains within the upper and lower lines found in the literature data. The reduction in permeability in line with void ratio e can be described by [21]:
(1) |
in which Ck represents the permeability strain factor and k0 the initial permeability corresponding to the initial void ratio e0. Although Eq 1 was originally derived for clays and silts in accordance with [8], Eq 1 is also used in this study to describe the permeability obtained for peats. Applying Eq 1 to the data from Test 40A results in Ck = 3.35 and k0 in the order of 1 × 10⁻⁷ m/s.
Table 2 summarises the laboratory testing programme. This paper discusses some of the highlights of laboratory test results in relation to the interpretation of the strength behaviour of the tested peat.
Figure 11 shows the stress paths, deviatoric versus isotropic effective stress, of 22 isotropically consolidated triaxial undrained compression (CIUC) tests. The tests do not show clear failure. During shearing, excess pore pressure builds up until the lateral effective stress is reduced to 0 kPa. In the p'-q space, the stress condition for which the lateral effective stress is reduced to 0 kPa is shown by the tension cut-off (TCO) line (see Figure 11). Here, the stress paths stop when reaching the TCO line due to the maximum displacement applied by the equipment. Continuation of the loading would cause the effective stress paths to follow the TCO line. Failure was not found in the tests shown in Figure 11. Similar behaviour during triaxial compression tests has been reported by [7,22,23,24] and others.
The absence of a clear failure in the test results represents an obstacle to the accurate assessment of the mobilised undrained shear strength suC. Undrained shear strength was estimated as the intersection of the extrapolation of the middle section of the effective stress path and the TCO line (see Figure 11) [7]. This results in an average, normally-consolidated, undrained shear strength ratio, suC/σ'v = 0.59, and a coefficient of variation CoV = 0.22. This value nicely fits the values reported for peats in international literature [8,25].
A series of fifteen Direct Simple Shear (DSS) tests were conducted to study the influence of OCR on the operational undrained shear strength. The tests were conducted under constant height conditions representing undrained behaviour [26] and a shearing rate of 7.45%/h. Figure 12 shows the results in the graphs of vertical stress, σv, versus shear stress, τ, and shear stress, τ, versus shear strain, γ. The samples were consolidated at vertical stress σ'v = 50 kPa and re-consolidated at a lower stress level, inducing OCRs of 1.25, 2, 5 and 10. Figure 12 shows the results. The OCR dependency of the undrained shear strength is given by [27]:
(2) |
in which S represents the undrained shear strength ratio and m the strength gain factor. The least squares approach to fit the measurement data to Eq 2 yields SD = 0.47 and mD = 0.96, with the weighted least squares sum R2 = 0.88. International literature provides little information on SD. Boylan & Long [12] report SD ~ 0.4 on average for sixteen test sites in Ireland, Scotland and the Netherlands. O'Kelly [25] provides a literature overview that includes the data discussed in this paper and reports values for SD ranging between 0.38 and 0.55.
Undrained DSS tests have been conducted at approximately field stress level, which is estimated at σ'v = 5 kPa. The application of such a low stress level imposes stringent constraints on the accuracy of the testing equipment. Figure 13 shows the results of four typical tests. The undrained shear strength obtained from DSS testing, suD, ranges from 5 to 7 kN/m2 and is a good fit with the operational shear strength found from the back analysis in field Tests 1 and 2 (see Table 3).
To test possible size effects, a series of 12 large triaxial tests with initial diameter D0 = 0.4 m and initial height of H0 = 0.8 m were conducted (see [5]). Samples were retrieved with a predecessor of the Deltares Large Diameter Sampler (DLDS) [28].
The test series consisted of 6 normally consolidated triaxial compression tests and 6 tests consolidated at field stress level. The normally consolidated tests were anisotropically consolidated at σ'h/σ'v = 0.3, which is approximately Knc0 for the tested material. The six tests consolidated at field stress level were isotropically consolidated. The effective horizontal stress in the field is believed to be too low to be correctly reproduced in the triaxial set-up. The tests on large samples were conducted using the same procedures as in the tests on samples with a conventional size, D0 = 0.065 m and H0 = 0.13 m.
Figure 14 provides an impression of the tests. Figure 15 shows some of the test results. The stress paths, deviatoric versus isotropic effective stress, Figure 15a, rise to the TCO line and tend to follow it. This matches the pattern for the conventional sized samples. In accordance with the procedure in Figure 11, the undrained shear strength ratio can be retrieved from the six normally consolidated tests: Slarge TX = 0.63. This value is larger than found for the conventional sized samples and it can be explained by the difference in the consolidation procedure: isotropically consolidated for conventional sizes and an-isotropically consolidated for large sizes. A smaller coefficient of variation, CoV = 0.05, was found for the large samples. This can be explained by the greater ability for averaging shear strength heterogeneity provided by large volume testing.
Figure 15b shows the stress-strain paths for the large sized triaxial tests. The fall in deviator stress, q, observed in the normally consolidated tests clearly indicates failure. It should be noted that post-failure behaviour has been omitted from Figure 15a for reasons of clarity. The failure found in the normally consolidated tests is accompanied by a steep sliding plane, as shown by Figure 14b. These failure modes are typical for large tests, while none of the tests with conventional sizes ended with a failure plane, even though equivalent strain levels were applied. The difference in behaviour might be explained by the sliding and rupture of the fibres, which occurs at some level of actual displacement rather than strain. This also explains why the large samples consolidated at field stress level did not show failure. In these tests, displacement in radial direction remained smaller.
An extended series of field probe tests and field vane tests were conducted at the test site (see Table 1). Figure 16 shows some typical results for the CPTu tests, ball penetrometer tests and field vane tests (FVT). Figure 4 lists the locations of the presented measurements. For the CPTu data, the corrected cone resistance, qnet, presented was derived from, among others [29]:
(3) |
in which qc represents the uncorrected cone resistance, a the area ratio (here a = 0.59), u2 represents the pore pressure measured just above the cone shoulder and σv0 the overburden pressure. No corrections were made with respect to the ball penetrometer tests. The correction of the measured resistance, qball, in peats for measured pore pressure is minor [30]. Figure 16c shows the uncorrected FVT results. The corrections for FVT are discussed later in this paper. A trend line, the dotted line in Figure 16a and 16b, has been added to highlight the general trend. Both the CPTu and the ball penetrometer test data show a minor decline in both qnet and qball over the peat layer depth. This behaviour is remarkable because an increase in penetration resistance is generally expected in homogeneous deposits due to an increase in effective stress over depth [29]. The low density of the peat and high phreatic water level result in a low effective stress level in the peat deposit which is probably constant over the peat deposit. Figure 8a shows a decline in yield stress, σ'p, while Figure 7c shows an increase in water content: both correspond to the decline in cone resistance.
Figures 16a and b clearly show a dry crust at the top followed by a corrected cone resistance in the order of 0.1 MPa in the peat deposit. It should be noted that, as in the depth profiles for solid density, Figure 7a, and water content, Figure 7c shows a clear transition between the peat layer and organic clay layer below. The CPTu and ball penetrometer readings in Figure 16, however, do not show a change in measured resistance around NAP −5 to −6 m. This indicates that the strength characteristics in the organic clay layer are equivalent to those in the peat layer. The stiffer clays below NAP −7 m are indicated by an increase in qnet and qball.
The aim of the field probe testing was to correlate the measured resistance to the laboratory test results. Before considering the correlations, some considerations on the accuracy of the field probe tests will be discussed, followed by a discussion of drainage conditions during probe testing to establish drained, undrained or partially drained soil behaviour.
The accuracy required in CPTu testing is set by [31]. For the highest application class, class 1, the minimum accuracy for cone resistance is 35 kPa, while a minimum accuracy of 100 kPa is required for class 2. These accuracy requirements are in the same order of magnitude as the average cone resistance observed at the test site (see Table 4). Since the probes measure a force rather than a stress, it has been suggested that accuracy could be raised by applying larger probes so that the resistance yields larger forces to be measured. Table 4 presents the mean and the CoV for the measured resistance in the peat layer. Table 4 shows that using the 15 cm2 cone does indeed result in a lower CoV for the measured cone resistance than using the 10 cm2 cone. Two different ball penetrometers, however, have a similar diameter and result in a considerable difference in CoV for the measured resistance. It should be noted that the lower CoV found for the larger probes does not necessarily reflect higher accuracy. Larger probes will result in more averaging of local heterogeneity than smaller probes [30].
µqc, µqb | CoVqc, CoVqb | n | ||
CPTu | 10 cm2 | 0.14 | 0.21 | 30 |
15 cm2 | 0.12 | 0.17 | 15 | |
ball | D = 80 mm (50 cm2) | 0.11 | 0.17 | 10 |
D = 78 mm (48 cm2) | 0.13 | 0.11 | 5 |
A typical factor for the accuracy of CPTu testing in peat is the influence of temperature change on the readings. Figure 17 shows the readings for CPTu S05. Negative readings for qc were found between NAP −3 m and NAP −7 m. The measurements can be explained by a temporary zero shift caused by a change in temperature [32]. The measurements were made on a warm summer day, with the cone being warmed up in the CPT truck. The cone cooled down when penetrating the relatively cool peat. It was possible to make realistic measurements after pre-cooling the cone by placing the cone in a bucket of water with a temperature of approximately 10 ℃. Figure 17 also shows the readings for CPTu S06 conducted at a distance of 8.3 m from the S05 location with a different cone. CPTu S08 was conducted at 11.3 m from the S05 location with the same cone as used for S05. In both cases, S06 and S08, the cone was pre-cooled. Differences in qc below NAP −11 m can be explained by a local fluctuation in the top of the Pleistocene sand layer. The pre-cooled cone used in S06 and S08 shows readings in the peat layer ranging between 0.1 and 0.2 MPa. Comparison of the S05 readings with the S06 and S08 readings shows that the S05 readings are inaccurate over the entire depth of the peat layer. To further confirm the hypothesis of the influence of the temperature shift on CPTu data, another cone that allows for temperature readings was used (see Figure 17b). The readings were taken at a distance of 0.5 m from the S05 location. The cone was not pre-cooled for the temperature readings. The initial cone temperature was 17.7 ℃, declining during penetration to 10.6 ℃. A temperature increase was found when the sand deposit was reached due to friction between the cone and the sand. It should be noted that the temperature readings were taken in the same week as S05 in similar weather conditions. The cone temperature fell during the first 4.5 m of penetration. Over this depth, the readings for S05 start to deviate from the S06 and S08 readings. The measurements confirm that the temperature changes in the cone should be kept to a minimum when testing peat deposits [32].
Before correlating shear strength parameters from laboratory testing to field probe measurements, some understanding of the soil response (drained/undrained or partially drained) during testing is required. The soil response will vary depending on the coefficient of consolidation, cv, of the tested soil, penetration rate and dimensions of the probe. Larger probes will induce larger failure mechanisms with a smaller degree of consolidation during the passage of the probe [29,32]. The measured resistance will generally increase with increasing consolidation during testing [33]. Consequently, larger cone resistances are to be expected with the 10 cm2 cone than with the 15 cm2 cone. This could explain the differences found in average cone resistances presented in Table 4. However, the resistance measured by the ball penetrometer is not significantly smaller than the resistance found with the 15 cm2 cone. If partial drainage had played a role, a further reduction would have been expected compared with the 15 cm2 cone.
Figure 18 shows the pore pressure measurement at the u2 position for the CPTu S06 location (see Figure 4). Remarkably, a negative pore pressure developed at the top of the peat layer and u2 remained below hydrostatic pore pressure u0. This behaviour was typical for all measurements conducted with the 15 cm2 cone in this project. The measurements result in a negative pore pressure index, Bq [29]:
(4) |
in which u2 represents the pore pressure at the cone shoulder, u0 the hydrostatic pore pressure and qnet the corrected cone resistance according to Eq 3. The low u2 values with respect to u0 can be explained by the complex deformation pattern around the cone [11].
To further study the drainage around the probe, an assessment was made of the normalised penetration velocity, V [33]:
(5) |
in which v is the probe velocity (0.015 m/s here), d the probe diameter and cv the coefficient of consolidation. As explained in Section 3, back analysis of settlement data shows that the coefficient of consolidation, cv, is in the range of 100 to 300 m2/y. Table 5 shows the normalised velocity, V, for the two cones and ball penetrometers. Undrained behaviour is to be expected when V is greater than 30–100 [33]. Drained behaviour is considered when V falls below 0.01. The calculated values for V for the ball penetrometer are greater than the range mentioned above, indicating that the soil behaves in an undrained way around the ball penetrometer. For the cones only, the lower cv yields a value for V which is clearly outside the range of 30–100; with the higher cv value, V falls within the range, indicating that some partial drainage might occur.
probe | D [m ] | V [-] | |
cv = 100 m2/y (3.2 × 10⁻⁶ m2/s) | cv = 300 m2/y (9.5 × 10⁻⁶ m2/s) | ||
cone, 10 cm2 | 0.0357 | 169 | 56 |
cone, 15 cm2 | 0.0437 | 206 | 69 |
ball | 0.08 | 378 | 126 |
On the basis of the results presented in Table 5, it is concluded that the soil mainly behaves in an undrained way during the penetration of the probes. This is supported by the small difference in µqc between de CPTu and ball penetrometers in Table 4, despite their different dimensions. The difference in µqc between the 10 cm2 and 15 cm2 cone is then explained by differences in measurement accuracy.
Regarding the FVT measurements, Eq 5 gives V = 1.16 − 0.39 for the applied rotation rate (6°/min) and diameter (d = 0.065 m), which would indicate drained behaviour. However, [34] provide an alternative approach to determine the effect of partial drainage using a normalised time T:
(i) |
in which cv is the coefficient of consolidation, d the vane diameter, d = 0.065 m and t the time to failure. Undrained behaviour is found for T < 1 and drained behaviour for T > 20. In accordance with [34], the value for t should include the period between the end of vane insertion and the start of rotation. Unfortunately, this period was not measured. Failure is typically found at a rotation of 40°, which is typically reached after 6.75 minutes, yielding T = 0.3 − 0.9. An upper limit for the time to failure observed in the tests is 10 minutes and T = 0.45 − 1.35. By contrast with Eq 5, applying Eq 6 suggests undrained soil behaviour during the FVT.
On the basis of the discussion above, it is assumed that the probe tests can be considered to be undrained and that measured resistances are comparable with undrained shear strength characteristics found in laboratory tests. However, approximately one year after finalising the field trials at the test location, a series of five additional CPTu tests was conducted in a corner of the test field (see Figure 4). The tests were conducted with a 10 cm2 cone, area ratio a = 0.75, which is different from the cone mentioned in Tables 1, 4 and 5. Tests were conducted at two different penetration rates, v = 0.01 m/s, additional CPTu 03 in Figure 4 and 0.002 m/s, additional CPTu 04 in Figure 4. The penetration rate had no effect on pore pressure development, u2 ~ 0, or the pore pressure index, Bq ~ 0, as shown in Figure 19. It should be noted that qnet reported in Figure 19a for apparently drained conditions is in the same order of magnitude as reported in Figure 16a, which is considered to reflect undrained behaviour. Additional laboratory testing indicates slightly lower strengths for this particular part of the test field and the match for qnet in Figures 19a and 16a could be coincidental.
The undrained shear strength was assessed from CPTu and ball penetrometer readings by:
(7) |
in which suCPTu represents the undrained shear strength from CPTu readings, suball represents the undrained shear strength derived from ball penetrometer tests, qnet the corrected cone resistance according to Eq 7, qball the uncorrected ball penetrometer resistance, Nkt the cone factor and Nb the ball factor.
The values for Nkt and Nb are derived by comparing the qnet and qball measurements respectively with the DSS test results and operational undrained shear strength found in the field trials (see Table 6). The DSS test results considered were compared with the nearest CPTu or ball penetrometer readings with a distance of maximum 1 m between the boring and CPTu or ball penetrometer reading.
factor | Field trials | DSS |
Nkt | 15.3 (± 30%a) | 17.5 (CoV = 12.6b) |
Nb | 16.5 (± 20%a) | 17.9 (CoV = 6.3b) |
a based on variations in qc and qball respectively b based on statistical analysis |
Table 6 shows the cone factors Nkt and Nb based on field trials and DSS test results. An impression of accuracy is given in both cases. Only limited data is available for the comparison with field trial data and the presented uncertainty (±30% and ±20% respectively) originates mainly from fluctuations in CPTu and ball penetrometer readings. For the derivation from the DSS test results, a statistical analysis was used to produce a coefficient of variation (CoV). Values for Nkt and Nb for peats were based on DSS tests for two sites in the Netherlands: Vinkeveen and Bodegraven (see [30]). The values in Table 6 fit in the range given by [30], except for the Nkt found for the Bodegraven site.
The smaller CoV in Table 6 for Nb by comparison with Nkt could be caused by the larger ball diameter with respect to the cone dimension, which results in more averaging of local heterogeneity. This is visualised by the stronger peaks found in the CPTu data with respect to the ball penetrometer data in Figure 20.
Figure 16c shows the uncorrected su values. In general engineering practice, the undrained shear strength from field vane tests, sufv, is corrected for shearing rate, anisotropy, vane stress non-uniformity and other effects [35]. A correction factor of µ = 0.5 is applied [8,9]. Comparing the sufv with suD and full-scale test results shows a good match when µ = 0.5 is used (see Figure 20).
Figure 20a shows the results of the field probe measurements made before the construction of field test 6. The undrained shear strength values were derived using Eq 7 and the cone factors were obtained from the test results in Table 6. Test 6 included a six-month pre-loading period with three rows of ten concrete slabs placed at the test site. During the consolidation period, field probe testing was conducted to study the strength increase. A good match was found between the CPTu, ball penetrometer and FVT results. Figure 20b shows the results of some typical field probe tests at the end of the consolidation period before Test 6 took place. Once again, a good match was found between the different measurement techniques. The CPTu readings show that compaction was mainly located in the peat layer. The settlement of 1.5 m obtained during the pre-loading period represents approximately 35% vertical strain in the peat layer below the pre-loading. There was minor compaction in the organic clay below the peat layer. The field probe tests clearly show an increase in strength in the peat layer during consolidation. Figure 21a shows an initial undrained shear su of approximately 5 kN/m2, while Figure 21b shows undrained shear strength values at the end of the consolidation period in the range of 10–12 kN/m2. The efficiency of the pre-loading in terms of strength gain can be stated as the improvement ratio, the ratio between the undrained shear strength after pre-loading and initial undrained shear strength. The improvement ratio for undrained shear strength in the peat layer is in the range 2 to 3.
It should be noted that only limited improvement was found in the organic clay layer between NAP −5.5 m and NAP −6.8 m. The relatively small strength increase in the organic clay layer corresponds to the low level of compaction of this layer during pre-loading.
After the completion of Test 6 and the removal of the test set-up, CPTu, ball penetrometer and FVT tests were conducted again. Figure 21 shows the successive results of field probe testing during and after the pre-loading period. Figure 21a compares the CPTu results with the field vane results, while Figure 21b compares the ball penetrometer test results with the field vane results. The pre-load, 33.6 kN/m2 in total, was in place from 10 July 2012 to 4 September 2012. Field probe testing was conducted on 12 November 2012 and at the end of the pre-loading period on 16 January 2013. Although there was settlement during that period, as shown by the lowering of the ground level found in the CPTu measurement in Figure 20a, the differences in suCPTu and sufv between these two measurements are small.
The removal of the test set-up of Test 6 led to a considerable load reduction. Nevertheless, the undrained shear strength found by the different field probe tests was unchanged with respect to the measurements at the end of the pre-loading period.
A test field was set up to establish the operational undrained shear strength for peat. The test programme consisted of six full-scale field trials and an extensive laboratory and field probe testing programme. This paper summarises the analysis of the test results presented in earlier papers [3,4,5] and further elaborates a comparison with the data presented in the literature. As can be expected for peat in general, there is a considerable margin of uncertainty in the individual results from the different tests. That uncertainty manifests itself in the scatter in the test results, as indicated by the coefficient of variation found for the different parameters. Specifically for CPTu, it should be noted that the tolerated accuracy is in the same order of magnitude as the mean value for the readings. Establishing the soil response (drained, undrained or partially undrained) during the penetration of the different probes is complex. Field vane tests produced useful results for this particular test site. It should be noted that the literature includes a range of points of view with respect to the applicability of the field vane tests in peat layers. It can be assumed that fibrosity and the botanical background of the fibres play a role in the successful use of a field vane in organic layers. A further discussion of the applicability of the field vane is beyond the scope of this study.
In laboratory testing, size effects add to the uncertainty in parameter assessments for peat. In the triaxial testing of peat using conventional size, a diameter of 65 mm, failure of the sample is rarely found. By contrast, clear failure planes are seen in large samples with a diameter of 400 mm. The difference in behaviour between conventional and large samples can be explained by the presence of a fibre matrix. A specific displacement is required to cause the rupture or sliding of the fibres that is not reached in triaxial testing on samples of a conventional size.
Despite the difficulties encountered in the analysis of the individual tests, combining the results of the different field probe and laboratory test produced a good match with the operational undrained shear strength derived from the field trials. This is illustrated by a comparison of the results of the field trials presented in Table 3 and the CPTu data given in Figure 16. Figure 16 shows the qnet value in the order of 0.1–0.15 MPa. With Nkt from Table 6, it follows that su = 5.6 to 8.4 kPa. This value is in good agreement with the 7.3–7.4 kN/m2 presented in Table 3. In addition, the uncorrected field vane tests yield approximately 15 kPa. With the correction factor µ = 0.5, it follows that su = 7.5 kPa. This corresponds well with the results of the field trials and CPTu data, showing that, when working with peats, cross-checks and combinations of different testing techniques are important to understand peat behaviour.
Although a good match was found between the operational undrained shear strength from laboratory testing and field probe testing on the one hand and the numerical analysis of the field trials on the other, the prediction of the failure plane shape and corresponding displacements were less successful. The observed failure planes consisted of steep, nearly vertical, rupture planes and horizontal displacements. The slip planes found by numerical analysis were cylindrical planes. The observed rupture planes in the field seem to coincide well with the rupture planes found in the large triaxial tests. An improved understanding of the behaviour of peats will require constitutive models that can deal with rupture of the fibres.
The authors wish to thank the Dutch Ministry of Public Works (Rijkswaterstaat-WVL) and the HHNK Water Authority for taking the initiative and financing the full-scale field tests. Thanks are also due to colleagues at Deltares for helping to run tests and analyse the data.
All authors declare no conflicts of interest in this paper.
[1] | CBS (2019) Available from: www.cbs.nl/nl-nl/visualisaties/bevolkingsteller. |
[2] | Erkens G, Van den Berg M, Griffioen J (2011) Veen en Geo-informatievoorziening door TNO-Overzicht van het informatiegebruik en aanbevelingen voor verbetering van de informatievoorziening en-verzameling over veen in de ondergrond. TNO-rapport, TNO-060-UT-2011-01127 A, 54. |
[3] |
Zwanenburg C, Jardine RJ (2015) Laboratory, in situ and full-scale load tests to assess flood embankment stability on peat. Géotechnique 65: 309-326. doi: 10.1680/geot.14.P.257
![]() |
[4] | Zwanenburg C, Van MA (2013) Full scale field tests for strength assessment of peat. In Proceedings of the 18th International Conference on Soil Mechanics and Geotechnical Engineering, Paris. |
[5] | Zwanenburg C, Van MA (2015) Comparison between conventional and large scale triaxial tests on peat. In Manzanal D, Sfriso AO, eds, 15th Pan American Conference on Soil Mechanics and Geotechnical engineering, Buenos Aires, IOS Amsterdam. |
[6] | Begemann HKS (1971) Soil sampler for taking undisturbed sample 66mm in diameter and with a maximum length of 17 m. In Proceedings 4th Asian ISSMFE conference specialty session quality in soil sampling, Bangkok, 54-57. |
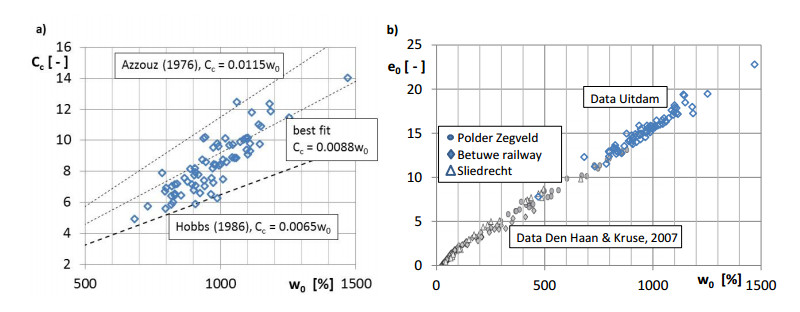
[7] | Den Haan EJ, Kruse GAM (2007) Characterisation and engineering properties of Dutch peats. In Second international workshop on characterisation and engineering of natural soils Singapore, London Taylor & Francis, 3: 2101-2133. |
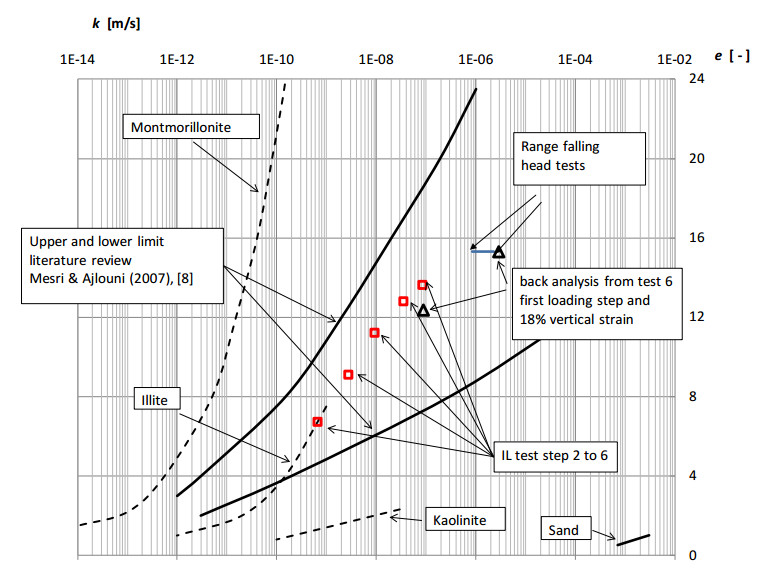
[8] | Mesri G, Ajlouni M (2007) Engineering properties of fibrous peats. J Geotech Geoenviron Eng 133: 850-866. |
[9] | Edil TB (2001) Site Characterization in Peat and Organic Soils. Proceedings of International Conference on In Situ Measurement of Soil Properties and Case Histories, Bali, 49-59. |
[10] | Helenelund KV (1967) Vane tests and tension tests on fibrous peats. In Proceedings of the Geotechnical Conference on Shear Strength Properties of Natural Soils and Rocks, Oslo Norway, Balkema, Rotterdam, the Netherlands, 19-22. |
[11] | Landva AO (2007) Characterization of Escuminac peat and construction on peatland. In Tan TS, Phoon KK, Hight DW, et al. (eds), Characterisation and Engineering Properties of Natural Soils, Taylor& Fransic Group London. |
[12] | Boylan N, Long M (2014) Evaluation of peat strength for stability assessments. Geotech Eng 167: 421-430. |
[13] |
Hobbs NB (1986) Mire Morphology and the properties and behaviour of some British and foreign peats. Q J Eng Geol 19: 7-80. doi: 10.1144/GSL.QJEG.1986.019.01.02
![]() |
[14] | CROW (Centrum voor Regelgeving en Onderzoek Grond-, Water-, en Wegenbouw) (2015) standaard RAW bepalingen, proef 28 (in Dutch). |
[15] |
Skempton AW, Petley DJ (1970) Ignition loss and other properties of peats and clays from Avonmouth, King's Lynn and Cranberry Moss. Géotechnique 20: 343-356. doi: 10.1680/geot.1970.20.4.343
![]() |
[16] | Becker DE, Crooks JHA, Been K, et al. (1987) Work as a criterion for determining in situ and yield stress in clays. Can Geotech J 24: 549-564. |
[17] | Azzouz AMRS, Krizek RJ, Corotis RB (1976) Regression analysis of soil compressibility. Soils Found 16: 19-29. |
[18] | Casagrande A, Fadum RE (1940) Notes on soil testing for engineering purposes. Harvard Graduate School of Engineering, Soil Mechanics Series No 8, 74. |
[19] | ASTM D2435/D2435M-11 (2011) Standard Test Methods for One-Dimensional Consolidation Properties of Soils Using Incremental Loading, ASTM International West Conshohocken, USA. |
[20] | Taylor DW (1942) Research on consolidation of clays. Massachusetts Institute of Technology, department of civil engineering, serial no 82. |
[21] | Tavenas F, Jean P, Leblond JP, et al. (1983) The permeability of natural soft clays: part Ⅱ: permeability characteristics. Can Geotech J 20: 645-660. |
[22] | Yamaguchi H, Ohira Y, Kogure K, et al. (1985) Undrained chear characteristics of normally consolidated peat under triaxial compression. Soils Found 25: 1-18. |
[23] |
Zwanenburg C, Den Haan EJ, Kruse GAM, et al. (2012) Failure of a trial embankment on peat in Booneschans, the Netherlands. Géotechnique 62: 479-490. doi: 10.1680/geot.9.P.094
![]() |
[24] |
Hendry MT, Sharma JS, Martin CD, et al. (2012) Effect of fibre content and structure on anisotropic elastic stiffness and shear strength of peat. Can Geotech J 49: 403-415. doi: 10.1139/t2012-003
![]() |
[25] | O'Kelly BC (2017) Measurement, interpretation and recommended use of laboratory strength properties of fibrous peat. Geotech Res 4: 136-171. |
[26] |
Dyvik R, Lacasse S, Berre T, et al. (1987) Comparison of truly undrained and constant volume direct simple shear tests. Géotechnique 37: 3-10. doi: 10.1680/geot.1987.37.1.3
![]() |
[27] | Ladd CC, Foot R (1974) New design procedure for stability of soft clays. J Geotech Eng Div 100: 763-786. |
[28] | Zwanenburg C (2017) The development of a large diameter sampler. In Proceedings of the 19th International Conference on Soil Mechanics and Geotechnical Engineering, Seoul. |
[29] | Lunne T, Robertson PK, Powell JJM (1997) Cone Penetration Testing in geotechnical practice, Blackie Academic & Professional London. |
[30] | Boylan N, Long M, Mathijssen F (2011) In situ strength characterisation of peat and organic soil using full-flow penetrometers. Can Geotech J 48: 1085-1099. |
[31] | NEN (2013) NEN EN-ISO 22476-1:2012, IDT Geotechnical investigation and testing-Field testing-Part1: electrical cone and piezocone penetration test. Delft, the Netherlands, NEN. |
[32] | Boylan N, Mathijssen F, Long M, et al. (2008) Accuracy of piezocone testing in organic soils. In Proceedings of the 11th Baltic Sea Geotechnical Conference, Gdansk Poland, 1: 367-375. |
[33] | Schneider JA, Randolph MF, Mayne PW, et al. (2008) Analysis of factors influencing soil classification using normalized piezocone tip resistance and pore pressure parameters. J Geotech Geoenviron Eng 134: 1569-1586. |
[34] | Morris PH, Williams DJ (2000) A revision of Blight's model of field vane testing. Can Geotech J 37: 1089-1098. |
[35] | Bjerrum L (1973) Problems of soil mechanics and construction on soft clays and structurally unstable soils (collapsible, expansive and others). Proc. 8th ICSMFE, Moscow, 3: 111-159. |
1. | Jean-Sebastien L’Heureux, Tom Lunne, Characterization and Engineering properties of Natural Soils used for Geotesting, 2020, 6, 2471-2132, 35, 10.3934/geosci.2020004 | |
2. | Andrew Trafford, Michael Long, Relationship between Shear-Wave Velocity and Undrained Shear Strength of Peat, 2020, 146, 1090-0241, 04020057, 10.1061/(ASCE)GT.1943-5606.0002298 | |
3. | P Paniagua, M Long, J-S L’Heureux, Geotechnical characterization of Norwegian peat: database, 2021, 710, 1755-1307, 012016, 10.1088/1755-1315/710/1/012016 | |
4. | Saber Elsayed, Hocine Oumeraci, Nils Goseberg, Effects of soil properties on erosion and breaching of natural coastal barriers under extreme storm surges, 2024, 2641-7286, 39, 10.34237/1009245 |
type of test | number |
CPTu, 10 cm2 cone | 36 |
CPTu, 15 cm2 cone calibrated for low stress levels | 26 |
ball penetrometer D = 80 mm | 10 |
ball penetrometer D = 78 mm | 16 |
CPTu, with u1, u2 and u3 measurements | 5 |
CPT, with temperature measurement | 4 |
Field vane test | 77* |
Begemann, continuous sampling | 15 |
Block samples | 30 |
*= six depth profiles from 12 measurements prior to testing, two depth profiles from 2 and 3 measurements after the completion of field trial 6. |
test type | number | |
Triaxial tests | isotropically consolidated undrained compression tests, CIUC | 23 |
anisotropically consolidated undrained compression tests, CAUC | 23 | |
isotropically consolidated undrained extension tests, CIUE | 6 | |
consolidated anisotropically undrained extension tests, CAUE | 8 | |
Direct Simple Shear tests, DSS | 51 | |
Constant Rate of Strain tests, CRS | 12 | |
Incremental loading tests, IL | 98 |
Test number | pre-load [kN/m2] | duration pre-loading [days] | total loada [kN/m2] | su [kPa] | Comments |
Test 1 | - | - | 25 | 7.4 | Test 1 and 2 designed to derive the actual operational undrained shear strength |
Test 2 | - | - | 23.5 | 7.3 | |
Test 4 | 23.5 | 74f | 40.9/58.1 | 13.2b | Test 4 and 5 designed to study the strength increase due to a small pre-loading, e.g. a stability berm |
Test 5 | 23.5 | 62g | 41.5 | 8.5c | |
Test 6 | 33.6 | 160h | 78.6 | 5.5d | Test 6 designed to study the effect of higher pre-loading, e.g. below dike body |
12.6e | |||||
a The total load includes the pre-load mentioned in the second column. b Computed failure mechanism did not capture the sliding and toppling of the containers. The given su value refers to the single container for which subsoil failure was found. c Computed failure mechanism did not capture the sliding and toppling of containers. d assumed beyond the area influenced by pre-loading. e assessed in the region below pre-loading. f pre-load applied for a period of 22 days. g pre-load applied for a period of 35 days. h pre-load applied for a period of 56 days. |
µqc, µqb | CoVqc, CoVqb | n | ||
CPTu | 10 cm2 | 0.14 | 0.21 | 30 |
15 cm2 | 0.12 | 0.17 | 15 | |
ball | D = 80 mm (50 cm2) | 0.11 | 0.17 | 10 |
D = 78 mm (48 cm2) | 0.13 | 0.11 | 5 |
probe | D [m ] | V [-] | |
cv = 100 m2/y (3.2 × 10⁻⁶ m2/s) | cv = 300 m2/y (9.5 × 10⁻⁶ m2/s) | ||
cone, 10 cm2 | 0.0357 | 169 | 56 |
cone, 15 cm2 | 0.0437 | 206 | 69 |
ball | 0.08 | 378 | 126 |
factor | Field trials | DSS |
Nkt | 15.3 (± 30%a) | 17.5 (CoV = 12.6b) |
Nb | 16.5 (± 20%a) | 17.9 (CoV = 6.3b) |
a based on variations in qc and qball respectively b based on statistical analysis |