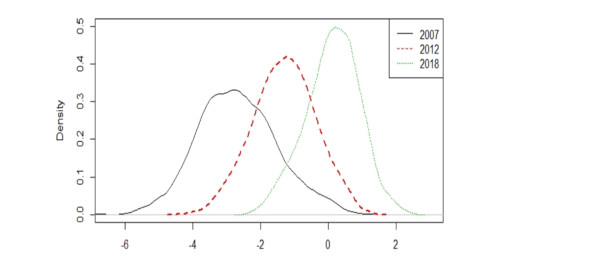
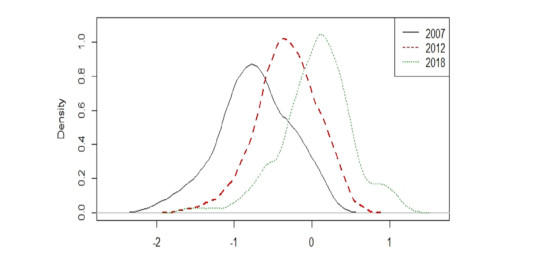
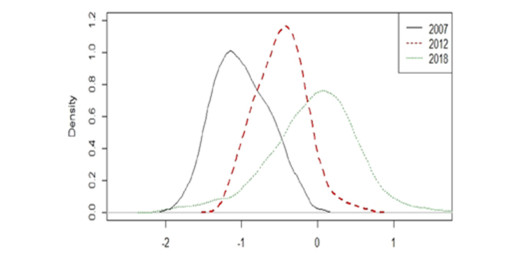
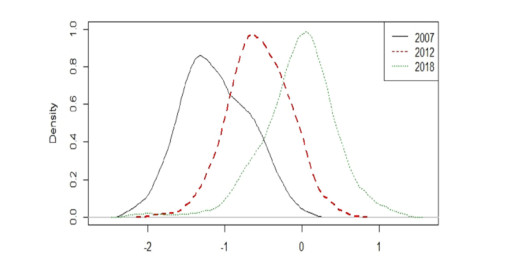
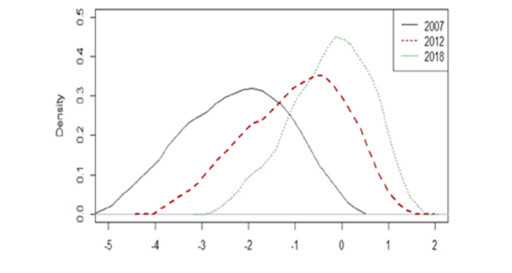
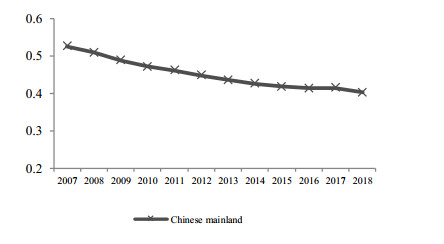
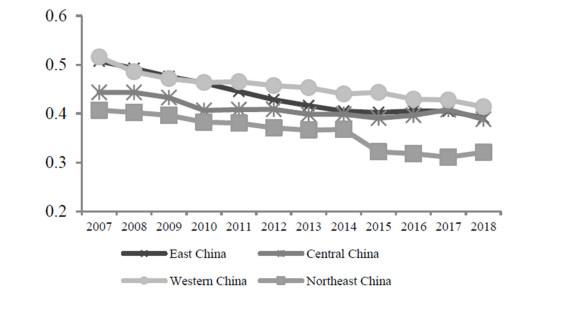
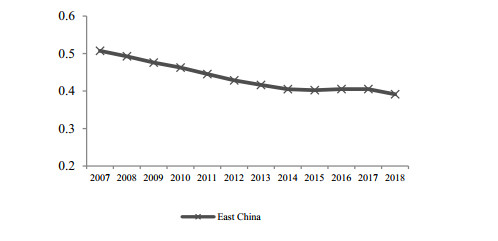
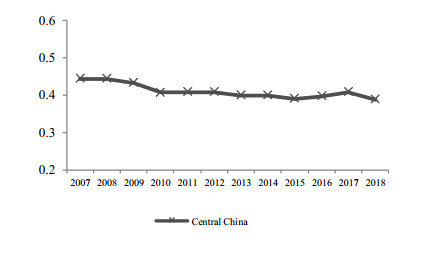
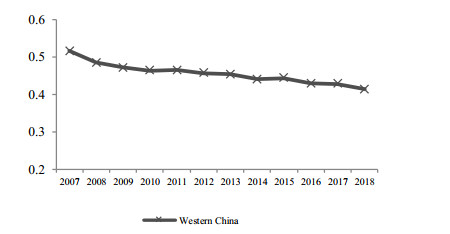
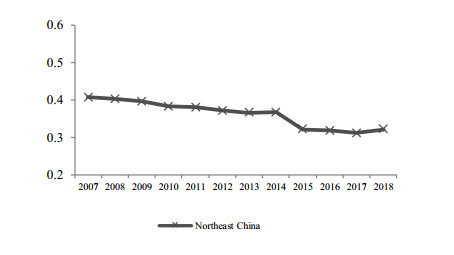
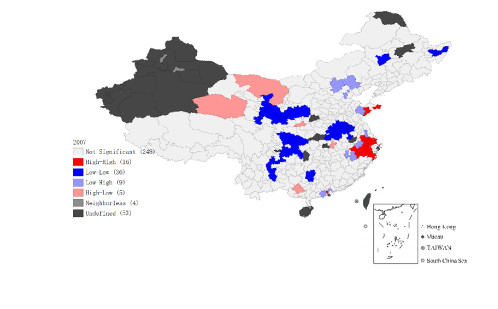
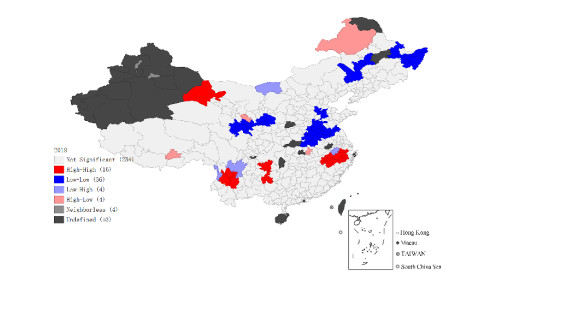
In this paper, taking the per capita tourism revenue of the administrative units of Chinese mainland from 2007 to 2018 as an indicator, we analyze the unbalanced regional tourism growth in Chinese mainland and its trends by using kernel density estimation (KDE), the Gini index, and exploratory spatial data analysis (ESDA). The results demonstrate that (1) the distribution of regional tourism data in Chinese mainland and its four economic regions tends to converge, and the relative difference in tourism development among cities is slowly decreasing. (2) The differences in regional tourism development within the four economic regions in China are different, and each part shows its own degree of decline, with the gap in regional tourism development in Western China being the largest, and that in regional tourism growth in Northeast China the smallest. The difference in regional tourism development in both East and Northeast China decreased significantly and that in Central China decreased the least. (3) Finally, the difference in regional tourism development is dominated by a positive spatial correlation. The range of high-high types has expanded, and low-high and high-low types have decreased.
Citation: Yuyi Huang, Qian Guo, Manxiang Xiao. The unbalanced development and trends of China's regional tourism[J]. National Accounting Review, 2021, 3(1): 69-85. doi: 10.3934/NAR.2021003
In this paper, taking the per capita tourism revenue of the administrative units of Chinese mainland from 2007 to 2018 as an indicator, we analyze the unbalanced regional tourism growth in Chinese mainland and its trends by using kernel density estimation (KDE), the Gini index, and exploratory spatial data analysis (ESDA). The results demonstrate that (1) the distribution of regional tourism data in Chinese mainland and its four economic regions tends to converge, and the relative difference in tourism development among cities is slowly decreasing. (2) The differences in regional tourism development within the four economic regions in China are different, and each part shows its own degree of decline, with the gap in regional tourism development in Western China being the largest, and that in regional tourism growth in Northeast China the smallest. The difference in regional tourism development in both East and Northeast China decreased significantly and that in Central China decreased the least. (3) Finally, the difference in regional tourism development is dominated by a positive spatial correlation. The range of high-high types has expanded, and low-high and high-low types have decreased.

| [1] | Feng CC, Zeng ZR, Cui NN (2015) The temporal and spatial evolution of China's regional economic differences since 2000. Geogr Res 34: 234-246. [Article in Chinese]. |
| [2] | Han BN, Zhang JJ (2014) A review of foreign regional tourism differences. Human Geogr 29: 21-28. [Article in Chinese]. |
| [3] | Liu J, Wang J, Xi YD (2016) The evolution of the spatial pattern of China's tourism economic growth quality. Bus Manage J 38: 160-173. [Article in Chinese]. |
| [4] | Li RY, Huang CZ (2015) The evolution pattern and driving mechanism of the center of the tourism economy in Jiangsu Province. Areal Res Dev 34: 93-99. [Article in Chinese]. |
| [5] | Lu L, Yu FL (2005) A study on the spatial characteristic of the provincial difference of tourism economy. Econ Geogr 25: 406-410. [Article in Chinese]. |
| [6] | Lu H, Ou XJ, Li X, et al. (2013) Space-time analysis of the regional economic inequality and polarization in China. Econ Geogr 33: 15-21. [Article in Chinese]. |
| [7] | Luo ZS, Lin BS (2015) Research on the evolution characteristics and convergence of the tourism economy in Henan Province. J Arid Land Resour Environ 29: 197-202. [Article in Chinese]. |
| [8] | Lv Z (2019) Deepening or lessening? The effects of tourism on regional inequality. Tourism Manage 72: 23-26. |
| [9] | Ma LJ, Zhang JF (2020) The impact of regional tourism development spatial differences on the balance of economic development. Econ Geogr 40: 197-203. [Article in Chinese]. |
| [10] | Niu SH, Yang MY (2020) China's regional economic gap changes and policy adjustment suggestions. Reg Econ Rev, 37-43. [Article in Chinese]. |
| [11] | Ou XJ, Gu CL (2004) Quantitative analysis of regional economic polarization and dynamical mechanisms in Jiangsu Province. Acta Geogr Sinica 59: 791-799. [Article in Chinese]. |
| [12] |
Pearce DG (1987) Mediterranean charters—a comparative geographic perspective. Tourism Manage 8: 291-305. doi: 10.1016/0261-5177(87)90087-2

|
| [13] |
Rozelle S (1994) Rural industrialization and increasing inequality: Emerging patterns in China's reforming economy. J Comp Econ 19: 362-391. doi: 10.1006/jcec.1994.1108
|
| [14] |
Sarrión-Gavilán MD, Benítez-Márquez MD, Mora-Rangel EO (2015) Spatial distribution of tourism supply in Andalusia. Tourism Manage Perspect 15: 29-45. doi: 10.1016/j.tmp.2015.03.008
|
| [15] |
Tosun C, Timothy DJ, Öztürk Y (2003) Tourism growth, national development and regional inequality in Turkey. J Sust Tourism 11: 133-161. doi: 10.1080/09669580308667200
|
| [16] | Wang QA, Ma YF, Wang LF (2008) A discussion on the new trend of my country's tourism development in the early 21st century. Soc Sci, 92-94, 98. [Article in Chinese]. |
| [17] | Wang QY, Huang YY (2014) Dynamic analysis of China's urban tourism competitiveness. Inquiry Into Econ Issues, 167-172. [Article in Chinese]. |
| [18] | Wang SX, Wang XD, Xu JW (2013) Research on the spatial change trend and influencing factors of the tourism economy in the western region. Tourism Sci 26: 55-67. [Article in Chinese]. |
| [19] | Wang DG, Chen T (2011) A spatial analysis of regional differences in China's tourism economy. Scientia Geogr Sinica 3: 528-536. [Article in Chinese]. |
| [20] |
Wang S, He Y, Wang X, et al. (2011) Regional disparity and convergence of China's inbound tourism economy. Chinese Geogr Sci 21: 715-722. doi: 10.1007/s11769-011-0500-2
|
| [21] | Xie WY, Duan HB (2013) Research on my country's Current Holiday System. J Sichuan Normal Univ 40: 49-57. [Article in Chinese]. |
| [22] |
Yang Y (2012) Agglomeration density and tourism development in China: An empirical research based on dynamic panel data model. Tourism Manage 33: 1347-1359. doi: 10.1016/j.tourman.2011.12.018
|
| [23] | Zhao YH, Xiu CL, Jiang B, et al. (2010) Polarization development of three urban groups in Northeast China since 1990. Econ Geogr 30: 738-743. [Article in Chinese]. |
| [24] | Zhu JJ, Ding DS, Han NS (2001) An analysis of the Regional Imbalance of China's Tourism. Human Geogr, 27-30. [Article in Chinese]. |
Figures(13)

Yuyi Huang, Qian Guo, Manxiang Xiao. The unbalanced development and trends of China's regional tourism[J]. National Accounting Review, 2021, 3(1): 69-85. doi: 10.3934/NAR.2021003


 DownLoad: