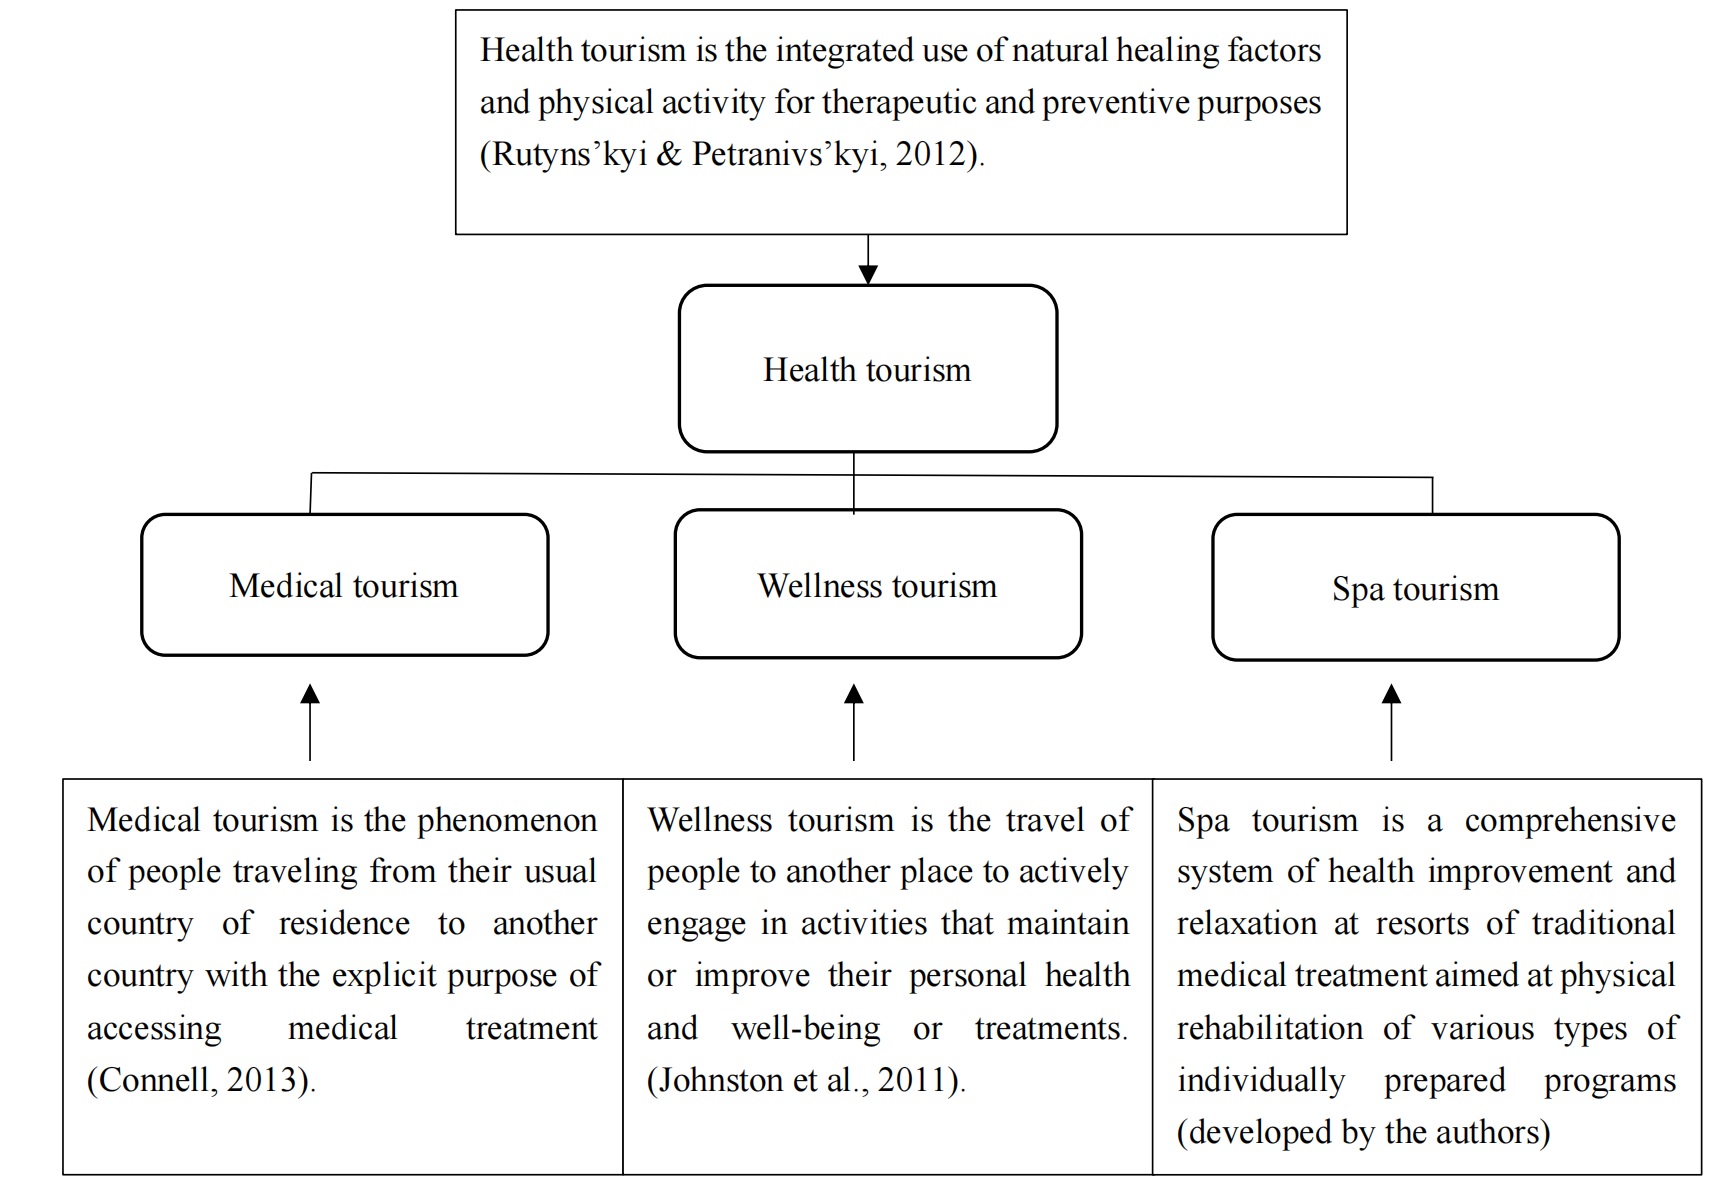
The purpose of the article is to substantiate the directions of health tourism development in Czechia. The purpose of the study is the subjects of health tourism: well-known rehabilitation centers in Czechia, medical institutions, health resorts. The methodological basis was formed by the following methods: abstract-logical; statistical; expert evaluation; cluster analysis; piecewise linear approximation. Among the most popular regions of Czechia for health tourism, the main places are Prague, Moravian-Silesia, Olomouc, Plzeň, South Moravian and South Bohemian. The increase in the number of patients among residents of the country and foreigners who use health tourism services is studied. The five leaders among the countries that used the services are identified. The main problems and advantages of health tourism in Czechia are identified. The Czech tourism development strategy for 2021–2030 is analyzed and directions for its implementation are proposed. Originality / value: the originality of the study lies in forecasting the directions of health tourism development in Czechia using the method of piecewise linear approximation in the following areas: adults with health insurance; adults at their own expense, children and teenagers, which will increase the volume of income for health tourism institutions in Czechia. According to the forecasting results, the demand for health services will increase by 3% annually. The results of this study can be useful for substantiating the directions of further health tourism development in the country, which will ensure the competitiveness and investment attractiveness of the country.
Citation: Tetiana But, Libor Lnenicka, Tetiana Pulina. Substantiating the directions of health tourism development in Czechia[J]. National Accounting Review, 2024, 6(1): 50-74. doi: 10.3934/NAR.2024003
The purpose of the article is to substantiate the directions of health tourism development in Czechia. The purpose of the study is the subjects of health tourism: well-known rehabilitation centers in Czechia, medical institutions, health resorts. The methodological basis was formed by the following methods: abstract-logical; statistical; expert evaluation; cluster analysis; piecewise linear approximation. Among the most popular regions of Czechia for health tourism, the main places are Prague, Moravian-Silesia, Olomouc, Plzeň, South Moravian and South Bohemian. The increase in the number of patients among residents of the country and foreigners who use health tourism services is studied. The five leaders among the countries that used the services are identified. The main problems and advantages of health tourism in Czechia are identified. The Czech tourism development strategy for 2021–2030 is analyzed and directions for its implementation are proposed. Originality / value: the originality of the study lies in forecasting the directions of health tourism development in Czechia using the method of piecewise linear approximation in the following areas: adults with health insurance; adults at their own expense, children and teenagers, which will increase the volume of income for health tourism institutions in Czechia. According to the forecasting results, the demand for health services will increase by 3% annually. The results of this study can be useful for substantiating the directions of further health tourism development in the country, which will ensure the competitiveness and investment attractiveness of the country.

| [1] |
AgalarovA LS, Rozanova TP, Stytsiuk RY, et al. (2023) The problems of development of medical health-improving tourism in modern conditions. Problems of Social Hygiene, Public Health and History of Medicine 31: 44–50. https://doi.org/10.32687/0869-866X-2023-31-1-44-50 doi: 10.32687/0869-866X-2023-31-1-44-50

|
| [2] | Attl P (2014) Czech spas economy and tourism. Economic Development and Management of Regions, 26–32. |
| [3] |
Becková H, Kantorová K (2021) Wellness as a cure for the problems of Czech spas? Int J Spa Wellness 4: 36–52. https://doi.org/10.1080/24721735.2021.1908077 doi: 10.1080/24721735.2021.1908077
|
| [4] |
Braçe O, Garrido-cumbrera M, García-marín R (2023) Approaches to health tourism from the geography. Definition and study field. Cuadernos de Turismo 51: 429–432. https://doi.org/10.6018/turismo.571521 doi: 10.6018/turismo.571521
|
| [5] | Brandys nad Orlicí Rehabilitation Institute (2023) Available from: https://www.rehabilitacniustav.cz/. |
| [6] |
Boleloucka E, Wright A (2020) Spa destinations in the Czech Republic: An empirical evaluation. Int J Spa Wellness 3: 117–144. https://doi.org/10.1080/24721735.2021.1880741 doi: 10.1080/24721735.2021.1880741
|
| [7] |
Borzyszkowski J, Lubowiecki-Vikuk A (2019) Destination management organizations and health tourism visual identification in Central and Eastern Europe. Eur Res Stud J 22: 241–261. https://doi.org/10.35808/ersj/1508 doi: 10.35808/ersj/1508
|
| [8] |
Derco J, Pavlisinova D (2017) Financial position of medical spas—the case of Slovakia. Tour Econ 23: 867–873. https://doi.org/10.5367/te.2016.0553 doi: 10.5367/te.2016.0553
|
| [9] | Carneiro MJ, Eusébio C (2012) Segmentation of the tourism market using the impact of tourism on quality of life. Tour Manag Stud 7: 91–100. |
| [10] |
Chen CC, Petrick JF, Shahvali M (2016) Tourism experiences as a stress reliever: Examining the effects of tourism recovery experiences on life satisfaction. J Travel Res 55: 150–160. https://doi.org/10.1177/0047287514546223 doi: 10.1177/0047287514546223
|
| [11] | CSU (2022) Czech Statistical Government. Available from: https://www.czso.cz/csu/czso/domov. |
| [12] | Čabinová V, Onuferová E (2019) Efficiency and financial performance evaluation of the medical Spa sector: An empirical study from Slovakia. Calitatea 20: 62–68. |
| [13] |
Derco J, Romaniuk P, Cehlar M (2020) Economic Impact of the Health Insurance System on Slovak Medical Spas and Mineral Spring Spas. Sustainability 12: 3384. https://doi.org/10.3390/su12083384 doi: 10.3390/su12083384
|
| [14] | Gastrocentrum Karlovy Vary (2023) Available from: https://www.gastrokv.cz/cz/. |
| [15] | Goncharov OA, Vasiyeva LV, Junda AM (2020) Numerical methods for solving applied problems. training manual. Sumу: Sumy State University. |
| [16] | Hospital in the Czech Republic (2023) Hospitals in the Czech republichospitals in the Czech republicczech hospitals divided by Regions, Cities and doctors. Available from: http://www.nasenemocnice.cz/nemocnice-jihocesky-kraj. |
| [17] |
Jónás-Berki M, Csapó J, Pálfi A, et al. (2015) A market and spatial perspective of health tourism destinations: The Hungarian experience. Int J Tour Res 17: 602–612. https://doi.org/10.1002/jtr.2027 doi: 10.1002/jtr.2027
|
| [18] | IHISCR (2020) National health information system-outpatient care. Health care in the Czech Republic: a brief overview of the activities of the field general practitioner for children and adolescents for the period 2007–2020. Available from: https://www.uzis.cz/res/f/008393/nzis-rep-2021-k18-a041-prakticky-lekar-pro-deti-a-dorost-2020.pdf. |
| [19] | IHISCR (2023) Institute of Health Information and Statistics of the Czech Republic. Statistics of health services. Available from: https://www.uzis.cz/index.php?pg = vystupy--statistika-zdravotnich-sluzeb. |
| [20] | IHISCR (2023) Relevant information to the Charter of Health Information and statistics of the Czech Republic. Available from: https://www.uzis.cz/res/f/008418/ai-2022-02-cizinci-2021.pdf. |
| [21] | Kadan Hospital (2023) Available from: https://www.nemkadan.cz/ |
| [22] |
Kimes SE, Singh S (2009) Spa Revenue Management. Cornell Hosp Q 50: 82–95. https://doi.org/10.1177/1938965508324868 doi: 10.1177/1938965508324868
|
| [23] | Rehabilitation Institute Kladruby (2023) Available from: https://www.rehabilitace.cz/. |
| [24] |
Kočanová D, Kováč V, Serzhanov V, et al. (2023) Differences and Similarities in Patterns of 12. Ageing Society in the European Union. Econ Manage 26: 45–64. https://doi.org/10.15240/tul/001/2023-1-003 doi: 10.15240/tul/001/2023-1-003
|
| [25] |
Kolaee MH, Mirzapour Al-e-hashem SMJ, Jabbarzadeh A (2023) A local search-based non-dominated sorting genetic algorithm for solving a multi-objective medical tourism trip design problem considering the attractiveness of trips. Eng Appl Artif Intell 124. https://doi.org/10.1016/j.engappai.2023.106630 doi: 10.1016/j.engappai.2023.106630
|
| [26] | Kotikova H, Schwartzhoffova E (2013) Health and spa tourism in the Czech and Slovak Republics, In: Hall, C.M. (Ed.), Medical tourism: The ethics, regulation, and marketing of health mobility, Routledge, 109–122. |
| [27] | Kraftova I, Mandysova I, Matěja Z (2013) Specifics of the Czech spa industry and categorization model of spa towns. Scientific Papers of the University of Pardubice 28: 43–54. |
| [28] | Kraftová I, Masuyama Y, Matěja Z, et al. (2011) Social responsibility in the spa industry: similarities or differences? (comparative study of the Czech and Japanese Environment). Available from: http://www.ekonomie-management.cz/download/1346064235_132b/2011_02_kraftova_masuyama_mateja_kornfeldova.pdf. |
| [29] | Kudlacek M, Blankova B, Filipcic T (2007) Indicators of attitudes toward inclusion of students with physical disabilities in pe in the "atipdpe – sl" instrument for prospective Slovene physical educators and general educators. Kinelogia Slovenica 13: 43–51. |
| [30] | Lubowiecki-Vikuk A, Borzyszkowski J, Marczak M (2023) Marketing of tourism ecosystem services in times of uncertainty: Lessons from a health tourism destination in Poland, In: Gowreesunkar, V.G., Maingi, S.W., Ming'ate, F.L.M. (Eds.), Management of Tourism Ecosystem Services in a Post Pandemic Context: Global Perspectives, London: Routledge, 301–319. |
| [31] | Lubowiecki-Vikuk A, Dryglas D (2019) Medical tourism services and medical tourism destinations in Central and Eastern Europe – the opinion of Britons and Germans. Econ Res-Ekon Istraz 32: 1256–1274. https://dx.doi.org/10.1080/1331677X.2019.1627892 |
| [32] |
Lubowiecki-Vikuk A, Kurkowiak J (2017) Medical Tourism Potential of Central and Eastern Europe: Attempt at Classification. CBU Int Conf Proc 5: 286–293. https://doi.org/10.12955/cbup.v5.940 doi: 10.12955/cbup.v5.940
|
| [33] |
Lončarić D, Perišić PM, Bagarić L (2018) The Relationship Between Tourism Experience Co-Creation, Life Satisfaction and Behavioural Intentions. Cent Eur Bus Rev 7. https://doi.org/10.18267/j.cebr.203 doi: 10.18267/j.cebr.203
|
| [34] | Metylovice (2023) Specialist treatment institute Metylovice. Available from: https://www.olum.cz/. |
| [35] | Migrant.Biz.Ua. (2023) Features of treatment and rehabilitation in the Czech Republic. Available from: https://migrant.biz.ua/chexiya/medicina-cz/likuvannia-ta-reabilitatsiia.html. |
| [36] |
Moon SB (2019) Scientific Background of Physical and Rehabilitation Medicine: Rehabilitation Sciences. J Int Soc Phys Rehabil Med 2: 125–129. https://doi.org/10.4103/jisprm.jisprm_29_19 doi: 10.4103/jisprm.jisprm_29_19
|
| [37] | MRDCR (2023) Ministry for Regional Development of the Czech Republic, all rights reserved. Tourism development strategy of the Czech Republic 2021–2030. Available from: https://mmr.cz/cs/ministerstvo/cestovni-ruch/archiv/koncepce-strategie/strategie-rozvoje-cestovniho-ruchu-cr-2021-2030. |
| [38] | Nitera-Kowalik A, Olszewska E, Smyda A (2016) Spa Resort Treatment As a Method of Preventing Negative Consequences of Aging. Acta Balneol 58: 110–117. |
| [39] |
Patterson I, Balderas-Cejudo A (2023) Tourism towards healthy lives and well-being for older adults and senior citizens: tourism agenda 2030. Tour Rev 78: 427–442. https://doi.org/10.1108/TR-06-2022-0269 doi: 10.1108/TR-06-2022-0269
|
| [40] | Písek Hospital (2023) Available from: https://www.nemopisek.cz/aktuality/. |
| [41] | Rogerson CM, Rogerson JM (2023) The Historical Development of South African Small Towns as Spa Resorts, In: Donaldson, R. (eds), Socio-Spatial Small Town Dynamics in South Africa, Geo Journal Library, 225–242. https://doi.org/10.1007/978-3-031-37142-4_10 |
| [42] | Rutyns'kyi, Petranivs'kyi (2012) Health & spa tourism: current goals and modern approaches to the organization. Bulletin of Lviv University. International relations series 29. |
| [43] |
Schuh A (2009) Evidence of the Efficacy of Climatotherapy and Thalassotherapy A Review. Schweizerische zeitschrift fuer ganzheitsmedizin 21: 96–104. https://doi.org/10.1159/000287219 doi: 10.1159/000287219
|
| [44] | Sheludko G, Ugrimov S (2018) Modernization adaptive piecewise linear approximation of difficult-tocompute functions. J Mech Eng 21: 60–67. |
| [45] |
Sher SA, Albitskiy VY, Ustinova NV (2023) Sanatorium and resort recreation services for child population in ussr in post-wwii period (1946 to 1950). Pediatriya - Journal im G.N. Speranskogo 102: 219–225. https://doi.org/10.24110/0031-403X-2023-102-4-219-225 doi: 10.24110/0031-403X-2023-102-4-219-225
|
| [46] | The Mariánské Lázně Hospital (2023) Available from: https://neml.eu/. |
| [47] | Vyskov Hospital (2023) Available from: https://www.nemvy.cz/. |
| [48] |
Vystoupil J, Šauer M, Bobková M (2017) Spa, spa tourism and Wellness tourism in the czech republic. Czech J Tour 6: 5–26. https://doi.org/10.1515/cjot-2017–0001 doi: 10.1515/cjot-2017–0001
|
| [49] | Watchman of the State (2023) Large hospitals in the Czech Republic according to the K-Index for 2022. Available from: https://www.hlidacstatu.cz/kindex/zebricek/Velke_nemocnice. |
| [50] |
Zhang P, Wu L, Li R (2023) Development Drivers of Rural Summer Health Tourism for the Urban Elderly: A Demand- and Supply-Based Framework. Sustainability 15: 10686. https://doi.org/10.3390/su151310686 doi: 10.3390/su151310686
|


Figures(6) / Tables(11)

Tetiana But, Libor Lnenicka, Tetiana Pulina. Substantiating the directions of health tourism development in Czechia[J]. National Accounting Review, 2024, 6(1): 50-74. doi: 10.3934/NAR.2024003


 DownLoad: