This research aims to establish the determinants of firm performance in 15 non-financial Ghanaian companies listed on the Ghana Stock Exchange, over a period of 10 years (2008–2017). The analysis is based on two methods of estimation; two-step system generalized method of moments (GMM) and ordinary least square (OLS) method. The new empirical evidence derived from the results of the analysis reveals that firm size (SIZE), growth (GR) and cash flow ratio (CFR), significantly and positively determines firm's performance whereas debt to equity (DE) exerted negative influence on firm performance. Robustness test conducted using the three-stage least-squares regression, indicates similar results with the main findings of the study. These results imply that, firms that rely on debt to execute its operations run at a higher risk of insolvency.
Citation: Regina Naa Amua Dodoo, Michael Appiah, Daniel Tetteh Donkor. Examining the factors that influence firm performance in Ghana: a GMM and OLS approach[J]. National Accounting Review, 2020, 2(3): 309-323. doi: 10.3934/NAR.2020018
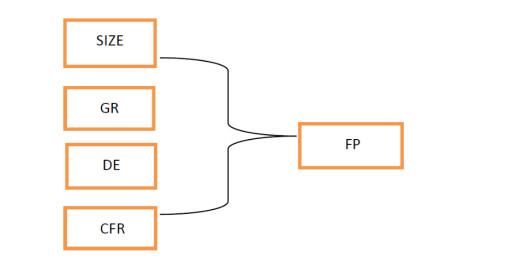
This research aims to establish the determinants of firm performance in 15 non-financial Ghanaian companies listed on the Ghana Stock Exchange, over a period of 10 years (2008–2017). The analysis is based on two methods of estimation; two-step system generalized method of moments (GMM) and ordinary least square (OLS) method. The new empirical evidence derived from the results of the analysis reveals that firm size (SIZE), growth (GR) and cash flow ratio (CFR), significantly and positively determines firm's performance whereas debt to equity (DE) exerted negative influence on firm performance. Robustness test conducted using the three-stage least-squares regression, indicates similar results with the main findings of the study. These results imply that, firms that rely on debt to execute its operations run at a higher risk of insolvency.

| [1] | Abata MA, Migiro SO (2016) Capital structure and firm performance in Nigerian-listed companies. J Econ Behav Stud 8: 54-74. |
| [2] | Adams M, Buckle M (2003) The determinants of corporate financial performance in the Bermuda insurance market. Appl Financ Econ 13: 133-143. |
| [3] | Akbar S, Poletti-Hughes J, El-Faitouri R, et al. (2016) More on the relationship between corporate governance and firm performance in the UK: Evidence from the application of generalized method of moments estimation. Res Int Bus Financ 38: 417-429. |
| [4] | Al-Jafari MK, Samman HA (2015) Determinants of profitability: evidence from industrial companies listed on Muscat Securities Market. Rev Eur Stud 7: 303. |
| [5] | Appiah M, Frowne DYI, Tetteh D (2020) Capital Market and Financial Development on Growth: A Panel ARDL Analysis. Indones Capital Mark Rev 12: 28-41. |
| [6] | Arellano M, Bover O (1995) Another look at the instrumental variable estimation of error-components models. J Econometrics 68: 29-51. |
| [7] | Asimakopoulos I, Samitas A, Papadogonas T (2009) Firm-specific and economy wide determinants of firm profitability: Greek evidence using panel data. Managerial Financ 35: 930-939. |
| [8] | Barney J (1991) Firm resources and sustained competitive advantage. J Manage 17: 99-120. |
| [9] | Berger AN, Di Patti EB (2006) Capital structure and firm performance: A new approach to testing agency theory and an application to the banking industry. J Bank Financ 30: 1065-1102. |
| [10] | Bhatia S, Srivastava A (2016) Working capital management and firm performance in emerging economies: evidence from India. Manage Labour Stud 41: 71-87. |
| [11] | Boadi EK, Antwi S, Lartey VC (2013) Determinants of profitability of insurance firms in Ghana. Int J Bus Social Res 3: 43-50. |
| [12] | Burja C (2011) Factors influencing the Companies' Profitability. Ann Univ Apulensis Ser Oecon 13: 215. |
| [13] | Chen Y, Ibhagui OW (2019) R & D-firm performance nexus: New evidence from NASDAQ listed firms. North Am J Econ Financ 50: 101009. |
| [14] | Claver E, Molina J, Tarí J (2002) Firm and Industry Effects on Firm Profitability: a Spanish Empirical Analysis. Eur Manage J 20: 321-328. |
| [15] | Coad A (2007) Firm growth: a survey. No. 2007-03. Available from: http://ideas.repec.org/p/mse/cesdoc/r07024.html. |
| [16] | Davidsson P, Steffens P, Fitzsimmons J (2009) Growing profitable or growing from profits: putting the horse in front of the cart? J Bus Ventur 24: 388-406. |
| [17] | Deepankar B (2020) Bias of OLS Estimators due to Exclusion of Relevant Variables and Inclusion of Irrelevant Variables. Oxford B Econ Stat 82: 209-234. |
| [18] | Delen D, Kuzey C, Uyar A (2013) Measuring firm performance using financial ratios: A decision tree approach. Expert Syst Appl 40: 3970-3983. |
| [19] | Deloof M (2003) Does working capital management affect profitability of Belgian firms? J Bus Financ Account 30: 573-588. |
| [20] | Dhawan R (2001) Firm size and productivity differential: theory and evidence from a panel of US firms. J Econ Behav Organ 44: 269-293. |
| [21] | Durnev A, Kim EH (2005) To steal or not to steal: Firm attributes, legal environment, and valuation. J Financ 60: 1461-1493. |
| [22] | Feeny S (2000) Determinants of profitability: an empirical investigation using Australian tax entities. Melbourne Institute of Applied Economic and Social Research, Working Paper, 1. |
| [23] | Fitzsimmons J, Steffens P, Douglas E (2005) Growth and profitability in small and medium sized Australian firms. Proceedings AGSE Entrepreneurship Exchange, Melbourne. |
| [24] | Frank MZ, Goyal VK (2003) Testing the pecking order theory of capital structure. J Financ Econ 67: 217-248. |
| [25] | Gitman LJ, Juchau R, Flanagan J (2015) Principles of managerial finance, USA: Addison Wesle: Pearson Higher Education AU. |
| [26] | Goddard J, Tavakoli M, Wilson JO (2005) Determinants of profitability in European manufacturing and services: evidence from a dynamic panel model. Appl Financ Econ 15: 1269-1282. |
| [27] | Gompers P, Ishii J, Metrick A (2003). Corporate governance and equity prices. Q J Econ 118: 107-156. |
| [28] | Grant RM (1991) The resource-based theory of competitive advantage: implications for strategy formulation. Calif Manage Rev 33: 114-135. |
| [29] | Henry D (2008) Corporate governance structure and the valuation of Australian firms: is there value in ticking the boxes? J Bus Financ Accounting 35: 912-942. |
| [30] | Ibhagui O (2019) Do Large Firms Benefit More from R & D Investment? Eur J Appl Econ 16: 155-173. |
| [31] | Ibhagui OW, Olokoyo FO (2018) Leverage and firm performance: New evidence on the role of firm size. North Am J Econ Financ 45: 57-82. |
| [32] | Jermias J (2008) The relative influence of competitive intensity and business strategy on the relationship between financial leverage and performance. Br Accounting Rev 40: 71-86. |
| [33] | Kaen FR, Baumann HD (2003) Firm size, employees and profitability in US manufacturing industries. Available at SSRN. |
| [34] | Lazăr S (2016) Determinants of firm performance: evidence from Romanian listed companies. Rev Econ Bus Stud 9: 53-69. |
| [35] | Makhija M (2003) Comparing the resource‐based and market‐based views of the firm: empirical evidence from Czech privatization. Strategic Manage J 24: 433-451. |
| [36] | Margaretha F, Supartika N (2016) Factors affecting profitability of small medium enterprises (SMEs) firm listed in Indonesia Stock Exchange. J Econ Bus Manage 4: 132-137. |
| [37] | Markman GD, Gartner WB (2002) Is extraordinary growth profitable? A study of Inc. 500 high-growth companies. Entrep Theory Pract 27: 65-75. |
| [38] | Mathuva D (2015) The Influence of working capital management components on corporate profitability. Res J Bus Manage 4: 1-11. |
| [39] | Nunes PJM, Serrasqueiro ZM, Sequeira TN (2009) Profitability in Portuguese service industries: a panel data approach. Serv Ind J 29: 693-707. |
| [40] | Obeng-Krampah DK (2018) The Impact of Macroeconomic Factors on Firm Performance. Department of Economics University of Ghana. |
| [41] | Odusanya IA, Yinusa OG, Ilo BM (2018) Determinants of firm profitability in Nigeria: Evidence from dynamic panel models. SPOUDAI-J Econ Bus 68: 43-58. |
| [42] | Pratheepan T (2014) A Panel Data Analysis of Profitability Determinants: Empirical Results from Sri Lankan Manufacturing Companies. J Int J Econ Commer Manage 2: 1-9. |
| [43] | Prempeh KB, Nsiah Asare E (2016) The Effect of Debt Policy on Firms Performance: Empirical Evidence from Listed Manufacturing Companies on The Ghana Stock Exchange. MPRA Paper 75200, University Library of Munich, Germany, 1-12. |
| [44] | Ramasamy B, Ong D, Yeung MC (2005) Firm size, ownership and performance in the Malaysian palm oil industry. Asian Acad Manage J Accounting Financ 1: 81-104. |
| [45] | Ramaswamy K (2001) Organizational ownership, competitive intensity, and firm performance: An empirical study of the Indian manufacturing sector. Strategic Manage J 22: 989-998. |
| [46] | Reed WR (2015) On the practice of lagging variables to avoid simultaneity. Oxford B Econ Stat 77: 897-905. |
| [47] | Roodman D (2009) How to do xtabond2: An introduction to difference and system GMM in Stata. Stata J 9: 86-136. |
| [48] | Salim M, Yadav R (2012) Capital structure and firm performance: Evidence from Malaysian listed companies. Proc-Soc Behav Sci 65: 156-166. |
| [49] | Samiloglu F, Demirgunes K (2008) The effect of working capital management on firm profitability: Evidence from Turkey. Int J Appl Econ Financ 2: 44-50. |
| [50] | Seelanatha L (2011) Determinants of firms' performance: Some Chinese evidence. Invest Manage Financ Innovation 8: 28-38. |
| [51] | Slater SF, Olson EM (2002) A fresh look at industry and market analysis. Bus Horiz 45: 15-22. |
| [52] | Stierwald A (2009) Determinants of firm profitability-the effect of productivity and its persistence. Melbourne Inst Appl Econ Soc Res 25: 1-23. |
| [53] | Tallman SB (1991) Strategic management models and resource‐based strategies among MNEs in a host market. Strategic Manage J 12: 69-82. |
| [54] | Vătavu S (2014) The Determinants Of Profitability in Companies Listed on the Bucharest Stock Exchange. Ann Univ Petrosani Econ 14: 329-338. |
| [55] | Wintoki MB, Linck JS, Netter JM (2012) Endogeneity and the dynamics of internal corporate governance. J Financ Econ 105: 581-606. |
| [56] | Yazdanfar D (2013) Profitability determinants among micro firms: evidence from Swedish data. Int J Managerial Financ 9: 150-160. |
Figures(1) / Tables(7)

Regina Naa Amua Dodoo, Michael Appiah, Daniel Tetteh Donkor. Examining the factors that influence firm performance in Ghana: a GMM and OLS approach[J]. National Accounting Review, 2020, 2(3): 309-323. doi: 10.3934/NAR.2020018


 DownLoad: