1.
Introduction
Data hiding can embed secret data into meaningful cover media such as image, audio and video. The approach of least significant bit (LSB) replacement [1,2,3] is a common method in data hiding that embeds secret data into meaningful images. However, LSB replacement is vulnerable with some statistic analysis [4]. Matrix embedding (ME) is an approach to improve the stego security in data hiding, the ME technique was made popular by the F5 algorithm of Westfeld [5]. In [6], Li et al. proposed a novel ME based data hiding which is based on finite abelian group, it provides a general way for designing efficient steganography. Later in [7], Kim et al. proposed a new ME based data hiding scheme that can greatly improve the embedding capacity of previous Hamming code based data hiding [8]. On the other hand, data hiding scheme can be also combined with other applications to achieve more practical schemes, such as the combination of data hiding with image compression [9].
In 2006, Zhang and Wang [10] introduced a new method of data hiding, which is called Exploiting Modification Direction (EMD) that can also resist the statistic analysis and improve the quality of stego-image simultaneously. The difference between ME data hiding and EMD data hiding is that the former is based on parity check matrix and the latter is based on dividing pixels into blocks. The EMD method is a block-wise data hiding, which groups $ n $ cover-pixels into a block. It can embed a $ (2n+1) $-ary data by only modifying one pixel value $ \pm1 $ at most in this $ n $-pixel group. Since EMD method can embed secret information with minor modifications on cover image, it achieves high quality of stego-images and high visual security. However, the problem of EMD is that the embedding capacity will decrease with large $ n $, and the spatial redundancy caused by converting binary stream into $ (2n+1) $-ary notational system.
Improving embedding capacity of EMD is an attractive research topic in data hiding in recent years. Many works [11,12,13] have focused on this issue. In 2013, Kuo et al. proposed a generalized EMD (GEMD)[14] method. GEMD still uses $ n $ cover-pixels in a group, and is capable of embedding $ n+1 $ bits of secret data. The embedding capacity of GEMD is $ \frac{n+1}{n} $ bpp, which maintains over $ 1 $ bpp. In addition, GEMD can also resolve the spatial redundancy problem in EMD. For instance, suppose $ n = 2 $ and the $ 3 $ bits secret data is $ 111 $. The decimal value of $ 111 $ is 7, when using EMD, $ 7 $ is larger than $ 2n+1 = 5 $, therefore the secret data can not be embedded into one $ 2 $-pixels group, two $ 2 $-pixels groups are needed to embed secret data $ 111 $; when using GEMD, the $ 3 $ bits $ 111 $ can be embedded into one group of $ 2 $ pixels efficiently. In 2016, Kuo et al. [15] constructed a data hiding method based on Modified Signed Digit (MSD), which also uses EMD approach and the embedding capacity is $ \frac{log(\frac{2\cdot 4^{n/2}+1}{3})}{n} $ bpp. In 2017, Wang et al. introduced a re-adjusted GEMD (RGEMD) [16] that can embed $ 2n $ bits secret data into $ n $-cover-pixels. Although GEMD, MSD and RGEMD can improve embedding capacity of EMD, they need much more than one pixel among the group of $ n $ pixels to be changed in the embedding process, the qualities of stego-images are worse than EMD. In [17], a section-wise EMD was introduced to improve the embedding capacity of EMD. It divides the $ n $ cover-pixels into two groups to embed secret data. This approach can improve the image quality and enhance the embedding capacity a little bit from the EMD. However, a section-wise EMD is equally a combination of two EMD data hiding, it still causes a spatial problem. In [18], Wang et al. proposed a switch map based multi-group EMD to further enhance the embedding capacity. The scheme in [18] is extended from section-wise EMD, it divides $ n $ cover-pixels into $ k $ groups instead of two groups to embedding secret data. The innovation of scheme [18] is that it uses a switch map algorithm to solve the redundance problem in [10] and [17], and therefore improved the embedding capacity.
The switch map in [18] encodes a set of decimal digits into binary codewords. However, by a detail observation, we find that more codewords with longer code-length can be put into this switch map. In this paper, we bulid a new switch map based on Huffman code instead of switch map in [18], and propose an enhanced multi-group EMD method to improve the embedding capacity. On the other hand, when dividing $ n $ cover-pixels into $ k $ groups, there are multiple distributions on the pixel numbers in each group. We give an analysis on the distributions when our scheme achieves the maximum embedding capacity. The contributions of proposed scheme can be concluded as follows.
$ (1) $ A new switch map based on Huffman code is built instead of the switch map in [18].
$ (2) $ The proposed scheme improves the embedding capacity of the switch map based multi-group EMD data [18], and maintains the stego-image quality.
$ (3) $ An algorithm is proposed to achieving maximum embedding capacity in proposed data hiding scheme.
This paper is organized as follows. In section 2, we introduce the related works, which includes EMD [10], section-wise EMD [17] and switch map based multi-group EMD [18] respectively. In section 3, we build a new switch map on Huffman code, and propose a enhanced multi-group EMD based on this map to improve the embedding capacity. The comparisons of embedding capacities and the PSNR value of stego images for proposed data hiding are shown in section 4, and the conclusion is included in section 5.
2.
Related works
2.1. Original EMD
The EMD method is a block-wise data hiding, which groups $ n $ cover-pixels $ (g_{1}, g_{2}, ..., g_{n}) $ into a block. The process of EMD can be divided into embedding phase and extracting phase, which is shown in following Scheme 1.
Scheme 1: EMD method
Embedding phase: Input: a cover-image with $ n $ pixels $ I = (g_{1}, g_{2}, ..., g_{n}) $, secret data $ s $; Output: stego-image $ I^{'} = (g_{1}^{'}, g_{2}^{'}, ..., g_{n}^{'}) $.
$ (1) $ Compute $ f_{EMD} = [\sum^{n}_{i = 1}(g_{i}\times i)]\ mod\ (2n+1) $, and convert $ s $ into $ 2n+1 $-ary stream $ s^{'} $.
$ (2) $ Compute $ d = (s^{'}-f_{EMD})\ mod\ (2n+1) $.
$ (3) $ If $ (1\leq d\leq n) $, $ g_{d}^{'} = g_{d}+1, g_{i}^{'} = g_{i}, i\in[1, n], i\neq d $;
else if $ (d = 0) $, $ g_{i}^{'} = g_{i}, i\in[1, n] $;
else, $ g_{2n+1-d}^{'} = g_{2n+1-d}-1, g_{i}^{'} = g_{i}, i\in[1, n], i\neq 2n+1-d $.
Output the stego-image: $ I^{'} = (g_{1}^{'}, g_{2}^{'}, ..., g_{n}^{'}) $.
Extracting phase: Input: stego-image: $ I^{'} = (g_{1}^{'}, g_{2}^{'}, ..., g_{n}^{'}) $; Output: secret data $ s $.
$ (1) $ Compute $ s^{'} = f^{'}_{EMD} = [\sum^{n}_{i = 1}(g_{i}^{'}\times i)]\ mod\ (2n+1) $.
$ (2) $ Convert $ 2n+1 $-ary data $ s^{'} $ into binary stream $ s $, output $ s $.
The embedding capacity of EMD is presented as $ R_{EMD} = \frac{log_{2}(2n+1)}{n} $. However, this result is not practical since the conversion from a binary stream into a $ 2n+1 $-ary digits causes redundancy binary bits.
2.2. Section-wise EMD
In [17], a section-wise EMD (SEMD) method was introduced based on EMD [10]. The preliminary work of [17] is shown as follows. First determining the acceptable cutoff length $ L $ on the binary stream $ s $ of the secret data, then choosing two integers $ n_{1}, n_{2} $ ($ n = n_{1}+n_{2} $, $ n $ is the number of all cover-pixels) satisfying $ (2n_{1}+1)(2n_{2}+1)\geq 2^{L} $. Next, building up a table $ T $ of $ 2n_{1}+1 $ rows and $ 2n_{2}+1 $ columns, and filling $ T $ with all $ 2^{L} $ binary streams of length $ L $. We describe the section-wise EMD in following Scheme 2.
Scheme 2: Section-wise EMD
Embedding phase: Input: a cover image with $ n $ pixels $ I = (g_{1}, g_{2}, ..., g_{n}) $, $ L $ length binary secret data $ s $; Output: stego-image $ I^{'} $
$ (1) $ Dividing $ I = (g_{1}, g_{2}, ..., g_{n}) $ into two two groups $ I_{1} $ and $ I_{2} $, where $ I_{1} $ consists of $ n_{1} $ pixels and $ I_{2} $ consists of $ n_{2} $ pixels. $ (n = n_{1}+n_{2}) $
$ (1) $ Looking up $ s $ in the table $ T $, let $ p $ and $ q $ represent the corresponding row and column of $ s $.
$ (2) $ Embedding $ p $ and $ q $ into $ I_{1} $ and $ I_{2} $ using EMD respectively, the corresponding stego images are $ I^{'}_{1}, I^{'}_{2} $. Output the stego-image $ I^{'} = (I^{'}_{1}, I^{'}_{2}) $.
Extracting phase: Input: stego-images: $ I^{'} = (I^{'}_{1}, I^{'}_{2}) $; Output: secret data $ s $.
$ (1) $ Extracting $ p $ and $ q $ from $ I_{1}^{'} $ and $ I_{2}^{'} $ according to EMD extraction.
$ (2) $ $ s $ is the binary stream in row $ p $ and column $ q $ in Table $ T $. Output $ s $.
The SEMD can improve embedding capacity of EMD. However it causes spatial redundancy from the table $ T $.
2.3. Switch map based multi-group EMD
In [18], Wang et al. proposed a switch map based multi-group EMD (SMEMD) to reduce the spatial redundancy in [17], and enhance embedding capacity. It divides all $ N $ cover-pixels into $ k $ groups (the numbers of pixels in each group are $ n_{1}, n_{2}, ..., n_{k}, N = \sum_{i = 1}^{k}n_{i} $) to embed secret data. First computing $ X = \prod^{k}_{i = 1}(2n_{i}+1) $, and $ L = \lfloor log_{2}X \rfloor $; Next set up a switch map of all $ X $ decimal digits in $ [0, X-1] $, where each decimal digit is encoded to a $ L $ or $ L+1 $ length binary stream in the map using the switch algorithm. When $ k = 2 $, the embedding phase and extracting phase of SMEMD are similar with those of SEMD. The difference between them is that SMEMD can embedding all $ X $ different binary streams with length $ L $ or $ L+1 $. On the contrary, SEMD can only embed $ 2^{L} $ binary streams with length $ L $ and causes $ X-2^{L} $ spatial redundancy.
We adopt $ N = 4, k = 2, n_{1} = 2, n_{2} = 2 $ to show the embedding process as follows, and the extracting process is similar as in Scheme 2.
$ 1 $ Computing $ X = (2n_{1}+1)(2n_{2}+1) = 25 $, and $ L = \lfloor log_{2}X\rfloor = 4 $.
$ 2 $ Constructing a switch map of $ 25 $ different binary streams with length $ L $ or $ L+1 $ as shown in Table 1.
$ 3 $ Extracting a binary stream $ s $ with length $ L+1 $, if $ s $ exists in the map, find out its position $ (T_{c}, T_{r}) $; else find out the position $ (T_{c}, T_{r}) $ of $ L $ MSBs of $ s $ in the switch map.
$ 4 $ Embedding $ T_{c}, T_{r} $ in each pixel-groups respectively.
3.
Proposed scheme
In this section, we construct a new switch map instead of the switch map in SMEMD to put more codewords with longer code-length. As shown in the switch map in [18] (Table 1), all the codes are binary streams with length of $ L = 4 $ or $ L+1 = 5 $. The embedding capacity will increase when there are as more $ L+1 $ length codes as possible. Although the switch map in [18] has more $ L+1 = 5 $ length code than $ L = 4 $ length code, there are still problems in Table 1 and the embedding capacity can be further improved. For example, if we want to encode the binary stream $ (00011) $ using the switch map (see Table I), one can find that the $ 5- $tuple $ (00011) $ does not exist in switch map, but the $ 4 $-tuple $ (0001) $ ($ T_{r} = 0, T_{c} = 1) $ and $ 5 $-tuple $ (00010) $ ($ T_{r} = 0, T_{c} = 2 $) are included in the switch map. However, this case reduces embedding efficiency. In fact, if the $ 5 $-tuple $ (00011) $ is substituted for the original $ 4 $-tuple $ (0001) $ in Table 1, both $ (00010) $ and $ (00011) $ exist in the map. Thus, we can avoid embedding $ 4 $ bits $ (0001) $ and enhance embedding efficiency. The switch map in Table I has two such situations, which are $ (0001), (00010) $ and $ (1100), (11000) $. By further observation on the switch map in Table 1, if we have more such $ 5 $-tuple pairs $ (b_{1}b_{2}b_{3}b_{4}0) $ and $ (b_{1}b_{2}b_{3}b_{4}1) $, we may have higher embedding efficiency. Also, for correct embedding/extraction, all $ 2^{L} = 16 $ $ 4 $-bit patterns should appear in leading $ 4 $-bits for all $ X = 25 $ binary patterns. This observation delivers the following equation 3.1.
where $ x $ and $ y $ are the numbers of $ L = 4 $-tuples and $ L+1 = 5 $-tuples in the map of size $ X $. For the case $ X = 25 $, we have $ x+\frac{1}{2}y = 16 $ and $ x+y = 25 $, and derive $ x = 7 $ and $ y = 18 $. However, the switch map in Table 1 has $ x = 9 $ and $ y = 16 $. The embedding capacity can be derived from the following equation (3.2).
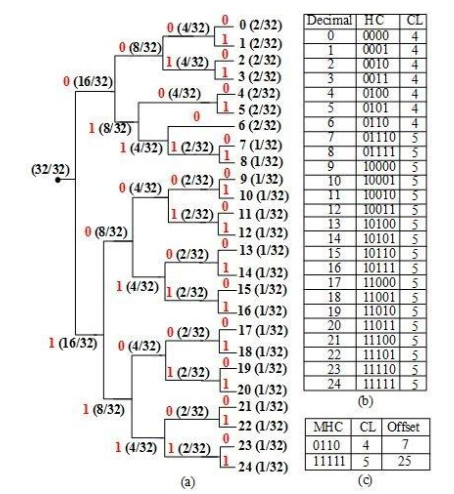
From Eq.(3.2), the embedding capacity of SMEMD can be enhanced from $ \frac{4\times9+5\times16}{25\times4} = 1.16 $ to $ \frac{4\times7+5\times18}{25\times4} = 1.18 $ when using $ x = 7 $ and $ y = 18 $. We can establish a map of $ X = 25 $ with $ x = 7 $ and $ y = 18 $ by Huffman code (HC). Let the decimal values $ 0 $ to $ 6 $ represent $ 7 $ $ 4 $-tuples, and decimal values $ 7 $ to $ 24 $ represent other $ 18 $ $ 5 $-tuples. The total probability of all these $ 25 $ codewords is $ 1 $, and the probability of $ 4 $-tuple should be larger than that of $ 5 $-tuple, such that the length of codeword with high probability will have the small code length (CL). The proposed map with $ x = 7 $ and $ y = 18 $ for $ X = 25 $ is illustrated in Table 2.
Let the probabilities of each decimal value $ 0 $ to $ 6 $ and $ 7 $ to $ 24 $ be $ \frac{1}{16} $ and $ \frac{1}{32} $, respectively. By HC, the encoding approach is given in Figure 1(a). All these $ 25 $ codewords with $ L = 4 $ and $ L+1 = 5 $ are listed in Figure 1(b). The extraction algorithm of SMEMD (see page 1530 in [18]) demonstrates that they adopt look up table (LUT). The original statement of (Step 6) in [18] extraction algorithm is "Convert SD (secret digit) into $ L $ or $ L+1 $ secret bits with the switch map". Therefore, like the extraction algorithm in [18], we can implement the extraction by LUT. But, if we want adopt calculative process to extract $ L $ or $ L+1 $ secret bits when using HC based map. This can also be easily implemented by HC compressed table (see Figure 1(b)), which records the maximum Huffman codeword (MHC) and CL for each subset with the same CL, and the offset (the number of total codewords including this subset and previous subsets). Via this small compressed LUT, we can easily encode/decode HC. For example, we demonstrate two cases of encoding. Case (ⅰ) the decimal is $ 5 $: since $ 5 < 7 $ (the value of offset in 1st row), we can derive codeword by converting $ 5 ( = 0+5) $ to binary number with $ CL = 4 $. Thus, the codeword is $ (0101) $. Case (ⅱ) the decimal is $ 18 $: since $ 18 > 7 $, we can derive codeword by converting $ 25 ( = 7+18) $, where $ 18 $ is the value of offset in 2nd row, to binary number with $ CL = 5 $. Thus the codeword is $ (11001) $. In addition, the method of constructing switch map using HC can be public for both the message sender and receiver, they can build up the corresponding switch map without any communication.
In our scheme, all the $ N $ cover-pixels are divided into $ k $ groups firstly. The different distributions on $ n_{1}, n_{2}, ..., n_{k}, N = \sum^{k}_{i = 1}n_{i} $ achieve different embedding capacities. In following theorem, we give an analysis on the distribution on $ n_{1}, n_{2}, ..., n_{k} $ when our scheme has maximum embedding capacity.
Theorem 1: When $ N $ and $ k $ are fixed, the embedding capacity achieves maximum if $ n_{i}, i\in[1, k] $ equals to the arithmetic mean of $ N $ that $ n_{i} = \frac{N}{k}, i\in[1, k] $.
Proof: The embedding capacity is $ R = \frac{xL+y(L+1)}{X\times N} $ in Eq.(3.2), and we can also resolve $ x = 2^{L+1}-X, y = 2X-2^{L+1} $ from Eq.(3.1). Then the embedding capacity can be presented as:
From Eq.(3.3) we can observe that $ R $ increases when $ X $ becomes larger. Since $ X = \prod_{i = 1}^{k}(2n_{i}+1) $, and the sum of all $ (2n_{i}+1), i = 1, 2, ..., k $ is fixed, ($ \sum^{k}_{i = 1}(2n_{i}+1) = 2N+k $) $ X $ achieved its maximum value when each $ 2n_{i} $+1 are identical. Therefore the embedding capacity achieves maximum when $ n_{i}, i\in[1, k] $ equals to the arithmetic mean of $ N $, $ n_{i} = \frac{N}{k} $. End of proof.
If $ \frac{N}{k} $ is not a integer, we use the following algorithm for distribution on each $ n_{i} $.
Algorithm 1: Distribution on $ n_{i} $ to achieving maximum on embedding capacity.
Input: $ N, k $; Output: $ n_{1}, n_{2}, ..., n_{k} $
$ 1 $ Compute $ p, q (q < k) $ such that $ N = pk+q $.
$ 2 $ $ n_{1} = n_{2} = , ..., = n_{q} = p+1, n_{q+1} = , ..., = n_{k} = p $.
For example when $ N = 8, k = 3 $, $ n_{1} = 3, n_{2} = 3, n_{3} = 2 $ will reaches the maximum on the embedding capacity $ R = 0.995 $. The Table 3 shows the embedding capacities with different distributions on $ n_{i}, i = 1, 2, ..., k $ when $ N = \sum_{i = 1}^{k}n_{i} $ is fixed. In addition, we also discuss the computational complexity of proposed data hiding in this case. According to the description previously, the proposed data hiding is equally to dividing an EMD data hiding using $ N $ pixel group into $ k $ EMD data hiding where each sub-EMD data hiding uses a $ \frac{N}{k} $ pixel group. Since the computational complexity of EMD is $ O(N) $, the corresponding computational complexity of proposed scheme is $ O(\frac{N}{k})\times k\simeq O(N) $. Therefore our proposed data hiding achieves similar computational complexity as EMD data hiding.
4.
Comparisons and experiments
In this section, we give a comparison of embedding capacities between the EMD, SEMD, SMEMD and our proposed scheme, and then use an experiment to show the embedding distortion of proposed scheme. Suppose the number of all cover-pixels is $ N $. In original EMD [10], there is only one group of $ N $ pixels, it causes redundancy when converting binary bits into $ 2N+1 $-ary notational system. The embedding capacity of EMD is $ R_{EMD} = \frac{log_{2}(2N+1)}{N} $; SEMD divides the $ N $ cover-pixels into two groups which include $ n_{1}, n_{2} $ pixels respectively. The embedding capacity of SEMD is $ R_{SEMD} = \frac{\lfloor log_{2}(2n_{1}+1)(2n_{2}+1)\rfloor}{N} $; The SMEMD divides the $ N $ cover-pixels into $ k(k\geq 2) $ groups, which include $ n_{1}, n_{2}, ..., n_{k} $ pixels respectively. Let $ X = \prod_{i = 1}^{k}(2n_{i}+1) $, a switch map of $ X $ binary streams of length $ L = \lfloor log_{2}X \rfloor $ or $ L+1 $ is constructed for embedding secret data. The embedding capacity of SMEMD is $ R_{SMEMD} = \frac{xL+y(L+1)}{XN} $, where $ x $ and $ y $ are the number of $ L $-length and $ L+1 $-length binary streams in the switch map. In this paper, we analyze the weakness of switch map in [18], and construct a new switch map based on HC to obtain optimum $ x = 2^{L+1}-X $ and $ y = 2X-2^{L+1} $. Comparing with switch map in [18], the HC based switch map includes more binary streams of length $ L+1 $, which can enhance the embedding efficiency. The embedding capacity of our scheme can be presented as $ R_{PRO} = \frac{2+L-\frac{2^{L+1}}{X}}{N} $. In addition, when $ N = \sum_{i = 1}^{k}n_{i} $ is fixed, we give an optimum distribution on $ n_{1}, n_{2}, ..., n_{k} $ to achieving the maximum embedding capacity. (see Algorithm 1) The following Table 4 shows the comparison of embedding capacities between these four schemes.
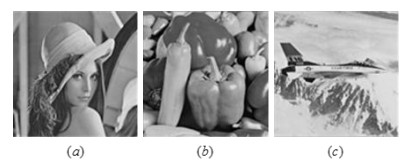
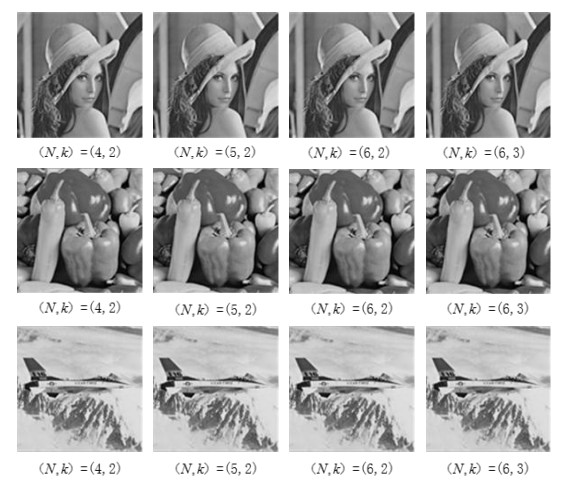
Here experiments are used to generate stego-images using our proposed data hiding, and comparisons of stego-image qualities are also made between EMD, SEMD, SMEMD and our proposed data-hiding. Three $ 512\times512 $ grayscale images: Lena, pepper, and jet (see Figure 2) are used as cover images to embed secret data using our proposed data hiding. The stego-images (Figure 3) that generated from these three cover images with different parameters $ (N, k) = (4, 2), (5, 2), (6, 2) $ and $ (6, 3) $ respectively. Generally, the quality of stego-image is evaluated in terms of the peak-signal-to-noise ratio (PSNR). Higher PSNR reflects better image quality. Normally, a stego-image is unable to be visually distinguished from the cover image when its PSNR is higher than $ 30 $ dB. The PSNR and mean square error (MSE) are presented as follows.
where $ M $ and $ N $ represent the length and width of the image.
In following Table 5, we give a comparison of PSNR value on stego images between EMD, SEMD, SMEMD and proposed data hiding, where the original grayscale image Lena is used as cover image with different parameters $ (N, k) $. From Table 5 we can see that the our data hiding scheme achieves similar PNSR value as SEMD and SMEMD and is lower than EMD data hiding. Even though the PSNR value of our scheme is high enough to guarantee the stego image quality. The data in Table 5 also demonstrates that the PNSR value is related to the embedding capacity. For instance, when $ (N, k) = (6, 3) $, SMEMD and our proposed data hiding have higher embedding capacities than EMD and SEMD, as a result, the PSNR value is lower than EMD and SEMD.
5.
Conclusion
Switch map based multi-group EMD solved the conversion redundancy and spatial redundancy of EMD and section-wise EMD respectively. In this paper, we use HC based map instead of the previous switch map to embed secret data in multi-group EMD. Comparing with previuos switch map, HC based map includes more codes with longer code-length, which can enhance the embedding capacity. In addition, we analyze the distributions to $ n_{i}, i = 1, 2, ..., k $ to achieving maximum embedding capacity. The data from Table 4 shows that our scheme has the optimum embedding capacity when comparing with EMD, section-wise EMD and multi-group EMD.
Acknowledgments
This work was supported by National Natural Science Foundation of China under Grant No. 61502384, 61571360, 61872289; This research was supported in part by Ministry of Science and Technology (MOST), under Grant 107-2221-E-259-007.
Conflict of interest
The authors declared they have no competing interests.


 DownLoad: