Citation: Sabrine Louhaichi, Mariem Salhi, Anissa Berraïes, Besma Hamdi, Jamel Ammar, Kamel Hamzaoui, Agnès Hamzaoui. Co-inhibitory receptors in female asthmatic patients: Correlation with IL-17 and IL-26[J]. AIMS Allergy and Immunology, 2018, 2(1): 10-23. doi: 10.3934/Allergy.2018.1.10
| [1] | Giulia Ambrosi, Pamela Milani . Endoplasmic reticulum, oxidative stress and their complex crosstalk in neurodegeneration: proteostasis, signaling pathways and molecular chaperones. AIMS Molecular Science, 2017, 4(4): 424-444. doi: 10.3934/molsci.2017.4.424 |
| [2] | Jehad Shaikhali, Gunnar Wingsle . Redox-regulated transcription in plants: Emerging concepts. AIMS Molecular Science, 2017, 4(3): 301-338. doi: 10.3934/molsci.2017.3.301 |
| [3] | Mayuko Ichimura, Akari Minami, Noriko Nakano, Yasuko Kitagishi, Toshiyuki Murai, Satoru Matsuda . Cigarette smoke may be an exacerbation factor in nonalcoholic fatty liver disease via modulation of the PI3K/AKT pathway. AIMS Molecular Science, 2015, 2(4): 427-439. doi: 10.3934/molsci.2015.4.427 |
| [4] | Zhaoping Qin, Patrick Robichaud, Taihao Quan . Oxidative stress and CCN1 protein in human skin connective tissue aging. AIMS Molecular Science, 2016, 3(2): 269-279. doi: 10.3934/molsci.2016.2.269 |
| [5] | Vittorio Emanuele Bianchi, Giancarlo Falcioni . Reactive oxygen species, health and longevity. AIMS Molecular Science, 2016, 3(4): 479-504. doi: 10.3934/molsci.2016.4.479 |
| [6] | Akshaj Pole, Manjari Dimri, Goberdhan P. Dimri . Oxidative stress, cellular senescence and ageing. AIMS Molecular Science, 2016, 3(3): 300-324. doi: 10.3934/molsci.2016.3.300 |
| [7] | Carlos Gutierrez-Merino, Dorinda Marques-da-Silva, Sofia Fortalezas, Alejandro K. Samhan-Arias . The critical role of lipid rafts nanodomains in the cross-talk between calcium and reactive oxygen and nitrogen species in cerebellar granule neurons apoptosis by extracellular potassium deprivation. AIMS Molecular Science, 2016, 3(1): 12-29. doi: 10.3934/molsci.2016.1.12 |
| [8] | Viktor Semenkov, Anatolii Mikhalskii, Alexandr Sapoznikov . Influence of heat shock proteins in individual sensitivity of human neutrophils to heat stress. AIMS Molecular Science, 2019, 6(2): 38-51. doi: 10.3934/molsci.2019.2.38 |
| [9] | Chitho P. Feliciano, Sandrine Cammas-Marion, Yukio Nagasaki . Recent advances in self-assembling redox nanoparticles as a radiation protective agent. AIMS Molecular Science, 2023, 10(1): 52-69. doi: 10.3934/molsci.2023005 |
| [10] | Brandt D. Pence . Recent developments and future perspectives in aging and macrophage immunometabolism. AIMS Molecular Science, 2021, 8(3): 193-201. doi: 10.3934/molsci.2021015 |
Increasing population and economic development are continuing to put a great challenge and pressure on the domestic consumption for rice in Malaysia, as rice is a staple food of its population. Rice production in the country has reached 72% of the self-sufficiency level (SSL), still eight percent short of the 80% target. This is done in order to avoid the national market shortage of rice, because a lower rice self-sufficiency rate will threaten the food security condition of the country. Despite, there are increasing in planted areas in Peninsular Malaysia, the presence of soft soil in paddy field area resulted in reducing the rice production. A soft soil is one of the major problems and dealing with such as clay was challenging task in construction phase [1,2]. The other problems have been noted such as sodicity and permeability of soil. At this current time, total area of soft soil is recorded about 8000 ha and another 5000 ha has high potential to meet the same problem. Although, several options has been adopted by the government to mitigate the soft soil, such as the establishment of irrigation and road networking. However, this problem is still persisted to occur again.
In general, soft soil is characterized with very low compaction as indicated by the soil penetration resistance value of less than 0.40 MPa [3]. This is frequently occurred in acid sulphate soil due to the weak hardpan layer that cannot support the surcharge load imposed by machinery equipment, especially during soil preparation and harvesting seasons [4]. The continuous tillage also exerts series of disruptive forces to disintegrate soil particle thus causing the soft soil problem. Depth and width of soft zone are governed by high soil water content, causing low structural porosity and high structural deformation. This is well documented that decreased in bulk density coupled with increasing in soil water caused the reduction in permissible ground pressure [5,6]. High water content and low permeability of the soil cause the waterlogged patches of water in paddy field area. The waterlogged condition will affect the poor seed germination and also causes the low soil strength, which delays the hardpan formation and eventually slow down the working efficiency in the paddy field because the land is not able to support the load pressure of machinery equipment [7]. Soft soil is also characterized by sodicity. Sodicity induces deterioration in soil structure impedes water entry into the soil and the subsequent percolation of water through the soil profile [8]. Under sodic condition, poor soil structure, restricted water movement and nutrient toxicities are the major constraints to plant growth [9]. Structural degradation arises due to clay dispersion, plugging of the soil pores and development of a calcareous hard layer in the subsoil. To mitigate soft soil in the paddy field area, Muda Agricultural Development Authority (MADA) has to stop the agricultural activities in the problematic paddy fields. This is done to make the sufficient time range in order to hardpan layer is dried and harden, but this way took a long period of time, which it will reduce the rice yield.
One of the common options to improve soft soil problem is to replace the soil with the new soil to develop better hardpan layer. This is involved the removal of soft soils and replaced with stronger material such as crushed rocks [10]. Mohd Nazim et al. [11] applied this technique in plot study scale in Alor Senibong, Kedah, Malaysia. Besides, Azizul [3] applied the vibrator subsoiler technique in paddy estate of FELCRA Seberang Perak, Malaysia. This technique used the vibrator subsoiler as a specific tool which installed in the tractor in order to make small drainages which then could discharge the excess water from the problematic soil in paddy field area. However, these techniques are expensive for local farmers which involve the dredge and compactor machines to be used. To have appropriate soil management, the farmer should understand what type of amendment that required to optimize the productivity of the soil for the crop [12].
An alternative option should be examined to warrant a cheaper solution which offers soil improvement mechanically and soil quality in terms of nutrient enrichment for better yield. Hasil Tani Organic Compound (HTOC) is an alternative product that can potentially act as organic soil amendment to increase soil quality and stability index. This is manufactured by using organic component consisting of wood residuals as well as humic acid and zeolite mineral in a specific ratio [13]. When the paddy soil is flooded for rice cultivation, soil particles started to disperse, thus organic matter of HTOC will assist the soil by binding the soil particles towards stable aggregates. Many studies have highlighted the effects of organic matter on soil physicochemical properties [14]. The amelioration of soil physicochemical properties by raising soil organic matter and organic carbon has been recommended for increasing soil quality and crop production [15]. Application of HTOC at appropriate rate is able to improve the less fertile soil such as soft soil. The mechanism of HTOC to improve soft soil was use zeolite component to help increasing the stability of soil structure and absorb the excess water in soil pores to expedite time range for hardpan layer formation. Treated plot with HTOC is showed by decrease in soil water content. Another important component of HTOC is humic acid, it is very effective for binding soil aggregates and nutrient retention of soft soils. In this paper, soil samples were taken at top soil 0–15 cm to analyze the basic properties of soft soil. The objective of study was to examine closely the effects of addition of HTOC to soft soil in order to enhance its quality and strength.
This study was conducted in the selected paddy fields that associated with soft soil problem. The study area located at Alor Senibong MADA, Langgar, Kedah, Malaysia (6°6'15.19"N and 100°27'55.74"E) (Figure 1). The paddy soil was an acid sulphate soil that classified as Tualang Series [16]. This site has experienced with the presence of soft soil that hinder the agricultural activity of this area and low rice yield with an average production of less than 2 t ha–1 season–1. Rice cultivation in this area applied the fertilizers and pesticides subsidized by Malaysian government. Department of Meteorology, Malaysia recorded the mean rainfall in year 2016 at this area was about 2364 mm year–1, with pronounced dry period in December-March annually.
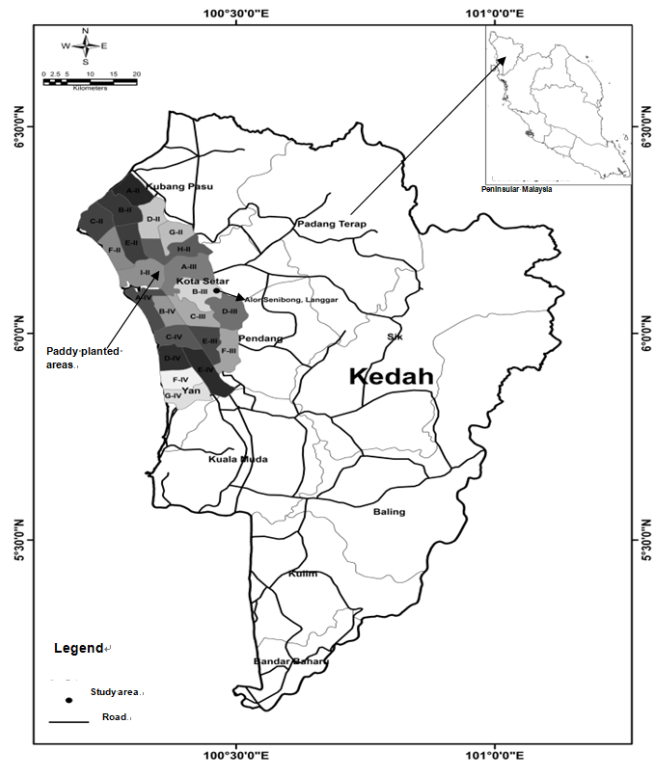 Figure 1. Location of the study area.
The treatments for the field trial were; T0 = 0 t HTOC ha–1 (control plot), T1 = 0.25 t HTOC ha–1 (treated plot). Total area from each of plot was about 0.58 acres. HTOC was applied after the first ploughing activities using a portable sprayer with capacity of 250 L. Only fertilizers and no lime added in the experimental plot based on the standard rate. Rice variety MR219 was used in this investigation that was commonly planted by farmers throughout Peninsular Malaysia. A total of 18 representative top soil samples 0–15 cm (three from each point) were collected randomly from the paddy plots (Figure 2). Sampling activity was divided by three different periods such as; before paddy planting (May 2016), after the first harvest (Sept 2016) and after the second harvest (Feb 2017) (Figure 3). The penetrometer measurements were recorded at the same points with three replicates reading from each of point to obtain a representative average result per plot. Then, samples were brought to the laboratory for analysis. In-situ measurement of soil strength has been done by using Hand Penetrometer Eijelkamp. The penetrometer method had a measuring range of 1000 N (10 MPa). Soil strength was measured by pushing the cone into the ground at a constant rate of 2 cm s–1. The cone used in this study had the base area of 5 cm2. The resistance is read in N (Newton) and noted for the appropriate depth. The base area of the cone should also be noted because the cone resistance was expressed in N cm–2 which then it should be converted to MPa unit.
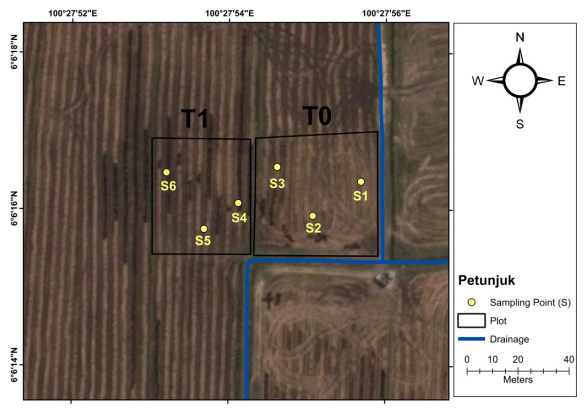 Figure 2. Spatial distribution of sampling points in study area.
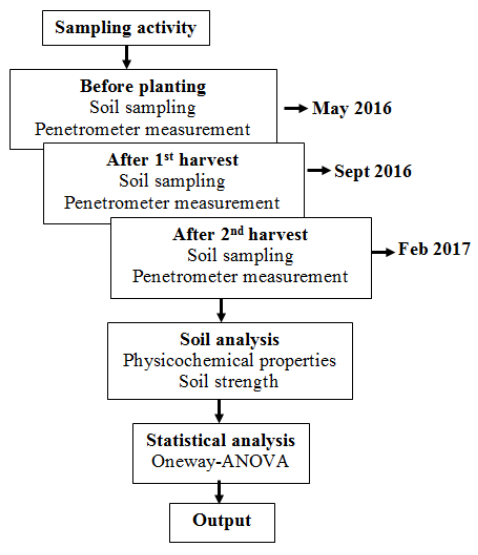 Figure 3. Flowchart of the study.
After air-drying, soil samples were ground and passed through a 2 mm sieve. The following soil analysis was carried out. Soil pH was analyzed by using distilled water based on 1:2.5 ratio of soil and water which then it was measured by pH meter WTW INOLAB Level 1 [17]. Electrical conductivity was extracted into saturated gypsum and measured by meter conductivity device Model H 18819 Hanna [18]. Soil organic matter content was determined using loss on ignition method [19]. The dry combustion method was based on loss on ignition where oven dried soil samples were placed in a crucible and ignited in a muffled oven for at least 3 hours at 550 ± 25℃. The crucible with sample was cooled in the desiccator for 30 minutes and then weighed. The organic matter was than calculated from the weight loss by using correction factor for clay content. Soil water content was determined using the gravimetric method [19] and the hydraulic conductivity was determined using the falling head method described by Kirkby [20]. Particle size was determined using the pipette method with slight modification [21]. Bulk density was determined using wax method by Russell and Balcerek [22].
Exchangeable base cations (Ca2+, Mg2+, Na+ and K+) were determined by using NH4OAc extraction which then was measured by atomic absorption spectrometry (AAS) instrument. While, for exchangeable acid cations (Al3+ and H+) was extracted by 1 M KCl solution and determined by titimetric method. Then, the cation exchange capacity (CEC) was determined by the addition of base and acid cations [23]. Total carbon was determined by Carbon, Hydrogen, Nitrogen, Sulphur instrument. Humic acid content in the soil was extracted by suspending the soil overnight in NaOH (0.5 mol L–1) solution and the supernatant was collected by centrifugation. The extract was then acidified up to pH 2.0 using 6 N HCl and centrifuged to obtain fulvic acid. The residue was washed with HCl (0.5 mol L–1) solution and the washings and supernatants were combined for separating humic acid.
Data from the experiment were analyzed statistically using One-way ANOVA to determine the mean difference between before and after HTOC application. The statistical package used was IBM SPSS software version 21.
Table 1 shows the basic properties of HTOC product. HTOC product has a high organic matter content of 41.59% with a pH as high as 7.98. Electrical conductivity is around 3.50 mS cm–1. Total carbon and nitrogen are about 25.80% and 0.89%, respectively. C:N ratio with the value of 29:1. Cation exchange capacity is as high as 20.81 cmolc kg–1. Humic and fulvic acid are around 4.59% and 0.19%, respectively.
| Parameter | Value |
| Organic matter (%) | 41.59 ± 0.02 |
| pH | 7.98 ± 0.01 |
| Electrical conductivity (mS cm–1) | 3.50 ± 0.81 |
| Total C (%) | 25.80 ± 0.01 |
| Total N (%) | 0.89 ± 0.01 |
| C:N | 29:1 ± 0.01 |
| Exchangeable H+ (cmolc kg–1) | 0.00 |
| Exchangeable Al3+ (cmolc kg–1) | 0.57 ± 0.25 |
| Exchangeable K+ (cmolc kg–1) | 6.98 ± 0.85 |
| Exchangeable Mg2+ (cmolc kg–1) | 3.93 ± 0.28 |
| Exchangeable Ca2+ (cmolc kg–1) | 5.18 ± 0.21 |
| Exchangeable Na+ (cmolc kg–1) | 3.21 ± 0.12 |
| Cation exchange capacity (cmolc kg–1) | 20.81 ± 1.48 |
| Base saturation (%) | 97 |
| Humic acid (%) | 4.59 ± 0.31 |
| Fulvic acid (%) | 0.19 ± 0.01 |
 DownLoad: CSV
Table 2 shows the effects of HTOC product on the soil properties in the field trial. The pH of treated plot has risen from 3.36 to 3.77 at the first harvest which then it reached at 4.34 at the second harvest. Mean pH of treated plot after the first and the second harvest is found significantly higher than control plot, with the value of p = 0.017 and p < 0.001, respectively at 5% level. This showed that the addition of 0.25 t HTOC ha–1 as successfully indicated a better result than the prior sowing. The increment pH of treated plot may due to the rapid dissolution of HTOC in the soil profile. Similar result has been found by Sahibin et al. [13] in their earlier study. Relatively higher pH in the paddy soil is observed after HTOC application in Region 4 Alor Nan, Kedah with pH value increases from 4.63 to 5.12. However, the application rate of soil amendment like HTOC depends on the localities. Hence, field experiment such as this current study is needed to justify the most suitable and feasible application rate. On the other hand, Al level in the soil is reduced reasonably when the pH increases, which indicates the better efficiency of HTOC, thus pH is negatively and significantly correlated with exchangeable Al3+ (r = –0.670, p < 0.05). Soil pH increases significantly following reduction in exchangeable Al3+, while it is positively and significantly correlated to exchangeable Ca2+ (r = 0.651, p < 0.05, Table 3). By increasing the pH dissolves Al in the soil will precipitate to form gibbsite (Al(OH)3), thereby reducing the toxicity of Al in the soil [24]. Exchangeable Al3+ of the treated plot has decreased from 2.07 cmolc kg–1 to 1.63 cmolc kg–1 after the first harvest, which then it reached at 1.37 cmolc kg–1 after the second harvest. Mean exchangeable Al3+ of treated plot after the first and the second harvest is found significantly lower than control plot, with the value of p < 0.001 at 5% level. This notes that exchangeable Al3+ in the soil tends to decrease, while exchangeable Ca2+ increases over the season.
| Parameter | Periods | |||||
| Before planting (May 2016) | 1st harvest (Sept 2016) | 2nd harvest (Feb 2017) | ||||
| T0 | T1 | T0 | T1 | T0 | T1 | |
| Sand (%) | 13 ± 0.36 | 13 ± 0.62 | 11 ± 0.47 | 12 ± 0.59 | 13 ± 3.84 | 13 ± 0.07 |
| Silt (%) 0.063–0.002 mm | 38 ± 1.06 | 31 ± 2.50 | 39 ± 0.20 | 32 ± 3.15 | 34 ± 9.65 | 30 ± 0.53 |
| Clay (%) < 0.002 mm | 49 ± 0.73 | 56 ± 2.45 | 50 ± 0.27 | 56 ± 2.57 | 52 ± 5.83 | 57 ± 0.46 |
| Texture | Clay | Clay | Clay | Clay | Clay | Clay |
| Water content (%) | 43.70 ± 0.13 | 40.11 ± 2.25 | 43.64 ± 0.03 | 24.90 ± 0.06 | 39.37 ± 0.13 | 24.38 ± 0.27 |
| Organic matter (%) | 2.36 ± 0.08 | 3.19 ± 0.20 | 2.35 ± 0.05 | 6.40 ± 0.24 | 2.16 ± 0.32 | 7.07 ± 0.98 |
| Bulk density (g cm–3) | 1.00 ± 0.00 | 1.00 ± 0.00 | 1.01 ± 0.00 | 1.01 ± 0.01 | 1.02 ± 0.00 | 1.03 ± 0.00 |
| Hydraulic conductivity (cm hr–1) | 0.15 ± 0.01 | 0.19 ± 0.01 | 0.21 ± 0.04 | 0.30 ± 0.13 | 0.19 ± 0.04 | 0.54 ± 0.02 |
| pH | 3.20 ± 0.04 | 3.36 ± 0.04 | 3.34 ± 0.06 | 3.77 ± 0.01 | 3.39 ± 0.01 | 4.34 ± 0.01 |
| Electrical conductivity (mS cm–1) | 1.99 ± 0.01 | 2.07 ± 0.01 | 2.05 ± 0.01 | 2.18 ± 0.02 | 2.03 ± 0.01 | 2.32 ± 0.01 |
| Exchangeable Al3+ (cmolc kg–1) | 2.27 ± 0.15 | 2.07 ± 0.06 | 2.33 ± 0.15 | 1.63 ± 0.06 | 2.40 ± 0.10 | 1.37 ± 0.06 |
| Exchangeable H+ (cmolc kg–1) | 0.40 ± 0.10 | 0.80 ± 0.10 | 0.40 ± 0.10 | 0.57 ± 0.06 | 0.50 ± 0.10 | 0.57 ± 0.06 |
| Exchangeable Ca2+ (cmolc kg–1) | 1.64 ± 0.23 | 1.44 ± 0.08 | 1.64 ± 0.01 | 2.16 ± 0.09 | 1.64 ± 0.01 | 4.44 ± 0.01 |
| Exchangeable Mg2+ (cmolc kg–1) | 1.16 ± 0.03 | 1.64 ± 0.03 | 1.18 ± 0.01 | 2.39 ± 0.31 | 1.18 ± 0.02 | 2.68 ± 0.02 |
| Exchangeable Na+ (cmolc kg–1) | 1.21 ± 0.14 | 1.26 ± 0.08 | 1.34 ± 0.05 | 0.58 ± 0.08 | 1.43 ± 0.02 | 0.46 ± 0.05 |
| Exchangeable K+ (cmolc kg–1) | 1.80 ± 0.03 | 1.75 ± 0.02 | 1.98 ± 0.01 | 2.65 ± 0.53 | 1.82 ± 0.09 | 2.01 ± 0.01 |
| Cation exchange capacity (cmolc kg–1) | 8.48 ± 0.30 | 8.96 ± 0.17 | 8.86 ± 0.14 | 9.98 ± 0.34 | 8.98 ± 0.21 | 11.51 ± 0.08 |
| Base saturation (%) | 69 ± 1.84 | 68 ± 1.13 | 69 ± 1.30 | 78 ± 0.32 | 68 ± 0.40 | 83 ± 0.40 |
| Exchangeable sodium percentage (%) | 21 ± 2.56 | 21 ± 1.37 | 22 ± 0.64 | 7 ± 1.26 | 23 ± 0.27 | 5 ± 0.47 |
| Organic carbon (%) | 0.65 ± 0.11 | 0.67 ± 0.09 | 0.67 ± 0.09 | 3.14 ± 0.10 | 0.66 ± 0.11 | 4.13 ± 0.01 |
| Humic acid (%) | 0.05 ± 0.01 | 0.09 ± 0.01 | 0.10 ± 0.02 | 0.13 ± 0.01 | 0.15 ± 0.05 | 1.32 ± 0.01 |
| Fulvic acid (%) | 0.12 ± 0.01 | 0.13 ± 0.00 | 0.14 ± 0.01 | 0.25 ± 0.01 | 0.14 ± 0.01 | 0.19 ± 0.01 |
| Note: T0: Control plot; T1: Treated plot. | ||||||
DownLoad: CSV| SOM | HC | SS | Exc. Na+ | Exc. Ca2+ | pH | SWC | Exc. Al3+ | |
| SOM | 1 | |||||||
| HC | 0.896** | 1 | ||||||
| SS | 0.694* | 0.719** | 1 | |||||
| Exc. Na+ | 0.037 | 0.155 | –0.344 | 1 | ||||
| Exc. Ca2+ | 0.830** | 0.846** | 0.918** | –0.256 | 1 | |||
| pH | 0.706* | 0.843** | 0.561 | 0.522 | 0.651* | 1 | ||
| SWC | –0.977** | –0.849** | –0.605* | 0.011 | –0.761** | –0.582* | 1 | |
| Exc. Al3+ | –0.210 | –0.324 | 0.181 | –0.968** | 0.079 | –0.670* | 0.140 | 1 |
| Note: SOM: Soil Organic Matter; HC: Hydraulic Conductivity; SS: Soil Strength; SWC: Soil Water Content. *Significance level at 5% and **Significance level at 1%. |
||||||||
DownLoad: CSVIn this trial, electrical conductivity of the treated plot has also increased from 2.07 mS cm–1 to 2.32 mS cm–1. Thus, the classification of Landon [25] obtains that salt-free content in the soil is low. This low salt content will ease the paddy plants to absorb optimum water from the soil. The studied soil is sodic with high level of Na content and low level of total salts. High Na content in the soil is shown by the high exchangeable Na+. When the ratio of Na to other ions at these exchange sites is high, clay particles are less tightly bound to each other and the soil aggregates easily disperse when the soil become wet. To improve the exchangeable Na+ in soil, most of ions Na+ must be removed by leaching it downward, below the root zone [26]. To accomplish this result, ions Na+ in the soil exchange complex must be replaced by Ca2+. HTOC product is a calcium-containing material, which can supply soluble Ca2+ to replace the exchangeable Na+.
After HTOC application, exchangeable Na+ of the treated plot has decreased to 0.58 cmolc kg–1 after the first harvest and it changed at 0.46 cmolc kg–1 after the second harvest. Mean exchangeable Na+ of treated plot after the first and the second harvest is found significantly lower than control plot, with the value of p < 0.001 at 5% level. The presence of excessive amount of exchangeable Na+ reverses the process of aggregation and causes soil aggregates to disperse into their constituent individual soil particles. This is known as deflocculation and often occurs in sodic soil. The untreated soil is classified as sodic because the Exchangeable Sodium Percentage (ESP) value is greater than 6%. But after being treated with HTOC, the ESP value has decreased to less than 6% at the second harvest. Mean exchangeable sodium percentage of treated plot after the first and the second harvest is found significantly lower than control plot, with the value of p < 0.001 at 5% level. This is due to the polyvalent cations of Ca2+ and Mg2+ from HTOC have displaced ions Na+ in the soil and they created a flocculated soil condition.
Exchangeable Ca2+ of the treated plot increases from 1.44 cmolc kg–1 to 4.44 cmolc kg–1 after the second harvest. Exchangeable Mg2+ increases from 1.64 cmolc kg–1 to 2.68 cmolc kg–1 and from 1.89 cmolc kg–1 to 2.06 cmolc kg–1 after the second harvest. Exchangeable K+ also increases from 1.75 cmolc kg–1 to 2.65 cmolc kg–1 after the first harvest. Exchangeable Ca2+, Mg2+ and K+ are high due to addition of these cations from HTOC. The concentration of these cations in the soil are in the required level for rice cultivation as found by MARDI [27]. This shows that the use of HTOC at the appropriate rate is able to alleviate Ca and Mg deficiency in paddy soil. The presence of extra Ca and Mg in the soil can also contribute to the alleviation of Al toxicity. Hence, the cation exchange capacity has also increased from 8.93 cmolc kg–1 to 11.51 cmolc kg–1 with base saturation increased from 68% to 83% after the second harvest. Organic carbon content of the treated plot with HTOC has risen from 0.67% to 4.13% after the second harvest. Humic acid content has increased from 0.09% to 1.32%, while fulvic acid content relatively increased from 0.13% to 0.19% after the second harvest. The organic component consists of wood residuals from HTOC resulting in the increment of organic carbon, humic and fulvic acid content in the soil. Humic acid component from HTOC has acted to buffer the effect of high salts by dissolving Ca compounds that already presented in the soil. It flocculates the soil particles that have already dispersed to build the stable aggregates.
Application of HTOC in the study area shows the changes in soil physical properties as shown in Table 2. The initial water content of the paddy soil is high at 40.11%. This shows the high soil water will cause the reduction in macro pores spaces and lead to decline in load support capacity of the soil and permissible ground pressure [28]. Hence, soil water plays significant role in maintaining aggregate stability and tensile strength of soil aggregates [29]. But after being treated with HTOC, soil water content has decreased to 24.90% at the first harvest and it changed to 24.38% at the second harvest.
Mean soil water content of treated plot after the first and the second harvest is found significantly lower than control plot, with the value of p < 0.001 at 5% level. This mean a decrease in soil water content is due to the isolated components; zeolite and humic acid of HTOC which are capable to absorb the excess water in paddy soil. The zeolite material is useful for assisting water infiltration and retention due to its porous properties and the capillary suction.
The studied soil is sodic with fine particles (clay + silt) about 80%. Clay particles will be separated by the presence of water and exchangeable Na+, and it will reduce the water movement and the aeration in the soil. Thus, the water permeability of the soil is poor and the soil is also characterized with hard and cloddy appearances when dry and tends to crust. The initial water permeability of the soil is low as shown by the low hydraulic conductivity value. But after being treated with HTOC, it starts to increase from 0.19 cm hr–1 to 0.54 cm hr –1 after the second harvest. Mean hydraulic conductivity of treated plot after the first and the second harvest is found significantly higher than control plot, with the value of p < 0.001 at 5% level. This shows that the efficiency of HTOC which flocculates together with the clay particles to accelerate the aggregate formation. The stability of soil aggregate is prominent to water infiltration and retention for paddy soil. Hence, a decrease in soil aggregate stability results in low hydraulic conductivity value.
Organic matter content in the soil is low at 3.19% before started the trial, this is caused by the reduce presence of decaying organisms, or an increases rate of decay as a result of changes in natural or anthropogenic factors. Tillage is one of the anthropogenic factors to a decline in organic matter via contributing to an increase rate of organic matter decay [30]. Moreover, climate also affects soil organic matter content, so soil in warmer climates like in paddy area will tend to contain less organic matter than those in cooler climates [31]. Low organic matter results in low stability index, low soil quality and productivity, which make the soil more susceptible to dispersion. But after being treated with HTOC, the organic matter content in the soil increases to 6.40% after the first harvest. It continues increasing to 7.07% after the second harvest. Mean soil organic matter content of treated plot after the first harvest is found significantly higher than control plot, with the value of p < 0.001 at 5% level. A correlation matrix of all parameters studied reveals that soil organic matter is not significantly correlated to exchangeable Na+ (r = 0.037). Soil organic matter is positively and significantly correlated to hydraulic conductivity (r = 0.896 p < 0.01) and soil strength (r = 0.694 p < 0.05, Table 3). This shows that organic matter content in the soil become more significant after applying HTOC, as these organic matters attach to soil particles, especially clay particles and bind micro soil and macro soil aggregates, thus they prevent the soil from dispersing by the water pressure and also the action of heavy machines.
Previous study by Sahibin et al. [13] from the paddy field in Jelempok Region 1 MADA Kedah, Malaysia reports that organic matter content of the paddy soil which has been treated with HTOC was successfully raised from 6.51% to 7.87% and gave the same result with the current study. Soil organic matter content can be related to soil texture. For example, clay soils tend to have a higher organic matter content than sandy soils due to they have the ability to protect humus from the sequel decay process. In addition, soil water also contributes the effect on the organic matter content in soil. Organic matter content is negatively and significantly correlated to soil water content (r = – 0.977, p < 0.01, Table 3). Bulk density of the soil under investigation is found to be at the good level, which mean they can provide structural support for water and solute movement as well as aeration. After being treated with HTOC, bulk density of the soil increases from 1.00 g cm–3 to 1.03 g cm–3 after the second harvest period. The increment bulk density value of treated plot suggests to high soil porosity and relative low soil compaction. Organic carbon increases from 0.67% to 4.13% after the second harvest. Previous study by Razi et al. [32] reports the total soil carbon stock in this study area is around 475.72 ton ha–1.
The effect of HTOC on soil strength of soft soil is presented in Figure 4. The graphs of control plot and treated plot before planting period has increased continuously and it reached a peak 0.24 MPa at depth 0 to 50 cm and then decreased at depth 60–100 cm with the lowest strength value was found as only 0.20 MPa. This shows that the value measured is still below 0.40 MPa, this means that the land cannot support the surcharge load imposed by machinery equipment. But after being treated with HTOC, the graph of soil strength at the first harvest has raised to 0.62 MPa at depth 0 to 20 cm and it decreased to 0.42 MPa at depth 60 to 100 cm. The highest soil strength is recorded after the second harvest with value of 0.84 MPa at depth 0 to 30 cm. The hardpan is defined as the layer harder to penetrate and no roots, it usually finds between 10 cm and 30 cm from soil surface [33]. The increase in soil strength level is directly correlated with decrease in water potential. Relative water content is negatively and significantly correlated to soil strength (r = –0.605, p < 0.05, Table 3), while for exchangeable Na+ is not significantly correlated (r = –0.344). This mean an increase in soil strength and decrease soil water content and exchangeable Na+ as the quantity of HTOC is added to soil.
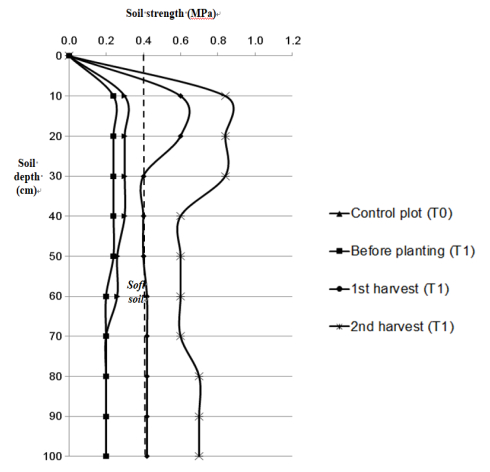 Figure 4. The effect of HTOC on soil strength.
Result of studies shows that the use of organic soil amendment like HTOC has a potential to improve of soft soil in paddy cultivation area by enhancing soil quality such as soil strength, organic matter content, hydraulic conductivity, pH, electrical conductivity, exchangeable Ca2+, Mg2+, K+ and cation exchange capacity to a range that is high soil stability index and productivity for paddy cultivation. As whole, soil properties of treated plot reports a better result than control plot. Besides, HTOC application also results in decreasing soil water content, exchangeable Na+ and exchangeable sodium percentage which were very important to mitigate soft soil problem. HTOC can successfully improve soil pH from 3.36 to 4.34.
The authors wish to thank The National University of Malaysia and the Faculty of Science and Technology for providing the infrastructure to ensure the success of this research. This research is conducted with UKM research grant ETP-2015-003. The study is conducted in MADA region in collaboration with MADA and Green Frontier Technology Sdn Bhd.
The authors declare no conflicts of interest in this paper.
| [1] |
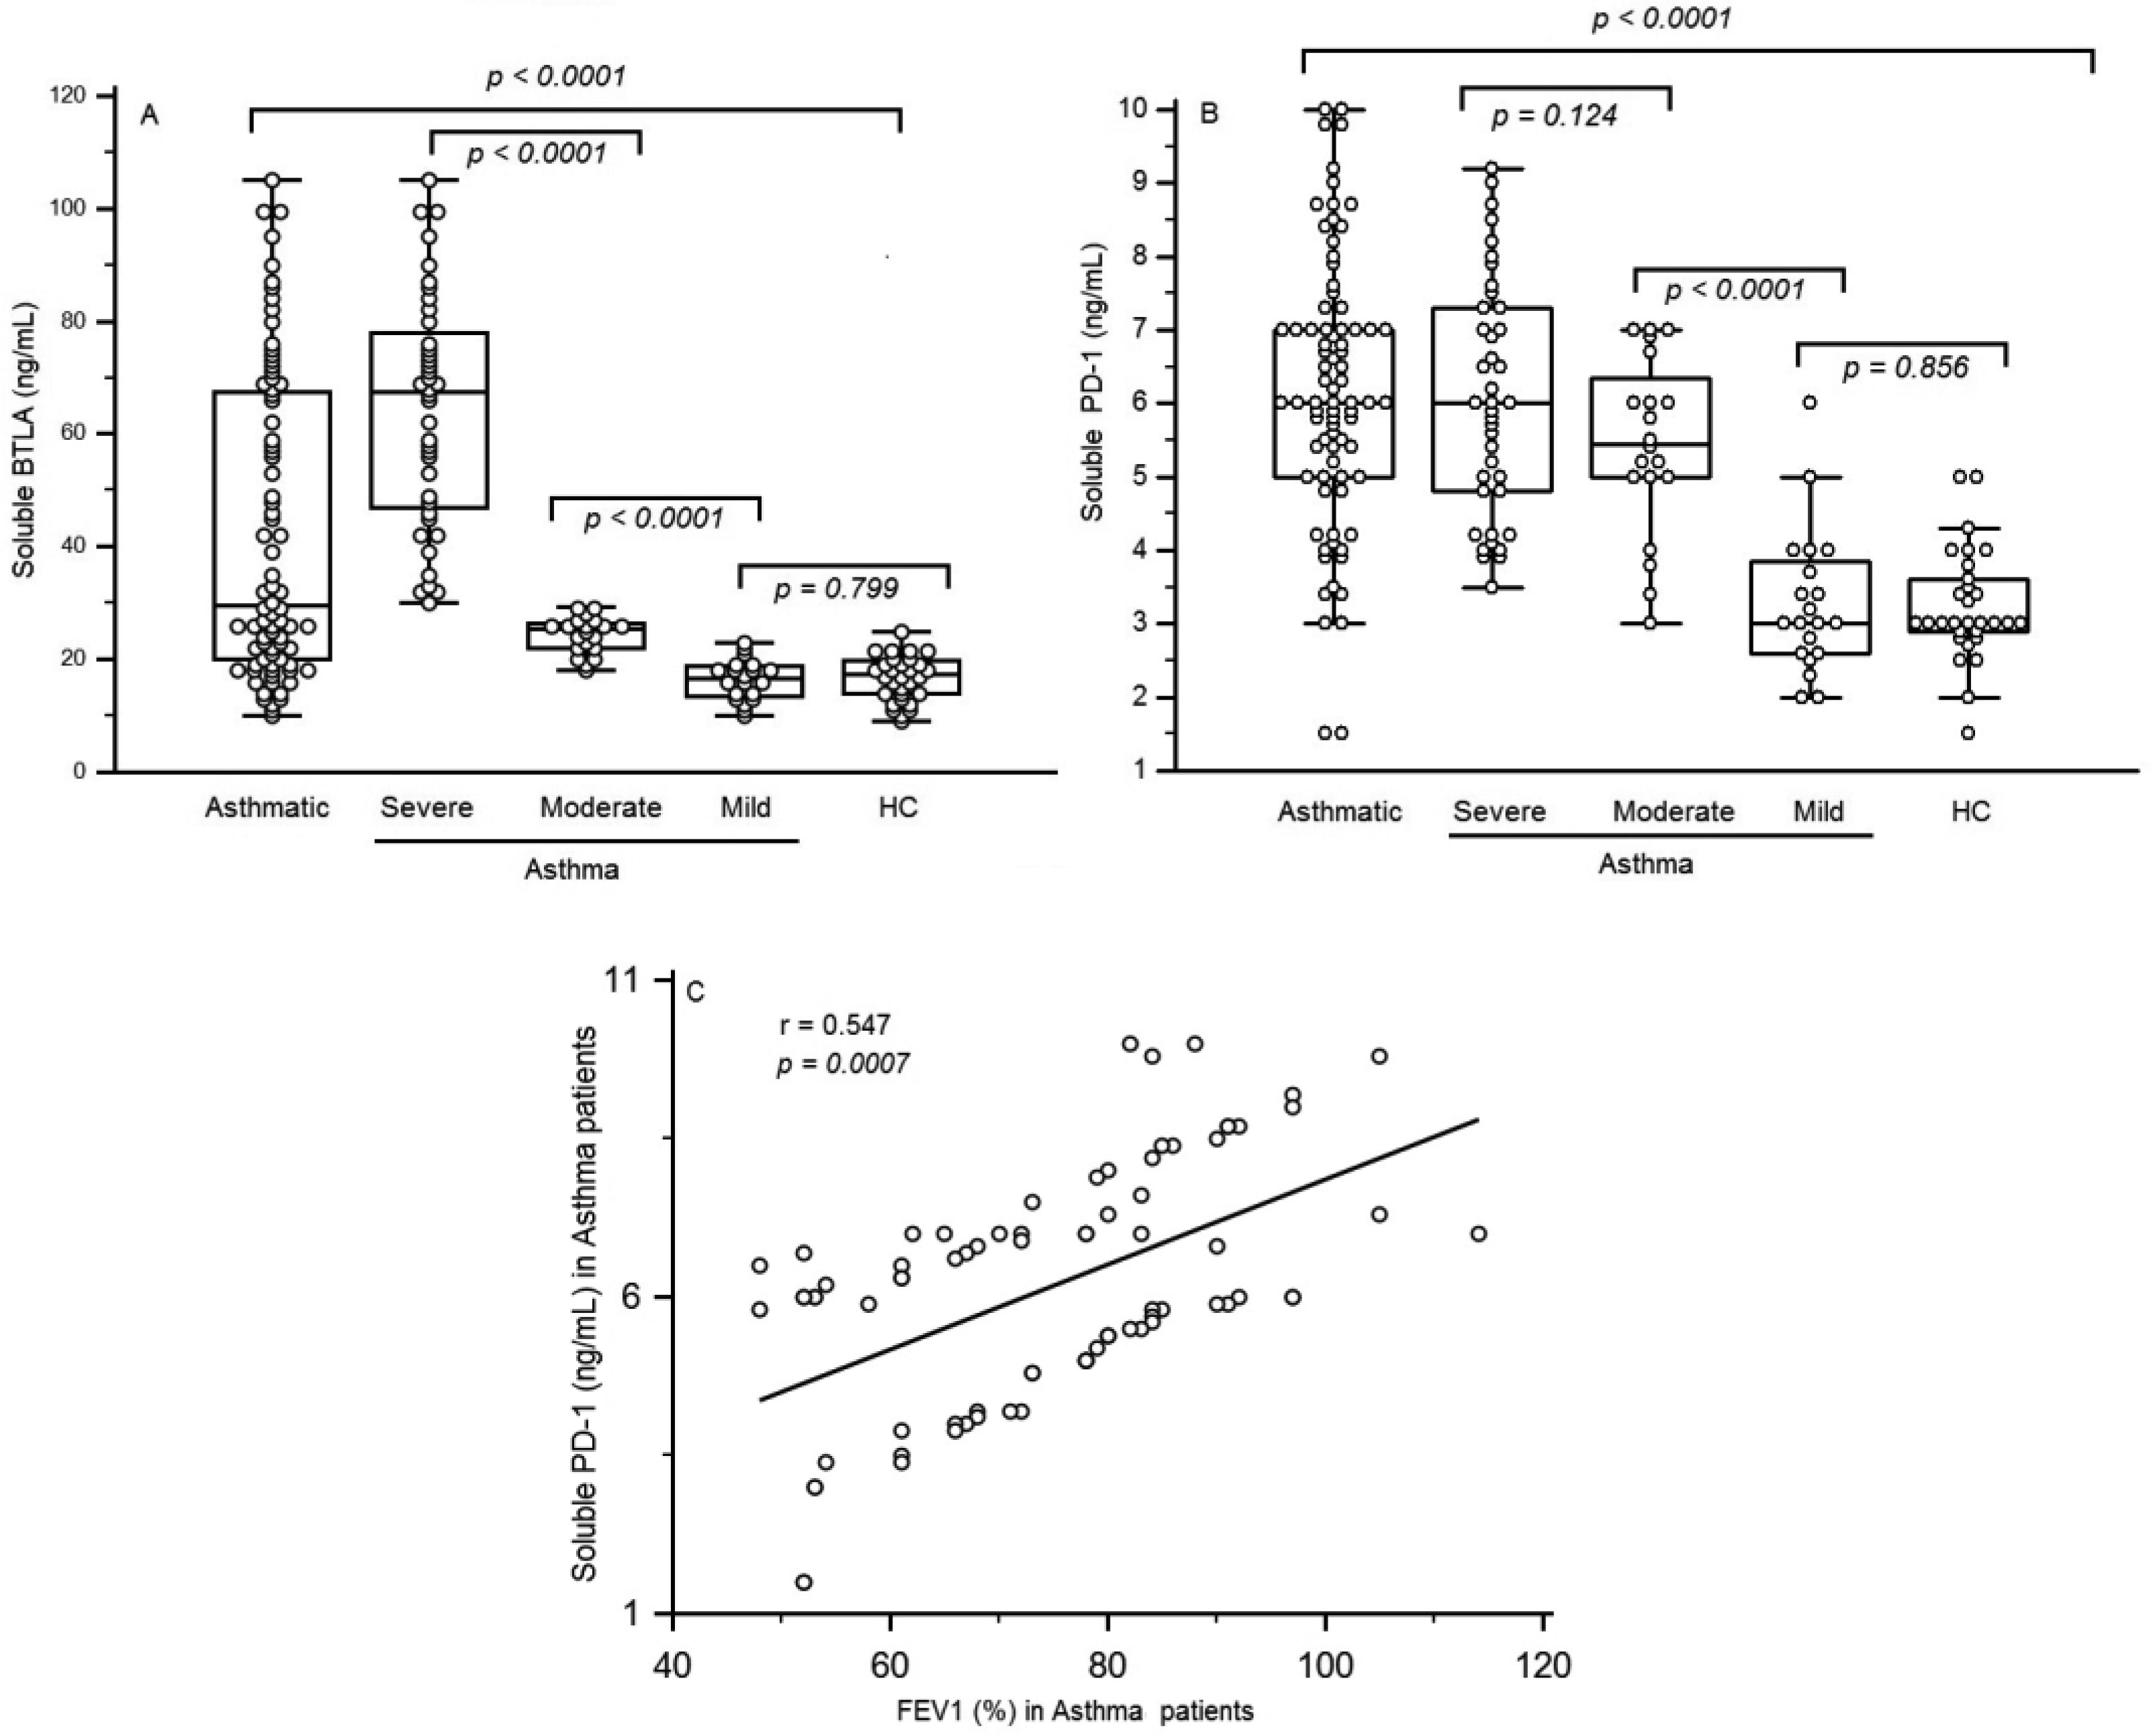
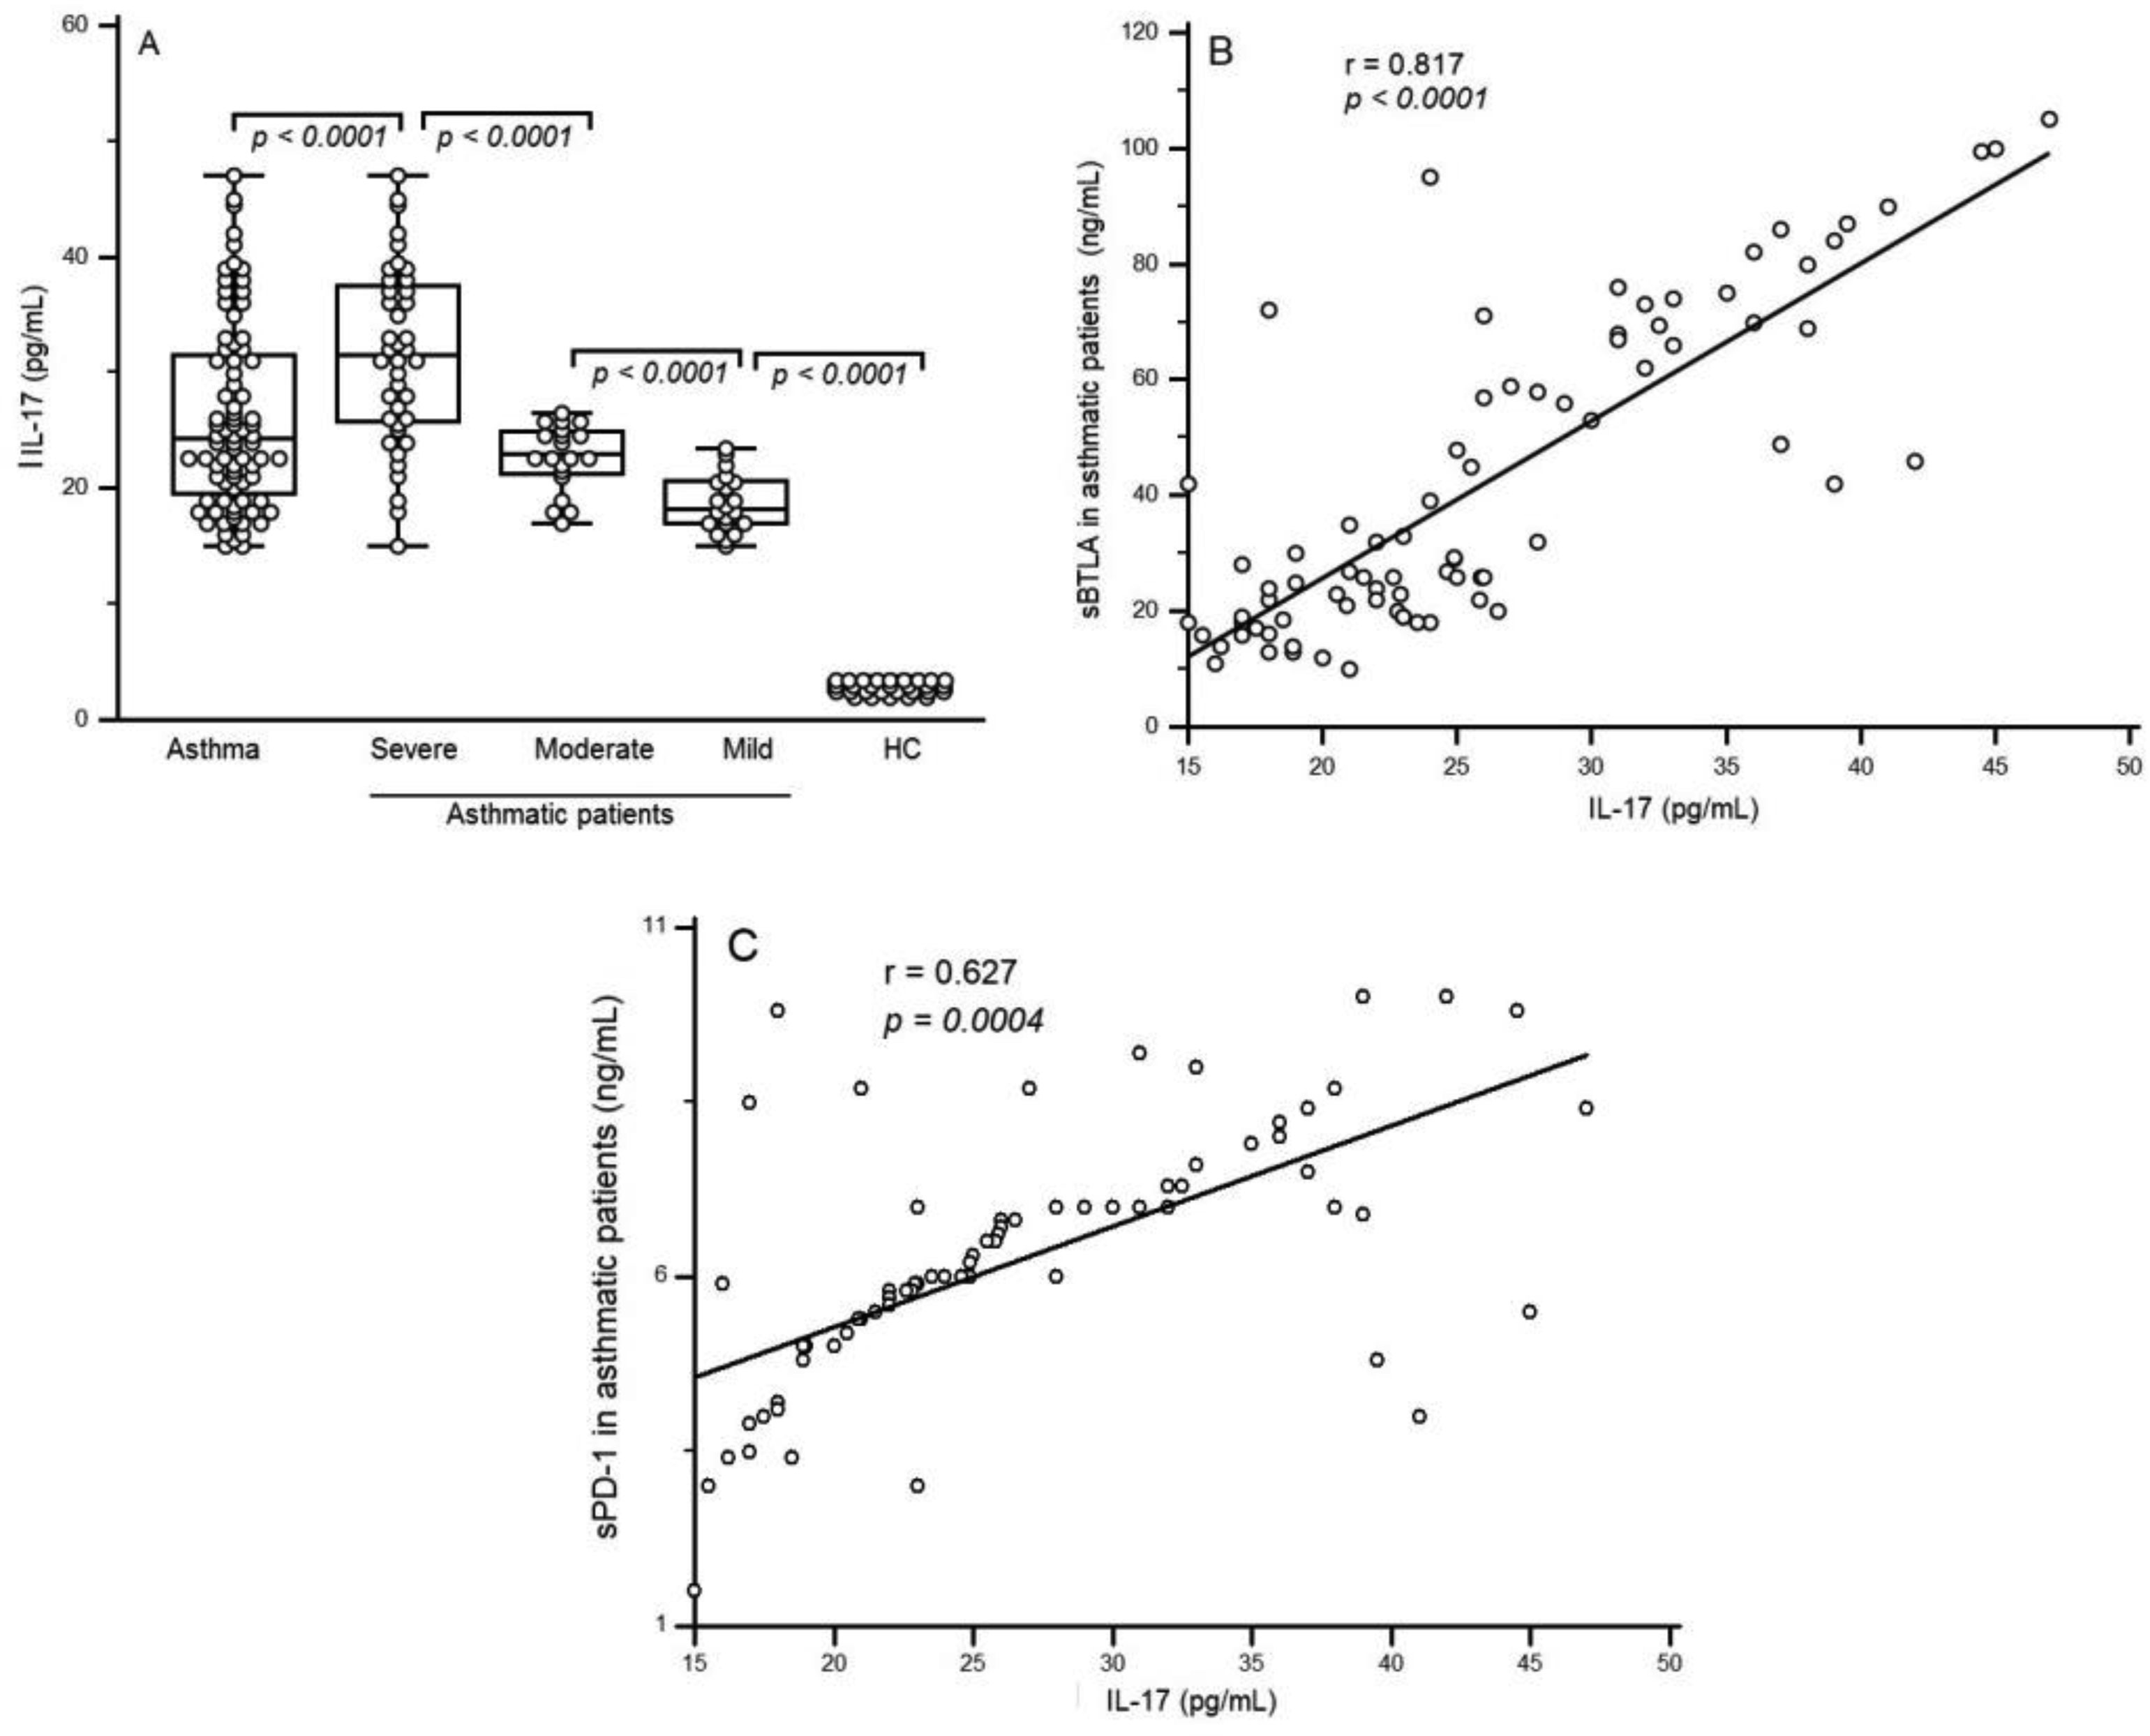
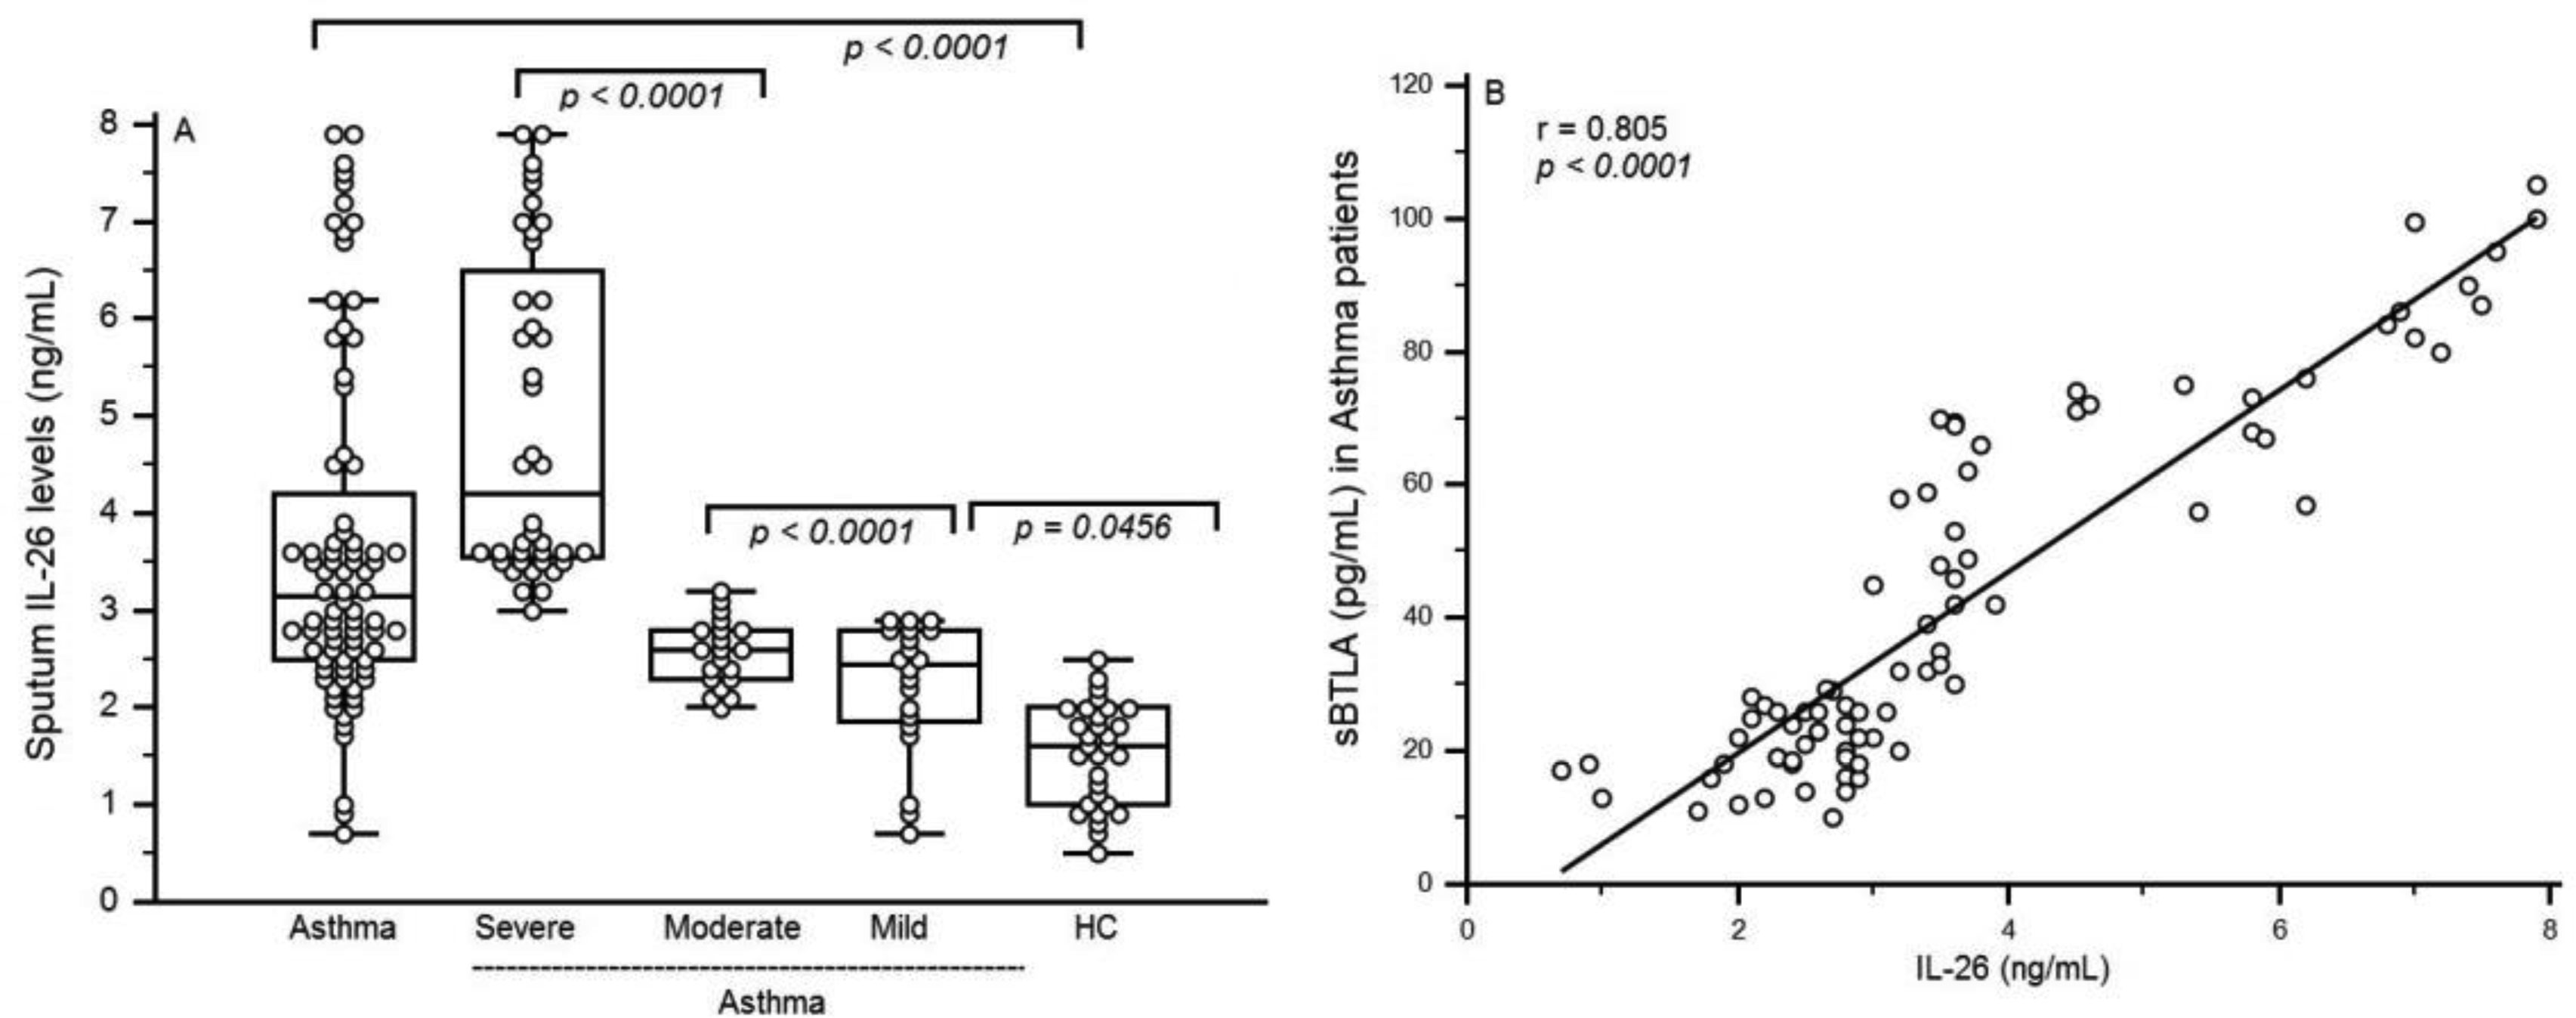
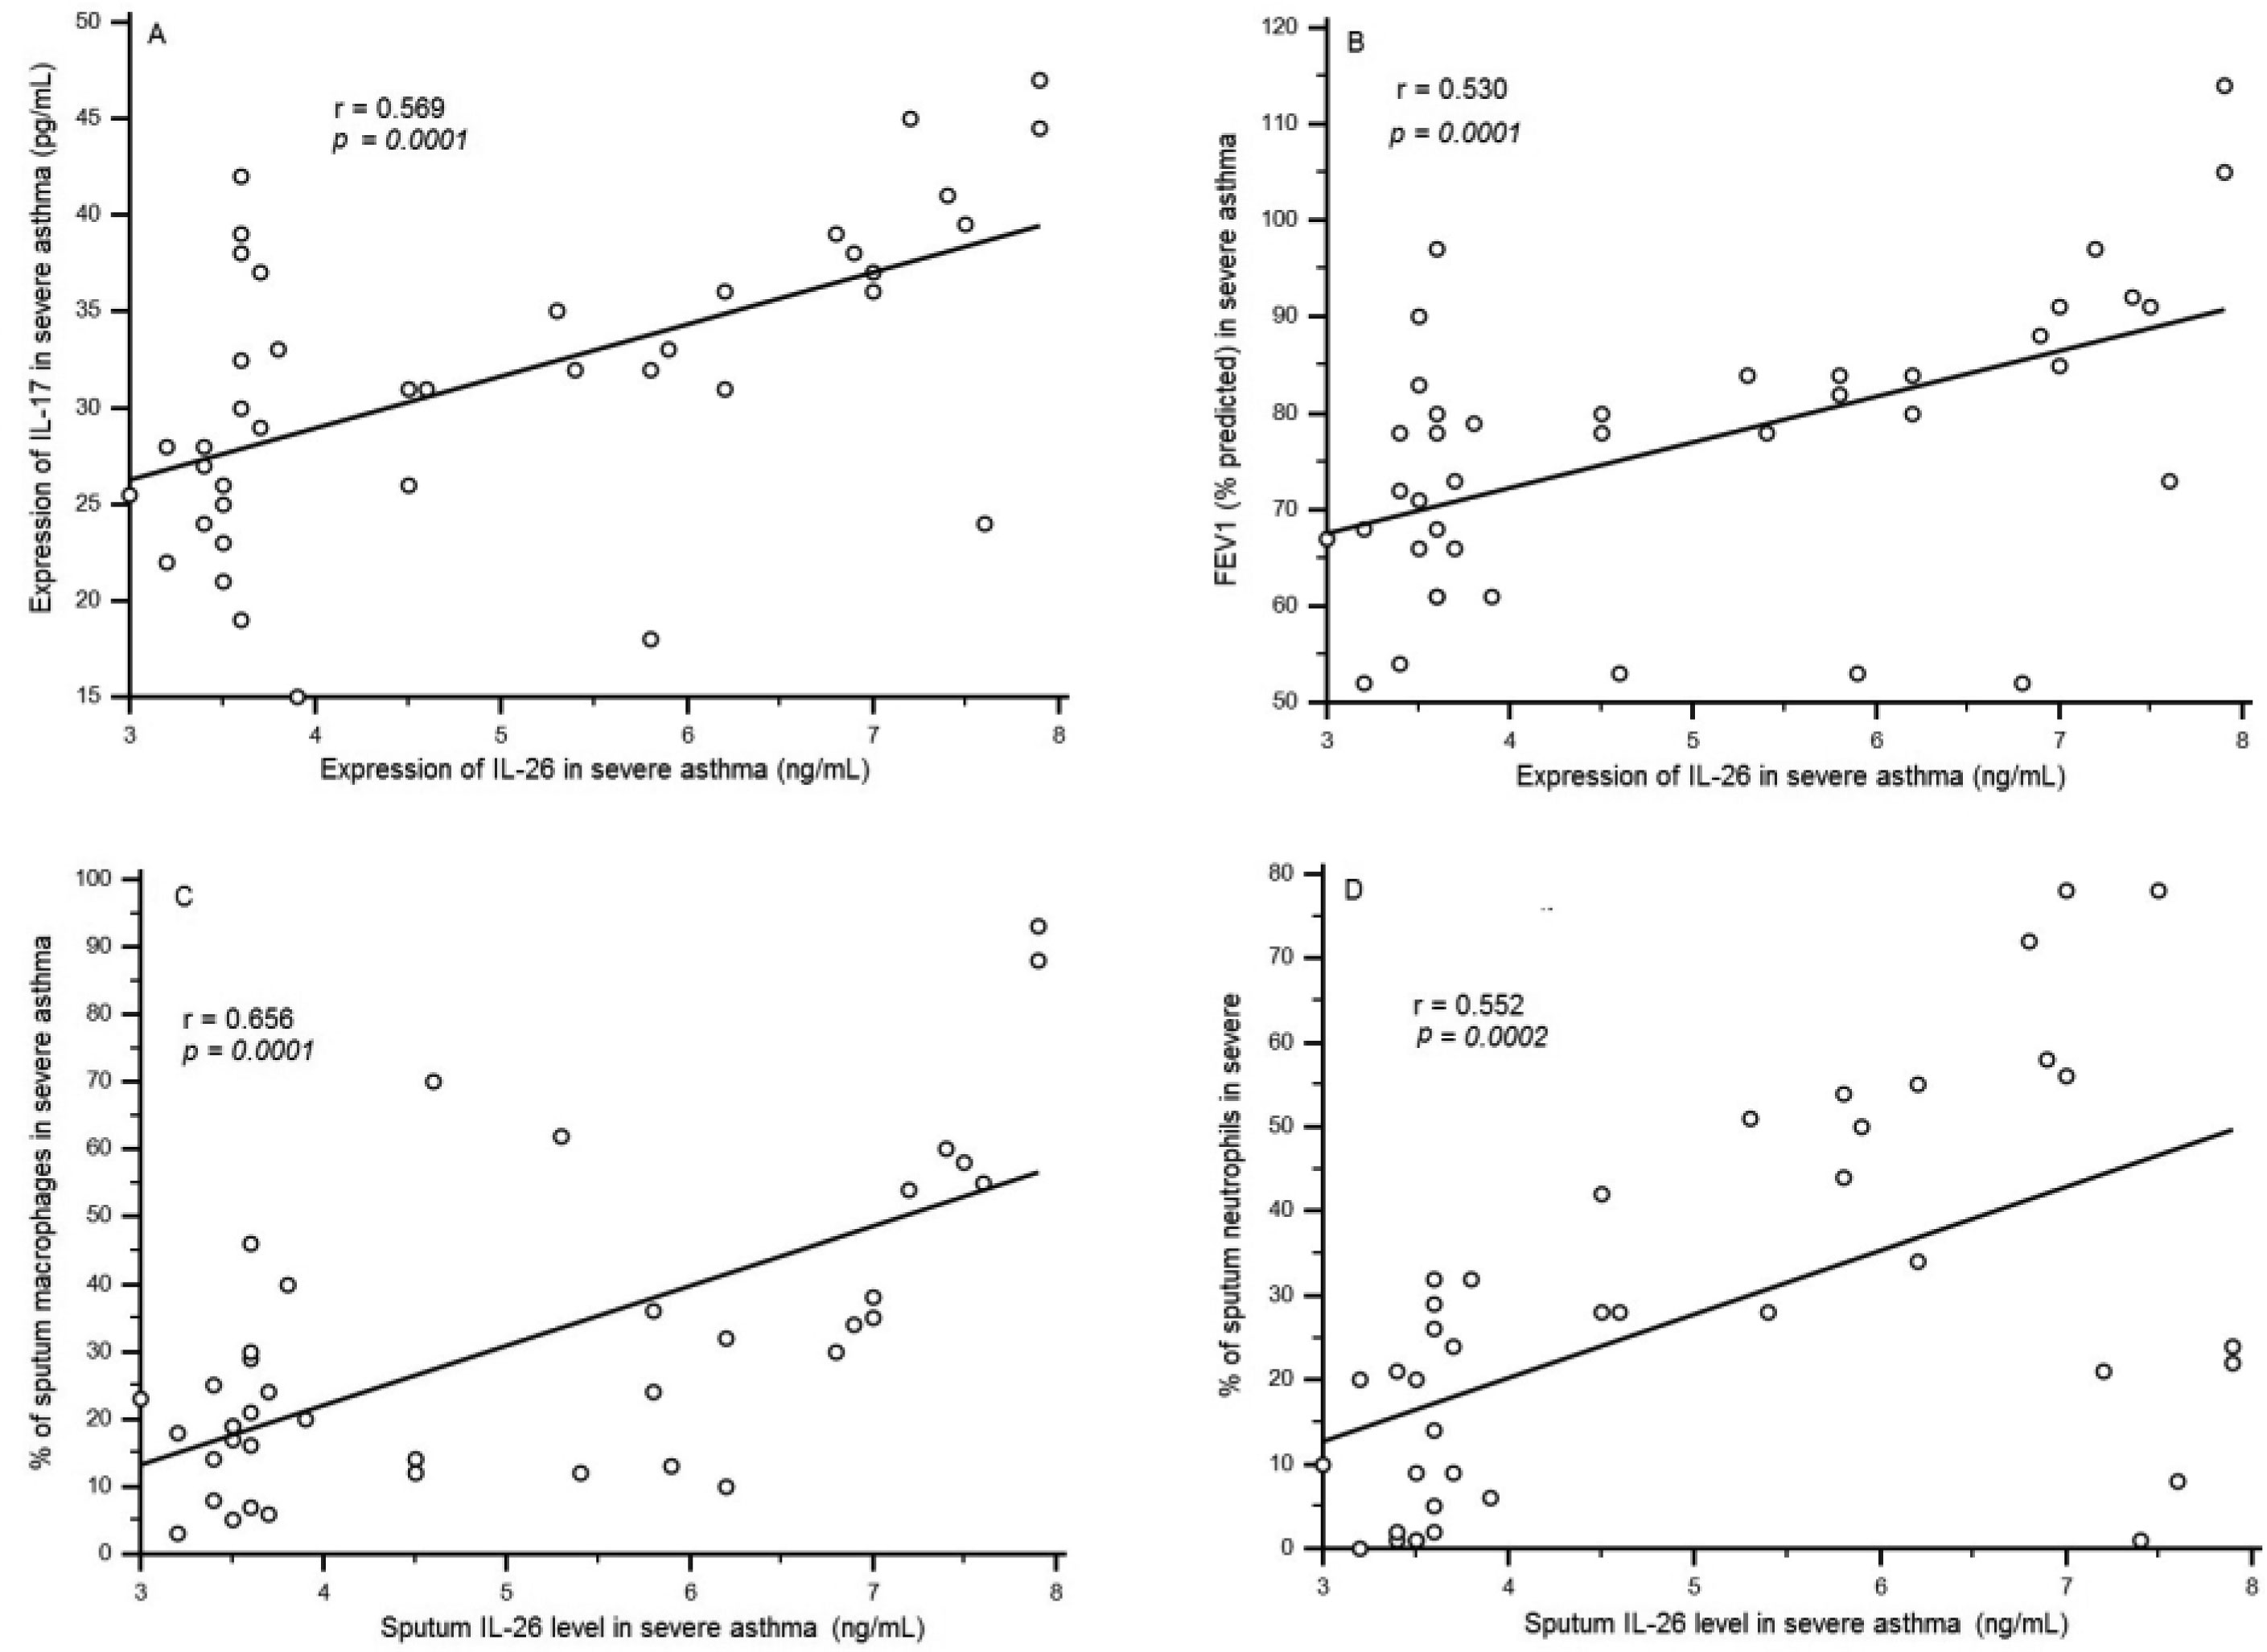
Cosmi L, Liotta F, Maggi L, et al. (2017) Role of Type 2 innate lymphoid cellsin allergic diseases. Curr Allergy Asthm R 17: 66–72. doi: 10.1007/s11882-017-0735-9

|
| [2] |
Galowitz S, Chang C (2015) Immunobiology of critical pediatric asthma. Clin Rev Allerg Immu 48: 84–96. doi: 10.1007/s12016-014-8409-z
|
| [3] |
Charrad R, Berraïes A, Hamdi B, et al. (2016) Anti-inflammatory activity of IL-37 in asthmatic children: Correlation with inflammatory cytokines TNF-α, IL-β, IL-6 and IL-17A. Immunobiology 221: 182–187. doi: 10.1016/j.imbio.2015.09.009
|
| [4] |
Bernard A, Lamy AL, Alberti I (2002) The two-signal model of T-cell activation after 30 years. Transplantation 73: S31–S35. doi: 10.1097/00007890-200201151-00011
|
| [5] | Boulougouris G, Mcleod JD, Patel YI, et al. (1998) Positive and negative regulation of human T cell activation mediated by the CTLA-4/CD28 ligand CD80. J Immunol 161: 3919–3924. |
| [6] |
Freeman GJ, Long AJ, Iwai Y, et al. (2000) Engagement of the PD-1immunoinhibitory receptor by a novel B7 family member leads to negative regulation of lymphocyte activation. J Exp Med 192: 1027–1034. doi: 10.1084/jem.192.7.1027
|
| [7] | Wang XF, Chen YJ, Wang Q, et al. (2007) Distinct expression and inhibitory function of B and T lymphocyte attenuator on human T cells. HLA 69: 145–153. |
| [8] |
Waterhouse P, Penninger JM, Timms E, et al. (1995) Lymphoproliferative disorders with early lethality in mice deficient in Ctla-4. Science 270: 985–988. doi: 10.1126/science.270.5238.985
|
| [9] |
Boomer JS, Jennifer SS, Hotchkiss RS, et al. (2012) A prospective analysis of lymphocyte phenotypeand function over the course of acute sepsis. Crit Care 16: R112. doi: 10.1186/cc11404
|
| [10] |
Van WC, Bateman ED, Bousquet J, et al. (2008) Asthma management pocket reference 2008. Allergy 63: 997–1004. doi: 10.1111/j.1398-9995.2008.01643.x
|
| [11] |
Berraïes A, Hamdi B, Ammar J, et al. (2016) Increased Expression of Thymic Stromal Lymphopoietin in induced sputum from asthmatic children. Immunol Lett 178: 85–91. doi: 10.1016/j.imlet.2016.08.004
|
| [12] |
Moermans C, Heinen V, Nguyen M, et al. (2011) Local and systemic cellular inflammation and cytokine release in chronic obstructive pulmonary disease. Cytokine 56: 298–304. doi: 10.1016/j.cyto.2011.07.010
|
| [13] |
Delvaux M, Henket M, Lau L, et al. (2004) Nebulised salbutamol administered during sputum induction improves bronchoprotection in patients with asthma. Thorax 59: 111–115. doi: 10.1136/thorax.2003.011130
|
| [14] |
Kaabachi W, Berraïes A, Dhifallh IB, et al. (2017) Interleukin-26 is overexpressed in Behçet's disease and enhances Th17 related -cytokines. Immunol Lett 190: 177–184. doi: 10.1016/j.imlet.2017.08.008
|
| [15] |
Wang X, Zhu G, Huang Z, et al. (2012) Application of monoclonal antibodies in a sandwich enzyme-linked immunosorbent assay for identification and detection of soluble human B and T lymphocyte attenuator. Hybridoma 31: 417–423. doi: 10.1089/hyb.2012.0052
|
| [16] |
Cai G, Freeman GJ (2009) The CD160, BTLA, LIGHT/HVEM pathway: a bidirectional switch regulating T-cell activation. Immunol Rev 229: 244–258. doi: 10.1111/j.1600-065X.2009.00783.x
|
| [17] |
Oaks MK, Hallett KM, Penwell RT, et al. (2000) A native soluble form of CTLA-4. Cell Immunol 201: 144–153. doi: 10.1006/cimm.2000.1649
|
| [18] |
Nielsen C, Ohm-Laursen L, Barington T, et al. (2005) Alternative splice variants of the human PD-1 gene. Cell Immunol 235: 109–116. doi: 10.1016/j.cellimm.2005.07.007
|
| [19] |
Magistrelli G, Jeannin P, Herbault N, et al. (1999) A soluble form of CTLA-4 generated by alternative splicing is expressed by nonstimulated human T cells. Eur J Immunol 29: 3596–3602. doi: 10.1002/(SICI)1521-4141(199911)29:11<3596::AID-IMMU3596>3.0.CO;2-Y
|
| [20] | Chesné J, Braza F, Mahay G, et al. (2014) IL-17 in severe asthma. Where do we stand? Am J Respir Crit Care Med 190: 1094–1101. |
| [21] |
Bullens DM, Truyen E, Coteur L, et al. (2006) IL-17 mRNA in sputum of asthmatic patients: linking T cell driven inflammation and granulocytic influx? Resp Res 7: 135. doi: 10.1186/1465-9921-7-135
|
| [22] |
Wu H, Miao M, Zhang G, et al. (2009) Soluble PD-1 isassociated with aberrant regulation of T cells activation in aplasticanemia. Immunol Invest 38: 408–421. doi: 10.1080/08820130902912332
|
| [23] |
Song MY, Park SH, Nam HJ, et al. (2011) Enhancementof vaccine-induced primary and memory CD8(+) T-cell responsesby soluble PD-1. J Immunother 34: 297–306. doi: 10.1097/CJI.0b013e318210ed0e
|
| [24] |
Kuipers H, Muskens F, Willart M, et al. (2006) Contribution of the PD-1 ligands/PD-1 signaling pathway to dendritic cell-mediated CD4+ T cell activation. Eur J Immunol 36: 2472–2482. doi: 10.1002/eji.200635978
|
| [25] | Hasegawa T, Uga H, Mori A, et al. (2017) Increased serum IL-17A and Th2 cytokinelevels in patients with severe uncontrolled asthma. Eur Cytokine Netw 28: 8–18. |
| [26] |
Pyle CJ, Uwadiae FI, Swieboda DP, et al. (2017) Early IL-6 signalling promotesIL-27 dependent maturation of regulatory T cells in the lungs and resolution ofviral immunopathology. PLoS Pathog 13: e1006640. doi: 10.1371/journal.ppat.1006640
|
| [27] |
Maalmi H, Beraies A, Charad R, et al. (2014) IL-17A and IL-17F genes variants and susceptibility to childhood asthma in Tunisia. J Asthma 51: 348–354. doi: 10.3109/02770903.2013.876647
|
| [28] | Charrad R, Kaabachi W, Berraies A, et al. (2017) IL-33 gene variants and protein expression in pediatric Tunisian asthmatic patients. Cytokine 11: 32. |
| [29] |
Chen JH, Qin L, Shi YY, et al. (2016) IL-17 protein levels in both induced sputum and plasma are increased in stable but not acute asthma individuals with obesity. Resp Med 121: 48–58. doi: 10.1016/j.rmed.2016.10.018
|
| [30] |
Lindén A, Dahlén B (2014) Interleukin-17 cytokine signalling in patients with asthma. Eur Respir J 44: 1319–1331. doi: 10.1183/09031936.00002314
|
| [31] |
Ricciardolo FL, Sorbello V, Folino A, et al. (2017) Identification of IL-17F/frequent exacerbator endotype in asthma. J Allergy Clin Immunol 140: 395–406. doi: 10.1016/j.jaci.2016.10.034
|
| [32] |
Griffiths KL, Khader SA (2014) Bringing in the cavalry: IL-26 mediates neutrophil recruitment to the lungs. Am J Respir Crit Care Med 190: 1079–1080. doi: 10.1164/rccm.201410-1870ED
|
| [33] |
Ohnuma K, Hatano R, Aune TM, et al. (2015). Regulation of pulmonary graft-versus-host disease by IL- 26+CD26+CD4 T lymphocytes. J Immunol 194: 3697–3712. doi: 10.4049/jimmunol.1402785
|
| [34] |
Burlingham WJ, Love RB, Jankowskagan E, et al. (2007) IL-17-dependent cellular immunity to collagen Type V predisposes to obliterative bronchiolitis in human lung transplants. J Clin Invest 117: 3498–3506. doi: 10.1172/JCI28031
|
| [35] |
Che KF, Tengvall S, Levanen B, et al. (2014) Interleukin-26 in antibacterial host defense of human lungs. Effects on neutrophil mobilization. Am J Respir Crit Care Med 190: 1022–1031. doi: 10.1164/rccm.201404-0689OC
|
| [36] |
Elgaili AA, Nzungize L, Duan X, et al. (2016) Interleukin-10 family and tuberculosis: Old story renewed. Int J Biol Sci 12: 710–717. doi: 10.7150/ijbs.13881
|
| [37] |
Charrad R, Kaabachi W, Rafrafi A, et al. (2017) IL-8 gene variants and expression in childhood asthma. Lung 195: 1–9. doi: 10.1007/s00408-016-9960-6
|
| 1. | Muhammad Rendana, Wan Mohd Razi Idris, Sahibin Abdul Rahim, Zulfahmi Ali Rahman, Tukimat Lihan, Characterization of physical, chemical and microstructure properties in the soft clay soil of the paddy field area, 2021, 18, 2356-1424, 81, 10.20961/stjssa.v18i1.50489 | |
| 2. | Muhammad Rendana, Wan Mohd Razi Idris, Sahibin Abdul Rahim, Zulfahmi Ali Rahman, Tukimat Lihan, Rubber bark dust-zeolite composite improved mechanic strength of soft paddy soil through improved microstructure, 2021, 18, 2356-1424, 194, 10.20961/stjssa.v18i2.56345 | |
| 3. | Xuqing Li, Yao Su, Temoor Ahmed, Haiying Ren, Muhammad Rizwan Javed, Yanlai Yao, Qianli An, Jianli Yan, Bin Li, Effects of Different Organic Fertilizers on Improving Soil from Newly Reclaimed Land to Crop Soil, 2021, 11, 2077-0472, 560, 10.3390/agriculture11060560 | |
| 4. | A D F Firstyadi, B S Wignyosukarto, S Purboseno, Post reclamation of acid sulphate soil due to extended tidal irrigation area in Palingkau, Central Kalimantan, Indonesia, 2021, 930, 1755-1307, 012017, 10.1088/1755-1315/930/1/012017 | |
| 5. | Muhammad Rendana, Wan Mohd Razi Idris, Sahibin Abdul Rahim, Zulfahmi Ali Rahman, Tukimat Lihan, Predicting soil erosion potential under CMIP6 climate change scenarios in the Chini Lake Basin, Malaysia, 2023, 10, 2196-4092, 10.1186/s40562-022-00254-7 | |
| 6. | Muhammad Rendana, Wan Mohd Razi Idris, Sahibin Abdul Rahim, Hazem Ghassan Abdo, Hussein Almohamad, Ahmed Abdullah Al Dughairi, Flood risk and shelter suitability mapping using geospatial technique for sustainable urban flood management: a case study in Palembang city, South Sumatera, Indonesia, 2023, 2474-9508, 1, 10.1080/24749508.2023.2205717 | |
| 7. | Xuqing Li, Daoze Wang, Qiujun Lu, Zhongling Tian, Jianli Yan, Effects of SMOF on soil properties, root-zone microbial community structure, metabolites, and maize (Zea mays L.) response on a reclaimed barren mountainous land, 2023, 14, 1664-302X, 10.3389/fmicb.2023.1181245 | |
| 8. | Muhammad Rendana, Wan Mohd Razi Idris, Sahibin Abdul Rahim, Hazem Ghassan Abdo, Hussein Almohamad, Ahmed Abdullah Al Dughairi, Jasem A. Albanai, Effects of the built-up index and land surface temperature on the mangrove area change along the southern Sumatra coast, 2023, 2158-0103, 1, 10.1080/21580103.2023.2220576 | |
| 9. | Muhammad Rendana, Wan Mohd Razi Idris, Sahibin Abdul Rahim, Hazem Ghassan Abdo, Hussein Almohamad, Ahmed Abdullah Al Dughairi, Habitat suitability analysis in a natural peat swamp forest on Sumatran elephants using remote sensing and GIS, 2023, 2158-0103, 1, 10.1080/21580103.2023.2234463 | |
| 10. | Farkhanda Naz, Muhammad Arif, Tan Xue, Changxiao Li, Artificially remediated plants impact soil physiochemical properties along the riparian zones of the three gorges dam in China, 2024, 7, 2624-893X, 10.3389/ffgc.2024.1301086 | |
| 11. | Edna Mary Varghese, Babanpreet Kour, S. Ramya, Pooja D. Krishna, K.A. Nazla, K. Sudheer, K.N. Anith, M.S. Jisha, B. Ramakrishnan, Rice in acid sulphate soils: Role of microbial interactions in crop and soil health management, 2024, 196, 09291393, 105309, 10.1016/j.apsoil.2024.105309 |
Figures(4) / Tables(2)

Sabrine Louhaichi, Mariem Salhi, Anissa Berraïes, Besma Hamdi, Jamel Ammar, Kamel Hamzaoui, Agnès Hamzaoui. Co-inhibitory receptors in female asthmatic patients: Correlation with IL-17 and IL-26[J]. AIMS Allergy and Immunology, 2018, 2(1): 10-23. doi: 10.3934/Allergy.2018.1.10

| Parameter | Value |
| Organic matter (%) | 41.59 ± 0.02 |
| pH | 7.98 ± 0.01 |
| Electrical conductivity (mS cm–1) | 3.50 ± 0.81 |
| Total C (%) | 25.80 ± 0.01 |
| Total N (%) | 0.89 ± 0.01 |
| C:N | 29:1 ± 0.01 |
| Exchangeable H+ (cmolc kg–1) | 0.00 |
| Exchangeable Al3+ (cmolc kg–1) | 0.57 ± 0.25 |
| Exchangeable K+ (cmolc kg–1) | 6.98 ± 0.85 |
| Exchangeable Mg2+ (cmolc kg–1) | 3.93 ± 0.28 |
| Exchangeable Ca2+ (cmolc kg–1) | 5.18 ± 0.21 |
| Exchangeable Na+ (cmolc kg–1) | 3.21 ± 0.12 |
| Cation exchange capacity (cmolc kg–1) | 20.81 ± 1.48 |
| Base saturation (%) | 97 |
| Humic acid (%) | 4.59 ± 0.31 |
| Fulvic acid (%) | 0.19 ± 0.01 |
DownLoad: CSV| Parameter | Periods | |||||
| Before planting (May 2016) | 1st harvest (Sept 2016) | 2nd harvest (Feb 2017) | ||||
| T0 | T1 | T0 | T1 | T0 | T1 | |
| Sand (%) | 13 ± 0.36 | 13 ± 0.62 | 11 ± 0.47 | 12 ± 0.59 | 13 ± 3.84 | 13 ± 0.07 |
| Silt (%) 0.063–0.002 mm | 38 ± 1.06 | 31 ± 2.50 | 39 ± 0.20 | 32 ± 3.15 | 34 ± 9.65 | 30 ± 0.53 |
| Clay (%) < 0.002 mm | 49 ± 0.73 | 56 ± 2.45 | 50 ± 0.27 | 56 ± 2.57 | 52 ± 5.83 | 57 ± 0.46 |
| Texture | Clay | Clay | Clay | Clay | Clay | Clay |
| Water content (%) | 43.70 ± 0.13 | 40.11 ± 2.25 | 43.64 ± 0.03 | 24.90 ± 0.06 | 39.37 ± 0.13 | 24.38 ± 0.27 |
| Organic matter (%) | 2.36 ± 0.08 | 3.19 ± 0.20 | 2.35 ± 0.05 | 6.40 ± 0.24 | 2.16 ± 0.32 | 7.07 ± 0.98 |
| Bulk density (g cm–3) | 1.00 ± 0.00 | 1.00 ± 0.00 | 1.01 ± 0.00 | 1.01 ± 0.01 | 1.02 ± 0.00 | 1.03 ± 0.00 |
| Hydraulic conductivity (cm hr–1) | 0.15 ± 0.01 | 0.19 ± 0.01 | 0.21 ± 0.04 | 0.30 ± 0.13 | 0.19 ± 0.04 | 0.54 ± 0.02 |
| pH | 3.20 ± 0.04 | 3.36 ± 0.04 | 3.34 ± 0.06 | 3.77 ± 0.01 | 3.39 ± 0.01 | 4.34 ± 0.01 |
| Electrical conductivity (mS cm–1) | 1.99 ± 0.01 | 2.07 ± 0.01 | 2.05 ± 0.01 | 2.18 ± 0.02 | 2.03 ± 0.01 | 2.32 ± 0.01 |
| Exchangeable Al3+ (cmolc kg–1) | 2.27 ± 0.15 | 2.07 ± 0.06 | 2.33 ± 0.15 | 1.63 ± 0.06 | 2.40 ± 0.10 | 1.37 ± 0.06 |
| Exchangeable H+ (cmolc kg–1) | 0.40 ± 0.10 | 0.80 ± 0.10 | 0.40 ± 0.10 | 0.57 ± 0.06 | 0.50 ± 0.10 | 0.57 ± 0.06 |
| Exchangeable Ca2+ (cmolc kg–1) | 1.64 ± 0.23 | 1.44 ± 0.08 | 1.64 ± 0.01 | 2.16 ± 0.09 | 1.64 ± 0.01 | 4.44 ± 0.01 |
| Exchangeable Mg2+ (cmolc kg–1) | 1.16 ± 0.03 | 1.64 ± 0.03 | 1.18 ± 0.01 | 2.39 ± 0.31 | 1.18 ± 0.02 | 2.68 ± 0.02 |
| Exchangeable Na+ (cmolc kg–1) | 1.21 ± 0.14 | 1.26 ± 0.08 | 1.34 ± 0.05 | 0.58 ± 0.08 | 1.43 ± 0.02 | 0.46 ± 0.05 |
| Exchangeable K+ (cmolc kg–1) | 1.80 ± 0.03 | 1.75 ± 0.02 | 1.98 ± 0.01 | 2.65 ± 0.53 | 1.82 ± 0.09 | 2.01 ± 0.01 |
| Cation exchange capacity (cmolc kg–1) | 8.48 ± 0.30 | 8.96 ± 0.17 | 8.86 ± 0.14 | 9.98 ± 0.34 | 8.98 ± 0.21 | 11.51 ± 0.08 |
| Base saturation (%) | 69 ± 1.84 | 68 ± 1.13 | 69 ± 1.30 | 78 ± 0.32 | 68 ± 0.40 | 83 ± 0.40 |
| Exchangeable sodium percentage (%) | 21 ± 2.56 | 21 ± 1.37 | 22 ± 0.64 | 7 ± 1.26 | 23 ± 0.27 | 5 ± 0.47 |
| Organic carbon (%) | 0.65 ± 0.11 | 0.67 ± 0.09 | 0.67 ± 0.09 | 3.14 ± 0.10 | 0.66 ± 0.11 | 4.13 ± 0.01 |
| Humic acid (%) | 0.05 ± 0.01 | 0.09 ± 0.01 | 0.10 ± 0.02 | 0.13 ± 0.01 | 0.15 ± 0.05 | 1.32 ± 0.01 |
| Fulvic acid (%) | 0.12 ± 0.01 | 0.13 ± 0.00 | 0.14 ± 0.01 | 0.25 ± 0.01 | 0.14 ± 0.01 | 0.19 ± 0.01 |
| Note: T0: Control plot; T1: Treated plot. | ||||||
DownLoad: CSV| SOM | HC | SS | Exc. Na+ | Exc. Ca2+ | pH | SWC | Exc. Al3+ | |
| SOM | 1 | |||||||
| HC | 0.896** | 1 | ||||||
| SS | 0.694* | 0.719** | 1 | |||||
| Exc. Na+ | 0.037 | 0.155 | –0.344 | 1 | ||||
| Exc. Ca2+ | 0.830** | 0.846** | 0.918** | –0.256 | 1 | |||
| pH | 0.706* | 0.843** | 0.561 | 0.522 | 0.651* | 1 | ||
| SWC | –0.977** | –0.849** | –0.605* | 0.011 | –0.761** | –0.582* | 1 | |
| Exc. Al3+ | –0.210 | –0.324 | 0.181 | –0.968** | 0.079 | –0.670* | 0.140 | 1 |
| Note: SOM: Soil Organic Matter; HC: Hydraulic Conductivity; SS: Soil Strength; SWC: Soil Water Content. *Significance level at 5% and **Significance level at 1%. |
||||||||
DownLoad: CSV| Parameter | Value |
| Organic matter (%) | 41.59 ± 0.02 |
| pH | 7.98 ± 0.01 |
| Electrical conductivity (mS cm–1) | 3.50 ± 0.81 |
| Total C (%) | 25.80 ± 0.01 |
| Total N (%) | 0.89 ± 0.01 |
| C:N | 29:1 ± 0.01 |
| Exchangeable H+ (cmolc kg–1) | 0.00 |
| Exchangeable Al3+ (cmolc kg–1) | 0.57 ± 0.25 |
| Exchangeable K+ (cmolc kg–1) | 6.98 ± 0.85 |
| Exchangeable Mg2+ (cmolc kg–1) | 3.93 ± 0.28 |
| Exchangeable Ca2+ (cmolc kg–1) | 5.18 ± 0.21 |
| Exchangeable Na+ (cmolc kg–1) | 3.21 ± 0.12 |
| Cation exchange capacity (cmolc kg–1) | 20.81 ± 1.48 |
| Base saturation (%) | 97 |
| Humic acid (%) | 4.59 ± 0.31 |
| Fulvic acid (%) | 0.19 ± 0.01 |
| Parameter | Periods | |||||
| Before planting (May 2016) | 1st harvest (Sept 2016) | 2nd harvest (Feb 2017) | ||||
| T0 | T1 | T0 | T1 | T0 | T1 | |
| Sand (%) | 13 ± 0.36 | 13 ± 0.62 | 11 ± 0.47 | 12 ± 0.59 | 13 ± 3.84 | 13 ± 0.07 |
| Silt (%) 0.063–0.002 mm | 38 ± 1.06 | 31 ± 2.50 | 39 ± 0.20 | 32 ± 3.15 | 34 ± 9.65 | 30 ± 0.53 |
| Clay (%) < 0.002 mm | 49 ± 0.73 | 56 ± 2.45 | 50 ± 0.27 | 56 ± 2.57 | 52 ± 5.83 | 57 ± 0.46 |
| Texture | Clay | Clay | Clay | Clay | Clay | Clay |
| Water content (%) | 43.70 ± 0.13 | 40.11 ± 2.25 | 43.64 ± 0.03 | 24.90 ± 0.06 | 39.37 ± 0.13 | 24.38 ± 0.27 |
| Organic matter (%) | 2.36 ± 0.08 | 3.19 ± 0.20 | 2.35 ± 0.05 | 6.40 ± 0.24 | 2.16 ± 0.32 | 7.07 ± 0.98 |
| Bulk density (g cm–3) | 1.00 ± 0.00 | 1.00 ± 0.00 | 1.01 ± 0.00 | 1.01 ± 0.01 | 1.02 ± 0.00 | 1.03 ± 0.00 |
| Hydraulic conductivity (cm hr–1) | 0.15 ± 0.01 | 0.19 ± 0.01 | 0.21 ± 0.04 | 0.30 ± 0.13 | 0.19 ± 0.04 | 0.54 ± 0.02 |
| pH | 3.20 ± 0.04 | 3.36 ± 0.04 | 3.34 ± 0.06 | 3.77 ± 0.01 | 3.39 ± 0.01 | 4.34 ± 0.01 |
| Electrical conductivity (mS cm–1) | 1.99 ± 0.01 | 2.07 ± 0.01 | 2.05 ± 0.01 | 2.18 ± 0.02 | 2.03 ± 0.01 | 2.32 ± 0.01 |
| Exchangeable Al3+ (cmolc kg–1) | 2.27 ± 0.15 | 2.07 ± 0.06 | 2.33 ± 0.15 | 1.63 ± 0.06 | 2.40 ± 0.10 | 1.37 ± 0.06 |
| Exchangeable H+ (cmolc kg–1) | 0.40 ± 0.10 | 0.80 ± 0.10 | 0.40 ± 0.10 | 0.57 ± 0.06 | 0.50 ± 0.10 | 0.57 ± 0.06 |
| Exchangeable Ca2+ (cmolc kg–1) | 1.64 ± 0.23 | 1.44 ± 0.08 | 1.64 ± 0.01 | 2.16 ± 0.09 | 1.64 ± 0.01 | 4.44 ± 0.01 |
| Exchangeable Mg2+ (cmolc kg–1) | 1.16 ± 0.03 | 1.64 ± 0.03 | 1.18 ± 0.01 | 2.39 ± 0.31 | 1.18 ± 0.02 | 2.68 ± 0.02 |
| Exchangeable Na+ (cmolc kg–1) | 1.21 ± 0.14 | 1.26 ± 0.08 | 1.34 ± 0.05 | 0.58 ± 0.08 | 1.43 ± 0.02 | 0.46 ± 0.05 |
| Exchangeable K+ (cmolc kg–1) | 1.80 ± 0.03 | 1.75 ± 0.02 | 1.98 ± 0.01 | 2.65 ± 0.53 | 1.82 ± 0.09 | 2.01 ± 0.01 |
| Cation exchange capacity (cmolc kg–1) | 8.48 ± 0.30 | 8.96 ± 0.17 | 8.86 ± 0.14 | 9.98 ± 0.34 | 8.98 ± 0.21 | 11.51 ± 0.08 |
| Base saturation (%) | 69 ± 1.84 | 68 ± 1.13 | 69 ± 1.30 | 78 ± 0.32 | 68 ± 0.40 | 83 ± 0.40 |
| Exchangeable sodium percentage (%) | 21 ± 2.56 | 21 ± 1.37 | 22 ± 0.64 | 7 ± 1.26 | 23 ± 0.27 | 5 ± 0.47 |
| Organic carbon (%) | 0.65 ± 0.11 | 0.67 ± 0.09 | 0.67 ± 0.09 | 3.14 ± 0.10 | 0.66 ± 0.11 | 4.13 ± 0.01 |
| Humic acid (%) | 0.05 ± 0.01 | 0.09 ± 0.01 | 0.10 ± 0.02 | 0.13 ± 0.01 | 0.15 ± 0.05 | 1.32 ± 0.01 |
| Fulvic acid (%) | 0.12 ± 0.01 | 0.13 ± 0.00 | 0.14 ± 0.01 | 0.25 ± 0.01 | 0.14 ± 0.01 | 0.19 ± 0.01 |
| Note: T0: Control plot; T1: Treated plot. | ||||||
| SOM | HC | SS | Exc. Na+ | Exc. Ca2+ | pH | SWC | Exc. Al3+ | |
| SOM | 1 | |||||||
| HC | 0.896** | 1 | ||||||
| SS | 0.694* | 0.719** | 1 | |||||
| Exc. Na+ | 0.037 | 0.155 | –0.344 | 1 | ||||
| Exc. Ca2+ | 0.830** | 0.846** | 0.918** | –0.256 | 1 | |||
| pH | 0.706* | 0.843** | 0.561 | 0.522 | 0.651* | 1 | ||
| SWC | –0.977** | –0.849** | –0.605* | 0.011 | –0.761** | –0.582* | 1 | |
| Exc. Al3+ | –0.210 | –0.324 | 0.181 | –0.968** | 0.079 | –0.670* | 0.140 | 1 |
| Note: SOM: Soil Organic Matter; HC: Hydraulic Conductivity; SS: Soil Strength; SWC: Soil Water Content. *Significance level at 5% and **Significance level at 1%. |
||||||||


