
Citation: Michael D. Caponegro, Jeremy Tetsuo Miyauchi, Stella E. Tsirka. Contributions of immune cell populations in the maintenance, progression, and therapeutic modalities of glioma[J]. AIMS Allergy and Immunology, 2018, 2(1): 24-44. doi: 10.3934/Allergy.2018.1.24
[1] | Wenjun Xia, Jinzhi Lei . Formulation of the protein synthesis rate with sequence information. Mathematical Biosciences and Engineering, 2018, 15(2): 507-522. doi: 10.3934/mbe.2018023 |
[2] | Jacques Demongeot, Jules Waku, Olivier Cohen . Combinatorial and frequency properties of the ribosome ancestors. Mathematical Biosciences and Engineering, 2024, 21(1): 884-902. doi: 10.3934/mbe.2024037 |
[3] | Robert P. Gilbert, Philippe Guyenne, Ying Liu . Modeling of the kinetics of vitamin D$_3$ in osteoblastic cells. Mathematical Biosciences and Engineering, 2013, 10(2): 319-344. doi: 10.3934/mbe.2013.10.319 |
[4] | Mohamad Al Bannoud, Tiago Dias Martins, Silmara Aparecida de Lima Montalvão, Joyce Maria Annichino-Bizzacchi, Rubens Maciel Filho, Maria Regina Wolf Maciel . Integrating biomarkers for hemostatic disorders into computational models of blood clot formation: A systematic review. Mathematical Biosciences and Engineering, 2024, 21(12): 7707-7739. doi: 10.3934/mbe.2024339 |
[5] | Carsten Conradi, Elisenda Feliu, Maya Mincheva . On the existence of Hopf bifurcations in the sequential and distributive double phosphorylation cycle. Mathematical Biosciences and Engineering, 2020, 17(1): 494-513. doi: 10.3934/mbe.2020027 |
[6] | Wenhao Chen, Guo Lin, Shuxia Pan . Propagation dynamics in an SIRS model with general incidence functions. Mathematical Biosciences and Engineering, 2023, 20(4): 6751-6775. doi: 10.3934/mbe.2023291 |
[7] | Gerasimos G. Rigatos, Efthymia G. Rigatou, Jean Daniel Djida . Change detection in the dynamics of an intracellular protein synthesis model using nonlinear Kalman filtering. Mathematical Biosciences and Engineering, 2015, 12(5): 1017-1035. doi: 10.3934/mbe.2015.12.1017 |
[8] | S. Hossein Hosseini, Marc R. Roussel . Analytic delay distributions for a family of gene transcription models. Mathematical Biosciences and Engineering, 2024, 21(6): 6225-6262. doi: 10.3934/mbe.2024273 |
[9] | Wang-Ren Qiu, Qian-Kun Wang, Meng-Yue Guan, Jian-Hua Jia, Xuan Xiao . Predicting S-nitrosylation proteins and sites by fusing multiple features. Mathematical Biosciences and Engineering, 2021, 18(6): 9132-9147. doi: 10.3934/mbe.2021450 |
[10] | Siddhartha Kundu . Mathematical model of a short translatable G-quadruplex and an assessment of its relevance to misfolding-induced proteostasis. Mathematical Biosciences and Engineering, 2020, 17(3): 2470-2493. doi: 10.3934/mbe.2020135 |
Production of proteins is one of most fundamental cellular processes, taking up to 75% of cellular resources in terms of chemical energy, in simple microbes [1]. The transcription-translation process description, mentioning only the most basic "elementary" processes, consists in:
1. production of mRNA molecules (including splicing),
2. initiation of these molecules with help of initiation factors (e.g., the initiation can include the circularization step though it is not universally required),
3. initiation of translation, recruiting the small ribosomal subunit,
4. assembly of full ribosomes,
5. elongation, i.e. movement of ribosomes along mRNA with production of protein,
6. termination of translation,
7. degradation of mRNA molecules,
8. degradation of proteins
Despite quite "linear" description of this process, a difficulty in the kinetic modeling of it arises when one tries to take into account the phenomenon of polysome [2,3], when several ribosomes are synthesizing peptides on a single mRNA at the same time. This leads to multiplicity of possible states of mRNA with various ribosome numbers and potentially different dynamics, interaction between ribosomes and other complex phenomena. This difficulty was evident already in the first published mathematical models of protein synthesis [4,5,6].
The process of protein synthesis and translation is a subject of mathematical modeling since long time ago starting from detailed kinetic models [4,5,7], taking into account stochastic aspects of translation [8] and using computer simulations for the case of large polysomes [9]. A number of chemical kinetics-based models of protein synthesis have been developed and analyzed in the last four decades [10,11,12]. Beyond chemical kinetics, various modeling formalisms such as Totally Asymmetric Simple Exclusion Process (TASEP) [13,14,15], Probabilistic Boolean Networks (PBN) [16], Petri Nets and max-plus algebra [17] have been applied to model the detailed kinetics of protein synthesis or some of its stages [18].
In the context of specific questions and applications of mathematical modeling to translation, dealing with detailed kinetic description of translation might be not optimal, and simplified models of translation can become more suitable. Thus, few attempts have been made in order to simplify the detailed kinetic description of protein synthesis. For example, two simple kinetic models of translation were introduced before in [19] and analyzed in detail in [20]. However, they were introduced without strict derivation from the detailed translation kinetics and did not allow taking into account neither degradation of mRNA nor existence of polysomes. Ad hoc simplified models of protein synthesis have been exploited for addressing specific contexts of translation regulation [21,22,23]. Using simplified models allows more direct determination of the most important control parameters of protein translation regulation.
We share the point of view that "useful models are simple and extendable" [24]. Following this paradigm, one needs to create the simplest kinetic model of protein synthesis and suggest a way to complexify it if needed to address a particular observation. Despite very long history of the mathematical modeling of protein synthesis, to our knowledge, no basic and simple kinetic description of the process, directly and formally derived from its detailed representation, was suggested until so far. This is the gap we close in this study.
In the following we start with a (1) detailed mechanistic description of the translation process with explicit representation of every state of translated mRNA, followed by (2) deriving the simplest and basic kinetic model of coupled transcription, translation and degradation, and (3) extending the model in order to take into account various effects. In this paper, the extensions will describe the saturation of mRNA initiation rate and the regulation of translation by microRNA.
The basic model is constructed by (1) correct lumping of the detailed model states and by (2) separating the descriptions of ribosomal turnover and the translation initiation through introducing a variable representing the pool of translating ribosomes. The simplest model remains linear under assumption of that the local concentrations of ribosomal subunits or initiation factors remain constant or their values change relatively slowly. To avoid non-physiological properties (such as a possibility of infinite number of ribosomes per mRNA), we modify the model by introducing delays in the initiation of ribosome and the effects of ribosome interactions. In this form, the model becomes more realistic but non-linear in some extensions.
Let us introduce the following notations:
L – length of mRNA (in nucleotides);
${l}_{m}$– length occupied on mRNA by fully assembled ribosome (in nucleotides);
${k}_{t}$– rate constant of production of mRNA molecules;
${k}_{d}$– rate constant of degradation of mRNA molecules;
${k}_{r}$– speed of movement of translating ribosome along mRNA (nucleotise/sec);
IF – various initiation factors;
S40 – small ribosome component;
S60 – large ribosome component.
Further we will use squared brackets to denote the concentrations of the corresponding molecular species: for example, [S40] will denote the local concentration of S40 ribosomal subunits. For the amounts of the components we keep the same notations as for the components themselves. Thus, R is amount of amount of ribosomes and the total amount of mRNA molecules is MT.
The simplest assumption about the production and destruction of mRNA is that the degradation process does not depend on the state of mRNA. Under this assumption the total pool of mRNAs is produced at rate ${k}_{t}$${}_{\ }$ and destroyed with rate constant ${k}_{d}$, i.e. its dynamics is simple and autonomous:
$ \frac{dMT}{dt} = k_{t} -k_{d} \times [MT] . $ |
It is worth to notice that the production rate ${k}_{t\ }$ is an extensive quantity (it scales with the total volume of the system) whereas all rate constants are intensive ones.
The total pool of mRNA molecules can be separated in sub-pools of mRNA molecules in different states:
${R}_{0}$– mRNA molecules in non-initiated state (not ready for translation)
$\underline R _{0}$– mRNA molecules in initiated state (ready for translation, with 40S subunit sitting at the mRNA)
${R}_{1}$– mRNA molecules with one single ribosome assembled and moving along the mRNA
$\underline R _{1}$– mRNA molecules with one ribosome assembled and initiated for new incoming ribosome
${R}_{2}$– mRNA molecules with two ribosomes assembled and moving along the mRNA
$\underline R _{2}$– mRNA molecules with two ribosomes assembled and initiated for new incoming ribosome
${\dots}$.
${R}_{nmax}$– mRNA molecules with nmax ribosomes assembled and moving along the mRNA
$\underline R _{nmax}$– mRNA molecules with nmax ribosomes assembled and initiated for new incoming ribosome
The sum of all sub-pools of mRNA should be equal to MT:
$ MT\; {\rm = \; }\sum \limits_{i = 0}^{nmax}{\rm (}R_{i} +\underline{R}_{i} )$ |
The number nmax is defined as the maximum number of ribosomes able to sit on mRNA: it may be roughly evaluated as
$nmax = L / l_{m}. $ | (2.1) |
Schematically, the process of translation can be represented as in Figure 1.
The time of passage of one ribosome along mRNA may be evaluated as
$tp=L/kr, $
|
(2.2) |
hence, the reaction rate constant of protein production and subsequent release of ribosomes from mRNA (shown in Figure 1 by backward arrows) may be evaluated as:
$k3=kr/L. $
|
(2.3) |
The transformation of states is described by the following chemical equations:
${R}_{i}→
$\underline R _{i}→$$Ri
${R}_{i}→$$Ri
$\underline R _{i}→
${R}_{i}→$$Ri
$\underline R _{i}→
To avoid using 2 $\mathrm{\times}$ (nmax+1) states (which potentially can be large) to represent translation, we lump the description of the detailed process in the following way. We denote
M – amount of mRNA with translation initiation site not occupied by assembling ribosome,
F – amount of mRNA with translation initiation site occupied by assembling ribosome,
R – amount of ribosomes sitting on mRNA synthesizing proteins,
P – amount of proteins.
In terms of $\underline R _{i} $and$Ri
$ M = \sum _{i = 0}^{nmax}R{}_{i}$, $ F{\rm = }\sum _{i = 0}^{nmax}\underline{R}_{i}$ and MT = M + F.
There are two lumped reactions and two reactions representing the turnover of ribosomes (as a result of translation termination and protein synthesis or spontaneous ribosome drop-off from mRNA without protein production):
M$\mathrm{\to}$F with reaction rate constant ${k}_{1}$,
F$\mathrm{\to}$M +R with reaction rate constant ${k}_{2}$,
R $\mathrm{\to}$ null with reaction rate constant ${k}_{3\ }$.
R $\mathrm{\to}$ null with reaction rate constant ${k}_{rd}$ +k ${}_{d}$ (ribosome drop-off and degradation without protein production).
The reaction network describing transcription, translation and mRNA degradation is represented in Figure 2. We will denote this model as $\mathfrak{M} 0$.
The corresponding list of equations is
$
{∙M=kt−kdM−k1M+k2F∙F=k1M−kdF−k2F∙R=k2F−k3R−krdR−kdR∙P=k3R−kpP
$
|
(2.4) |
which has the following solution for zero initial condition M(0) = F(0) = R(0) = P(0) = 0
$ M(t) = \frac{k_{t} }{k_{d} } \frac{k_{2} (k_{1} +k_{2} +k_{d} )(1-e^{-k_{d} t} )+k_{1} k_{d} (1-e^{-(k_{1} +k_{2} +k_{d} )t} )}{(k_{1} +k_{2} +k_{d} )(k_{1} +k_{2} )} {\kern 1pt} , $ |
$ F(t) = \frac{k_{t} }{k_{d} } \frac{1}{(k_{1} +k_{2} +k_{d} )(k_{1} +k_{2} )} \left[k_{1} (k_{2} +k_{d} )-k_{1} (k_{1} +k_{2} +k_{d} )e^{-k_{d} t} +k_{1} k_{d} e^{-(k_{1} +k_{2} +k_{d} )t} \right] $ |
$ R(t)=ktkdk1k2(k3+krd+kd)(k1+k2+kd)×[1−(k3+krd+kd)(k1+k2+kd)(k3+krd)(k1+k2)e−kdt+(k3+krd+kd)kd(k3+krd−k1−k2)(k1+k2)e−(k1+k2+kd)t+(k1+k2+kd)kd(k3+krd−k1−k2)(k3+krd)e−(k3+krd+kd)t], $
|
$P(t)=ktkdk1k2k3kp(k1+k2+kd)(k3+krd+kd)[1−αde−kdt+α12e−(k1+k2+kd)t+α3e−(k3+krd+kd)t−αpe−kpt], $
|
(2.5) |
$ \alpha _{d}^{} = \frac{(k_{3} +k_{rd} +k_{d} )(k_{1} +k_{2} +k_{d} )}{(k_{3} +k_{rd} )(k_{1} +k_{2} )} \frac{k_{p} }{k_{p} -k_{d} } , \; \alpha _{12}^{} = \frac{(k_{3} +k_{rd} +k_{d} )k_{d} }{(k_{3} +k_{rd} -k_{1} -k_{2} )(k_{1} +k_{2} )} \frac{k_{p} }{k_{p} -k_{d} -k_{1} -k_{2} } , \;$ |
$ \alpha _{3}^{} = \frac{(k_{1} +k_{2} +k_{d} )k_{d} }{(k_{3} +k_{rd} -k_{1} -k_{2} )(k_{3} +k_{rd} )} \frac{k_{p} }{k_{p} -k_{d} -k_{3} -k_{rd} } , \; \alpha _{P}^{} = 1-\alpha _{d}^{} +\alpha _{3}^{} +\alpha _{12}^{}$ |
The simplest model $\mathfrak{M}0$ can be made more complex if some particular aspects of translation are needed to be represented in more details. Below we build several such modifications. In the model $\mathfrak{M}0$ we explicitly model the first round of mRNA initiation which can be longer than the consequent rounds of 40S recruitment and production of translating ribosomes in the pool. In the model $\mathfrak{M}1$ we explicitly model the step of binding of 40S and 60S subunits to mRNA. In the model $\mathfrak{M} 1'$ we also explicitly add the binding of the initiation factors. In the model $\mathfrak{M}0$ 'reg we introduce the effect of irreversible binding of a regulatory molecule to mRNA which can be, for example, a microRNA.
An assumption implicitly made in the simplest model $\mathfrak{M}0$ is that the process of the first translation initiation (on a just transcribed mRNA) takes the same amount of time as consequent translation initiations on the mRNA already having translating ribosomes. In reality, the time needed to process transcribed mRNA into the form ready for translation can take significant time, including such steps as splicing, circularization, etc.
In order to model this additional initial delay, specific states of mRNA such as ${R}_{0}$(free mRNA) and $\underline R _{0}$(initiated mRNA) can be separately represented in the model. Let us denote the amount of mRNA in these states as ${M}_{0}$ ${}_{\ }$ $ = R {}_{0}$ and ${F}_{0} $$=R_0
If ${k}_{02}$ $\mathrm{ < }$$\mathrm{ < }$ ${k}_{2}$ then this can also represent translation with membrane-bound ribosomes or SRP cycle [26], when there is a transient translation arrest in the initiated monosome state (the very beginning of the translation).
Separating ${M}_{0} $and$F0
The corresponding system of equations is
${dM0dt=kt−(kd+k01)M0dF0dt=k01M0−(kd+k02)F0dMdt=k02F0+k2F−(kd+k1)MdFdt=k1M−(kd+k2)FdRdt=k02F0+k2F−(kd+krd+k3)RdPdt=k3R−kpP $
|
(2.6) |
which has the following steady-state solution:
$ M_{0} = \frac{k_{t} }{k_{01} +k_{d} } , F_{0} = \frac{k_{t} k_{01} }{(k_{01} +k_{d} )(k_{02} +k_{d} )} , $ |
$ M = \frac{k_{t} }{k_{d} } \frac{k_{01} k_{02} (k_{2} +k_{d} )}{(k_{01} +k_{d} )(k_{02} +k_{d} )(k_{1} +k_{2} +k_{d} )}, F = \frac{k_{t} }{k_{d} } \frac{k_{01} k_{02} k_{1} }{(k_{01} +k_{d} )(k_{02} +k_{d} )(k_{1} +k_{2} +k_{d} )} , $ |
$ R=\frac{k_{t} }{k_{d} } \frac{k_{01} k_{02} (k_{1} +k_{d} )(k_{2} +k_{d} )}{(k_{01} +k_{d} )(k_{02} +k_{d} )(k_{1} +k_{2} +k_{d} )(k_{3} +k_{d} +k_{rd} )} , $ |
$ P = \frac{k_{3} }{k_{p} } \frac{k_{t} }{k_{d} } \frac{k_{01} k_{02} (k_{1} +k_{d} )(k_{2} +k_{d} )}{(k_{01} +k_{d} )(k_{02} +k_{d} )(k_{1} +k_{2} +k_{d} )(k_{3} +k_{d} +k_{rd} )} , $ |
$ MT = M_{0} +F_{0} +M+F = \frac{k_{t} }{k_{d} } , $ |
$RB=RM+F=(k1+kd)(k2+kd)(k1+k2+kd)(k3+kd+krd). $
|
(2.7) |
The relaxation times are
$rtM0=1k01+kd,rtF0=1min(k01+kd,k02+kd), $
|
(2.8) |
$ rt_{M} = rt_{F} = \frac{1}{k_{d} } , rt_{R} = \frac{1}{k_{d} } , rt_{P} = \frac{1}{\min (k_{d} , k_{p} )} . $ |
The M-F subsystem has the kinetic matrix with eigenvalues – ${k}_{d}$ and – ${k}_{d}$ – ${k}_{1}$ – ${k}_{2}$.
One of the undesired features of the simplest translation models $\mathfrak{M}0$ and $\mathfrak{M}0'$ is a possibility of unrealistic increase of the number of translating ribosomes in the pool. The kinetic rate constants ${k}_{1}$ and ${k}_{2\ }$ implicitly include the concentrations (not amounts) of 40S and 60S subunits correspondingly. Increasing these concentrations might lead to the unlimited growth of the steady-state amount of ribosomes (2.5).
Therefore, in order to create a more detailed and realistic representation of reaction ${M}_{\ }$$\mathrm{\to}$F, one can include the intermediate step of reversible binding of mRNA to the small ribosomal subunit ${M}_{\ \ }$ + 40S$\mathrm{\to}$M:40S and the scanning step during which 40S bound to mRNA search for the start codon: M:40S$\mathrm{\to}$F. Here Frepresents a state of mRNA with 40S positioned at the start codon and ready to recruit 60S. The time needed for finding the start codon ($\mathrm{\sim} 1$/ ${k}_{a}$) is a complex function of the local concentrations of certain initiation factors and, possibly, length and the secondary structure of 5'UTR.
Similar to $\mathfrak{M}0 '$, we can decouple the two initial states of mRNA in $\mathfrak{M}1$ and produce the model $\mathfrak{M} 1'$, in which binding of initiation factors can be represented explicitly (Figure 5). The process of protein synthesis involves a variety of initiation factors whose exact function can significantly differ even within the same cell. In order to avoid complications, we will abstractly denote two major types of initiation factors asIF1 and IF2. Initiation factors of type IF1 initiate mRNA by binding to the cap structure, poly-A tail, etc. In turn, IF2 initiate assembly of ribosomes and can be RNA helicases or other helper molecules [25]. IF1 factors are released only when the initiated states of mRNA (all besides ${M}_{0}$) are degraded.IF2 are released in the end of each ribosome assembly.
It is important to make a notice on the usage and recycling of 40S, 60S and IFs. All these molecules make a pool of resources (together with ATP and GTP, aminoacids, tRNAs, etc.) shared between many protein syntheses in the whole cell. The equations (2.4), (2.6) are written down for the amounts of the corresponding proteins, while 40S, 60S and IFs are consumed with the rates proportional to their local concentrations(Figure 5). 40S, 60S and IFs moleculesare returned to the pool of cellular resources in four ways: (1) in each act of mRNA degradation (except for the just transcribed ${M}_{0}$ state of mRNA) with rate constant ${k}_{d}$, (2) release of ribosomes from mRNA with rate constants ${k}_{3}$${}_{\ }$ and ${k}_{rd}$, (3) in backward reactions of 40S detachment from mRNA with rate constants $ k_{1}^{-}, k_{01}^{-} $(not shown explicitly in Figure 5), (4) in releasing a new translating ribosome with the rate constants $ k_{2}^{}, k_{02}^{} $.
We assume that each individual protein synthesis does not significantly change the pool of cellular resources and, therefore, the local concentrations of 40S, 60S and IFs remain constant. With such quite a realistic assumption, the models remain linear and analytically tractable. However, this might not be completely satisfactory approximation for the in vitro cell-free systems for studying translation, when the amounts of 40S or 60S or IFs are made comparable to the amounts of the translated mRNA. In this case recycling of ribosomal subunits and initiation factors might be a limiting (and fast) process, thus it should be represented explicitly, taking into account the effective volume occupied by 40S or 60S or IFs in the system (because the kinetic rates of resources release give the amount of the released translation factors while their consumption rates are proportional to their concentrations).
The steady state solution of the model $\mathfrak{M} 1$, assuming that the ribosomal units 40S and 60S are available in excess is:
$ M^{SS} = \frac{k_{t} }{k_{d} } \frac{k_{2}^{} [60S]+k_{d}^{} }{\frac{k_{1}^{+} k_{2}^{} }{k_{1}^{-} +k_{a} +k_{d} } [40S][60S]+k_{d}^{} +k_{2}^{} [60S]+\frac{k_{1}^{+} (k_{a} +k_{d} )}{k_{1}^{-} +k_{a} +k_{d} } [40S]}$ |
$ F^{SS} = \frac{k_{t} k_{1}^{+} k_{a} }{k_{d} } \frac{[40S]}{k_{1}^{+} k_{2}^{} [40S][60S]+k_{d}^{} (k_{1}^{-} +k_{a} +k_{d} )+k_{2}^{} (k_{1}^{-} +k_{a} +k_{d} )[60S]+k_{1}^{+} (k_{a} +k_{d} )[40S]}$ |
$ (M:40S)^{SS} = \frac{k_{t} k_{1}^{+} }{k_{d} } \frac{[40S](k_{2}^{} [60S]+k_{d}^{} )}{k_{1}^{+} k_{2}^{} [40S][60S]+k_{d}^{} (k_{1}^{-} +k_{a} +k_{d} )+k_{2}^{} (k_{1}^{-} +k_{a} +k_{d} )[60S]+k_{1}^{+} (k_{a} +k_{d} )[40S]}$ |
$RSS=ktkdkak3+kd[40S][60S][40S][60S]+kd(k−1+ka+kd)k+1k2+k−1+ka+kdk+1[60S]+ka+kdk2[40S] $
|
(2.9) |
$ P^{SS} =\frac{k_{t} }{k_{d} } \frac{k_{a} }{k_{3} +k_{d} } \frac{k_{3} }{k_{p} } \frac{[40S][60S]}{[40S][60S]+\frac{k_{d} (k_{1}^{-} +k_{a} +k_{d} )}{k_{1}^{+} k_{2}^{} } +\frac{k_{1}^{-} +k_{a} +k_{d} }{k_{1}^{+} } [60S]+\frac{k_{a} +k_{d} }{k_{2} } [40S]} $ |
Let us assume that the translation process is regulated by a molecule which can irreversibly bind to mRNA and, as a result, can change one or several kinetic rates of translation. Typical example of such a molecule is microRNA [27], so we will call it like this further. MicroRNAs are short stretches of RNA, able to regulate translation of the majority of human proteins, playing an important role in normal physiological processes and diseases such as cancer [28,29].
For our purposes (representing microRNA-based regulation), it is important to distinguish states ${M}_{0}$ ${}_{\ }$ and ${F}_{0}$ to be able to represent the initiation of mRNA and the effect of microRNA on the initiation process. MicroRNA can act on ${k}_{01}$ step (${M}_{0}
To take into account the action of microRNA on translation, the model of translation shown in Figure 3 is supplied with mRNA states representing mRNA with a microRNA bound to it (states M' ${}_{0}$ , F' ${}_{0}$, M', F', R'). The rate of microRNA binding is${k}_{b}$which determines irreversible conversion of the microRNA-free states (without prime) to microRNA-bound states (primed). The corresponding rate constants which might be different from normal translation process are marked with prime symbol as well. In addition, we introduce a special state B which describes reversible capturing of mRNA in P-bodies, where they can be specifically degraded at a higher rate${k}_{bd}$than during the microRNA-free translation (Figure 6A).
The model$\mathfrak{M} 0'$ reg model was used in [27] to produce the kinetic signatures of nine different mechanisms of microRNA action or their combinations. It was shown that each of the nine possible mechanisms has its own characteristic kinetic signature, which gives to experimentalists a tool to discriminate between them in their particular experimental system. The provided characteristic kinetic signature of an individual mechanism represents a characteristic plot with the predicted dynamics of 3 measurable biochemical variables (mRNA concentration, the corresponding protein concentration, the average number of ribosomes at a translated mRNA) in the case when a microRNA act on a given mRNA via this exact mechanism only.
The model $\mathfrak{M}0'$ reg was used in [27] to shed light on certain controversies in the experimental detection of a concrete mechanism of microRNA action. It was suggested that the actual observable mechanism depends on the rate-limiting steps in the complex translation machinery. For rather complex reaction mechanisms such as $\mathfrak{M}0'$ reg, the notion of the rate-limiting step should be replaced by the dominant system [34]. Analysis of $\mathfrak{M}0'$ reg showed existence of 6 dynamic types (dominant systems) each of which can correspond to several biological mechanisms of microRNA action. These dynamic types are: unmodified translation without strong effect from microRNA (Figure 6B), rapid degradation of mRNA after microRNA binding (Figure 6C), exporting mRNA to specialized compartments with further degradation (Figure 6D), limiting ribosomal assembly step (Figure 6E), limiting translation termination step (Figure 6F), translation of a relatively stable mRNA affected by the presence of microRNA (Figure 6G). These dynamic translation regulation types are discussed in more details in [27]. In all scenario, the mRNA degradation rate constant plays an important role in defining the rate limiting steps.
The basic lumped model can serve as a basis for other model extensions by explicit splitting of particular states from the lumped states and other modifications. Let us list several possible scenarios:
1. More explicit representation of translation termination or elongation, description of ribosome stalling phenomenon.
2. More detailed representation of the mRNA initiation process. For example, formation of the M0:IF1:40S complex in Figure 6 should proceed in several elementary steps, with particular role and order of binding of scaffold initiation proteins and other initiation factors, with subsequent recruitment of 40S.
3. Description of phenomena connected with uneven distribution of ribosomes along mRNA, such as described in recent literature on explicit studies of ribosome positioning on mRNAs [31].
4. Explicit modeling of the mRNA codon usage.
5. Mean-field models of the ribosomes' interaction: The simplest method to include the interaction of ribosomes in the lumped model is a dependence of the ribosome drop-off constant $ k _{rd}$$ _{\ }$ on the average concentration $\theta$ of the ribosomes per initiated molecule of mRNA: $ k _{rd}$ = $ k _{rd}$ ($\theta$). For example, for the scheme presented in Figure 3 it may be $ k _{rd}$ ($\theta$) = a/(b– $\theta$), where $\theta$ = R/(M+F).
6. Mean-field models of how the property of the mRNA (such as its stability) might change depending on the state and also on the history of mRNA. For example, one can imagine a (very hypothetical) version of mRNA kinetics with "mRNA aging" such as each new round of translation makes mRNA more fragile and prone to destruction. Or, in opposite, mRNA can become more stable with ribosomes sitting on it.
7. Modeling distribution of model parameters, leading to existence of population of mRNAs with different speeds of different steps of translation.
8. Explicit modeling of competition of various protein syntheses processes for resources (ribosomal subunits and initiation factors). The most interesting is to include in this picture the production of the resources themselves (transcription, translation, degradation), which will introduce complex global regulatory feedbacks.
In order to illustrate what distinguishes two particular translation models described above, we performed a numerical experiment in which we varied the concentrations of ribosomal subunits and studied their effect on the average number of translating ribosomes per mRNA. We compared two models $\mathfrak{M}0'$ and $\mathfrak{M}1 '$, without and with an intermediate state of mRNA bound to 40S ribosomal subunit but with 40S not yet positioned at the start codon. Our purpose is to demonstrate two points: (1) that the step of late initiation might be very sensitive parameter and lead to efficient regulation of translation (which is consistent with experimental findings [32]; (2) that without this step a simpler model $\mathfrak{M}0'$ can lead to non-physiological unlimited growth of translating ribosomes per mRNA (Figure 7).
As one can see from Figure 7, the steady state value of the average number of translating ribosomes per mRNA is not limited in the model $\mathfrak{M}0'$, if the concentrations of small and large ribosomal subunits are increased simultaneously. Increasing only concentration of 60S with fixed concentration of 40S is not sufficient: to increase the number of complexes one has to supply the system with both components.
By contrast, in the model $\mathfrak{M}1 '$, simultaneous increase in the concentrations of 40S and 60S makes RB insensitive to them (Figure 7, right plot). This can be easily understood from the model shown in Figures 4 and 5. If one assumes that the rates of mRNA degradation and synthesis are slower than the translation rate then it is easy to show that the steady-state value of the average number of translating ribosomes per mRNA is
$ RB = \frac{1}{k_{3} } \times \frac{k_{a} k_{1}^{+} k_{2} [IF1][IF2][40S][60S]}{k_{2} [60S](k_{a} [IF2]+k_{1}^{-} )+k_{1}^{+} [IF1][40S](k_{2} [60S]+k_{a} [IF2])} .$ |
Hence, if both ribosomal subunits are in excess then
$RB|[60S],[40S]→∞=ka[IF2]k3. $
|
(2.10) |
This is the limiting value of the average number of translating ribosomes per mRNA in the models $\mathfrak{M} 1 $ and $\mathfrak{M}1 '$.
Formula (2.10) has an important biological consequence: in the excess of ribosomal subunits the most sensitive parameter of protein synthesis (which is determined by RB) is the availability (or, equivalently, efficiency) of the initiation factors facilitating fixation of 40S bound to mRNA at the start codon (collectively denoted as IF2 in Figure 6). Good candidates for this type of initiation factors are RNA helicases whose role is to disentangle the 5'UTR regions of mRNA [25,32]. The early initiation factors, collectively denoted as IF1 in Figure 6, can play less important role, if the ribosomal subunits are in excess (they do not enter into (2.10)).
If both initiation factors are in excess, then there is saturation with respect to their values. For fixed concentrations of the ribosomal subunits we get
$ RB\left|{}_{[IF1], [IF2]\to \infty } \right. = \frac{k_{2} [40S][60S]}{k_{3} } . $ |
Therefore, saturation with respect to ribosomal subunits and initiation factor concentrations is not symmetric: the limiting parameter value with respect to infinite increase of initiation factors depends on both 40S and 60S concentrations while the limiting value with respect to infinite increase of ribosomal subunits depends only on the concentration of IF2.
Models developed in the previous sections can help understand general and global properties of protein synthesis in a living cell. Instead of focusing on a single protein synthesis, one can consider a global machinery of synthesis of all cellular proteins or some abundant groups of them.
Therefore, it is interesting to consider applying the basic model of protein synthesis to the model the synthesis of ribosomal proteins, because in this case there exists an intrinsic feedback mechanism regulating the amount of ribosomal proteins in a living cell.
At first, we exploited for this purpose model $\mathfrak{M}1$(Figure 4) which suggests how in a quasi-steady state the number of translating ribosomes ${R}^{SS}$ depends on the concentrations of 40S and 60S components (see formula (2.9)). Assuming physiological translation (efficient binding of 40S to mRNA and not too strong mRNA degradation), we can put $ k_{a} >> k_{1}^{-}, k_{d} << k_{a}, k_{d} << k_{3} $ and simplify (2.9) to
$RSS=ktkdkak3[40S][60S][40S][60S]+kdkak+1k2+kak+1[60S]+kak2[40S]=kak3MRS[40S][60S][40S][60S]+nm+m[60S]+p[40S], $
|
(2.11) |
where $ MR^{S} = \frac{k_{t} }{k_{d} }, \, \, \, m = \frac{k_{a} }{k_{1}^{+} }, n = \frac{k_{d} }{k_{2}^{} }, p = \frac{k_{a} }{k_{2}^{} } $. The meaning of ${MR}^{S}$ parameter is the total number of mRNAs of a given protein or a protein type.
In order to study very general features of ribosomal protein synthesis, let us assume that [40S] and [60S] components are identical and denote them collectively as S=[40S] = [60S] and use the rate equation (2.11) :
$dSdt=kaMRSS2S2+(p+m)S+mn−ksS $
|
(2.12) |
The equation (2.12) is characterized by a possibility of bistability, with two non-zero steady states (one of which is stable and another one is unstable):
$ S{}^{High} = \frac{1}{2} \left[MR^{S} \frac{k_{a} }{k_{s} } -(p+m)+\sqrt{\left(MR^{S} \frac{k_{a} }{k_{s} } -(p+m)\right)^{2} -4mn} \right] $ |
$ S{}^{Low} = \frac{1}{2} \left[MR^{S} \frac{k_{a} }{k_{s} } -(p+m)-\sqrt{\left(MR^{S} \frac{k_{a} }{k_{s} } -(p+m)\right)^{2} -4mn} \right] $ |
Three steady states of the protein synthesis system (S = 0, S = ${S}^{High}$, S = ${S}^{Low}$) exist only when
$(MRSkaks−(p+m))2≥4mn, $
|
(2.13) |
which we can consider as a general condition of cell viability, because otherwise sustainable protein synthesis is not possible.
In the important asymptotic case $\left(MR^{S} \frac{k_{a} }{k_{s} } -(p+m)\right)^{2} >> 4mn $, one has
$ S{}^{High} \approx MR^{S} \frac{k_{a} }{k_{s} } -(p+m) = k_{a} \left(\frac{k_{t} }{k_{d} } \frac{1}{k_{s} } -\frac{1}{k_{2} } -\frac{1}{k_{1}^{+} } \right), $ |
$SLow≈mnMRSkaks−(p+m)=kdktkdk+1k2ks−(k+1+k2). $
|
(2.14) |
The meaning of $ S{}^{Low} $ is the minimum number of ribosomes needed to maintain the translation (when it is possible, accordingly to the condition (2.13)). If the number of ribosomes drops below this threshold, then the translation will collapse to the zero steady state (Figure 8A). Interestingly, in the asymptotic case (2.14), $ S{}^{Low} $ decreases with increasing efficiency of translation initiation ($ k_{1}^{+} $, $ k_{2} $ coefficients) and does not depend on $ k_{a} $.$ S^{High} $, which meaning is the stable number of ribosomes in a cell, has the opposite behavior: it increases with more efficient translation and linearly scales with the scanning rate $ k_{a} $. This behavior is illustrated in (Figure 8B) for some realistic estimation of the protein synthesis parameters.
This analysis shows that for a biologically relevant set of parameters, the critical necessary minimal number of ribosomes in a cell seems not to exceed few thousands. It becomes larger in the case when the ribosomal protein translation is slow due to its rate limiting initiation. For large intervals of values of initiation rates, the critical amount can approach 1 ribosome, which means that theoretically, a cell can recover from drastic (close to complete) ribosome depletion, by synthesizing a new complete pool of them. As a strong speculation, one can suggest that evolutionary the parameters of translation are chosen such that a cell could robustly recover its protein synthesis machinery.
Numerical simulations were made using MATLAB. Executable model definitions are provided from http://github.com/sysbio-curie/ProteinTranslationModels.
Rough parameter estimation was made using numbers from [33] and http://book.bionumbers.org, using data for a simple eukaryotic cell, such as yeast. Typical mRNA half-life was assumed in 20–30 minutes, which is reflected in the value ${k}_{d}$ = $ 8\cdot 10^{-4}$ sec ${}^{-1}$. The number of mRNA molecules for a particular protein was estimated on average in 1000, which leads in ${k}_{t}$ = 10 ${}^{3}kd$.Typicalproteinhalf−lifewasassumedin30–60minswhichgives$ks$=$4⋅10−4$sec$−1$.Weassumedthestablenumberofribosomesinacellin$2−5⋅105$whichconstrainsthevalue$SHigh$andtheprotein/mRNAratioin10$2$bytheorderofmagnitude.Forotherparametervalues($k+1$,$k2$,$ka $)wedidnotfixtheexactparametersbutratherscantheirranges,assumingthattheinitiationofmRNAwith40Sisfasterthanfullribosomeassembly($k+1$=10$k2 $)andthatthe5′scanningstepisrelativelyfast($ka
The meaning of different kinetic parameters introduced in different protein synthesis models is specified in Table 1.
Parameter | Model(s) | Parameter meaning in a specific model and relation to other parameters |
${k}_{T}$ | $\mathfrak{M}$ 0, $\mathfrak{M}$ 0', $\mathfrak{M}$ 1, $\mathfrak{M}$ 1', $\mathfrak{M}$ 0'reg | Rate constant of transcription process |
${k}_{1}$ | $\mathfrak{M}$ 0, $\mathfrak{M}$ 0', $\mathfrak{M}$ 0'reg | Rate constant of translation initiation. It includes the 40S subunit binding and scanning for the start codon. In the simplest model $\mathfrak{M}$ 0 it denotes both the rate of the first round of initiation and all further initiation events on already translated mRNA. |
${k}_{2}$ | $\mathfrak{M}$ 0, $\mathfrak{M}$ 0', $\mathfrak{M}$ 1, $\mathfrak{M}$ 1', $\mathfrak{M}$ 0'reg | Rate constant of ribosome assembly, including possible transient arrest of ribosomes before starting translation. |
${k}_{3}$ | $\mathfrak{M}$ 0, $\mathfrak{M}$ 0', $\mathfrak{M}$ 1, $\mathfrak{M}$ 1', $\mathfrak{M}$ 0'reg | Rate constant of translation elongation step; it also includes the rate of translation termination |
${k}_{d}$ | $\mathfrak{M}$ 0, $\mathfrak{M}$ 0', $\mathfrak{M}$ 1, $\mathfrak{M}$ 0'reg | Rate constant of mRNA degradation |
${k}_{rd}$ | $\mathfrak{M}$ 0, $\mathfrak{M}$ 0', $\mathfrak{M}$ 1, $\mathfrak{M}$ 1', $\mathfrak{M}$ 0'reg | Rate constant of premature ribosomal drop-off from translated mRNA |
${k}_{p}$ | $\mathfrak{M}$ 0, $\mathfrak{M}$ 0', $\mathfrak{M}$ 1, $\mathfrak{M}$ 1', $\mathfrak{M}$ 0'reg | Rate constant of protein degradation |
${k}_{01}$ | $\mathfrak{M}$ 0', $\mathfrak{M}$ 0'reg | Rate constant of the first round mRNA initialization and binding of the 40S subunit including specific steps of initialization |
${k}_{02}$ | $\mathfrak{M}$ 0', $\mathfrak{M}$ 1' | Rate constant of the first round of ribosomal assembly on initiated mRNA |
$ k_{1}^{+} $, $ k_{1}^{-} $ | $\mathfrak{M}$ 1, $\mathfrak{M}$ 1' | Rate constants of reversible binding of 40S subunit to mRNA |
${k}_{a}$ | $\mathfrak{M}$ 1, $\mathfrak{M}$ 1' | Rate constant of 40S subunit scanning of 5'UTR for the start codon. In the model $\mathfrak{M}$ 1' it includes binding of factors facilitating the scanning, collectively denoted as IF2 |
$ k_{01}^{+} $, $ k_{01}^{-} $ | $\mathfrak{M}$ 1' | Rate constants of reversible binding of both translation initiation factors, collectively denoted as IF1 and 40S to the naked mRNA (first round of initialisation) |
k ${}_{b}$ | $\mathfrak{M}$ 0'reg | Rate constant of irreversible binding of a regulatory molecule (such as microRNA) to mRNA |
$ k_{s}^{+} $, $ k_{s}^{-} $ | $\mathfrak{M}$ 0'reg | Rate constant of reversible capturing of mRNA to a compartment (such as P-bodies) where the translation is inhibited |
${k}_{bd}$ | $\mathfrak{M}$ 0'reg | Rate constant of degradation of mRNA in a compartment where the translation is inhibited |
In this paper we introduce several simple models of protein synthesis which are directly derived from a simplification of detailed kinetics of protein translation, describing the phenomenon of polysome. The simplification is achieved through lumping, one of the common approaches from reaction network asymptotology toolbox [34]. This derivation distinguishes the model from other simpified models of protein synthesis introduced ad hoc in various studies. Simple explanatory illustration of the nature of the suggested model is provided in Figure 9 ("opening/closing door"-type modeling).
When introducing the protein synthesis model, we used notions and terms specific to eukaryotes (e.g., we explicitly named the risobomal subunits 40S and 60S). In the current form, the model is indeed directly applicable to describing the translation in a typical eukaryotic cell. Adapting the model to translation in prokaryotes is possible though it will require to take into account such phenomena as translation from polycistronic mRNA, spatio-temporal coupling of DNA replication, transcription and translation processes, and other effects.
The main use of simple and basic models of protein synthesis is identification of sensitive (e.g., rate limiting) parameters of the protein synthesis machinery, whose change can efficiently regulate translation. In the past, such an approach was used by us in order to identify the mechanisms of microRNA action by following through the dynamics of the basic observables of translation: amount of mRNA, amount of protein and the polysomal profile, in the presence and in the absence of microRNA. An unsolved inverse problem remains in the case when a regulatory molecule (such as a microRNA) can affect simultaneously several translation parameters. In this case, it is desirable to have an effective mathematical tool allowing "deconvoluting" the mixed effect of the regulation into a vector of strengths of individual translation parameter modulations.
The model is made extendable such that it makes it relatively easy to represent in more details some particular aspects of protein synthesis dynamics, if this is needed. We provide several model extensions, each of which can have specific applications. One of such extension deals with a feature of the basic model which might be non-desirable: namely, a possibility for unlimited number of ribosomes in a polysome. Explicit representation of a reaction step describing the scanning by the 40S ribosomal subunit for the start codon along the 5' end of mRNA limits the number of ribosomes in polysome and allows determining the most sensitive parameters of translation initiation under various assumptions (e.g., for the case of unlimited access of 40S and 60S subunits).
Another example of application that we provided is modeling the synthesis of ribosomal protein pool in a cell. We demonstrate that in this cellular system there exists an intrinsic bi-stability, with three steady-states for the amount of ribosomes in a cell, two stable ones, 0 and $ S{}^{High}$, and one unstable $ S{}^{Low}$. We derive formulas for these values connecting them to the basic parameters of protein synthesis. The biological meaning of $ S{}^{Low}$ is the minimum number of ribosomes required for a cell in order to sustain its protein synthesis. If the number of ribosomes drops below this number, then the whole machinery of protein synthesis is predicted to collapse, not being able to maintain the synthesis of ribosomal protein pool. Interestingly, the usual estimates for the number of ribosomes in a living cell is made for the case of actively proliferating cells using simple arguments for the necessity of protein pool replenishment in dividing cells [33]. By contrast, the estimates for $ S{}^{High}$(stable number of ribosomes) and $ S{}^{Low}$(minimum number of ribosome state from which the protein synthesis is able to recover) are valid even for quiescent cells. It is known that the house-keeping proteins have relatively long half-lives: therefore, sustaining cellular life can less crucially depend on the de novo protein synthesis and availability of the ribosomal proteins.
For quiescent cells, the experiment with depleting the ribosomal protein pool might be feasible in theory. We must notice that in a real cell even transitory depletion of the ribosomal pool might be incompatible with cell viability for multiple other reasons not directly related to the bistability and collapse of the protein synthesis machinery. Also, the parameter estimations of the protein synthesis model used in this study might be grossly inaccurate. Nevertheless, the theoretical conclusion on the existence of the critical minimum number of ribosomes is independent on the parameter values, and can be potentially validated in an experiment.
The model of ribosomal protein synthesis suggested in this paper needs to be completed with equations describing the synthesis of non-ribosomal proteins. Also, distinguishing 40S and 60S ribosomal proteins might lead to the new interesting dynamical effects such as existence of oscillations in protein synthesis machinery, which potentially can lead to periodic change in the cellular dry mass, even in the absence of proliferation. Exploration of such model extensions, with construction of their complete parametric portrait is beyond the score of this paper but is a feasible though a difficult task.
One particular application of the translation models consists in deciphering the results of application of modern sequencing-based technologies quantifying the global state of the translational machinery, such as Ribo-Seq or TRAP-Seq [35]. The amount of data of this type (translatomic data) rapidly grows, but remains less ready for intuitive interpretation compared to other omics data types and require mathematical modeling, taking into account various aspects of polysome [36].
To conclude, the introduced mathematical models of protein synthesis can find applications in modeling and data analysis when the most detailed representation of the translation mechanisms is not required.
This study was partially supported by ITMO Cancer "Non-coding RNA in cancerology" program (project "Using an integrative strategy to decipher miRNAs function in Pediatric Brain Tumor") and by the Ministry of Science and Higher Education of the Russian Federation (Project No. 14.Y26.31.0022).
The authors declare that there is no conflict of interest regarding the publication of this article.
[1] |
Wen PY, Kesari S (2008) Malignant gliomas in adults. New Engl J Med 359: 492–507. doi: 10.1056/NEJMra0708126
![]() |
[2] |
Brennan C, Momota H, Hambardzumyan D, et al. (2009) Glioblastoma subclasses can be defined by activity among signal transduction pathways and associated genomic alterations. PLoS One 4: e7752. doi: 10.1371/journal.pone.0007752
![]() |
[3] |
Verhaak RG, Hoadley KA, Purdom E, et al. (2010) Integrated genomic analysis identifies clinically relevant subtypes of glioblastoma characterized by abnormalities in PDGFRA, IDH1, EGFR, and NF1. Cancer Cell 17: 98–110. doi: 10.1016/j.ccr.2009.12.020
![]() |
[4] |
Louis DN, Perry A, Reifenberger G, et al. (2016) The 2016 World Health Organization classification of tumors of the central nervous system: A summary. Acta Neuropathol 131: 803–820. doi: 10.1007/s00401-016-1545-1
![]() |
[5] | Stupp R, Mason WP, Van dBMJ, et al. (2005) Radiotherapy plus concomitant and adjuvant temozolomide for glioblastoma. New Engl J Med 352: 987–996. |
[6] |
Quail DF, Joyce JA (2017) The microenvironmental landscape of brain tumors. Cancer Cell 31: 326–341. doi: 10.1016/j.ccell.2017.02.009
![]() |
[7] |
Lohr J, Ratliff T, Huppertz A, et al. (2011) Effector T-cell infiltration positively impacts survival of glioblastoma patients and is impaired by tumor-derived TGF-beta. Clin Cancer Res 17: 4296–4308. doi: 10.1158/1078-0432.CCR-10-2557
![]() |
[8] |
Kmiecik J, Poli A, Brons NH, et al. (2013) Elevated CD3+ and CD8+ tumor-infiltrating immune cells correlate with prolonged survival in glioblastoma patients despite integrated immunosuppressive mechanisms in the tumor microenvironment and at the systemic level. J Neuroimmunol 264: 71–83. doi: 10.1016/j.jneuroim.2013.08.013
![]() |
[9] | Yang I, Han SJ, Sughrue ME, et al. (2011a) Immune cell infiltrate differences in pilocytic astrocytoma and glioblastoma: evidence of distinct immunological microenvironments that reflect tumor biology. J Neurosurg 115: 505–511. |
[10] |
Swain SL (1995) T-cell subsets: Who does the polarizing? Curr Biol 5: 849–851. doi: 10.1016/S0960-9822(95)00170-9
![]() |
[11] |
Mellanby RJ, Thomas DC, Lamb J (2009) Role of regulatory T-cells in autoimmunity. Clin Sci 116: 639–469. doi: 10.1042/CS20080200
![]() |
[12] |
Fecci PE, Mitchell DA, Whitesides JF, et al. (2006) Increased regulatory T-cell fraction amidst a diminished CD4 compartment explains cellular immune defects in patients with malignant glioma. Cancer Res 66: 3294–3302. doi: 10.1158/0008-5472.CAN-05-3773
![]() |
[13] |
Fecci PE, Ochiai H, Mitchell DA, et al. (2007) Systemic CTLA-4 blockade ameliorates glioma-induced changes to the CD4+ T cell compartment without affecting regulatory T-cell function. Clin Cancer Res 13: 2158–2167. doi: 10.1158/1078-0432.CCR-06-2070
![]() |
[14] |
Thomas AA, Fisher JL, Rahme GJ, et al. (2015) Regulatory T cells are not a strong predictor of survival for patients with glioblastoma. Neuro Oncol 17: 801–809. doi: 10.1093/neuonc/nou363
![]() |
[15] |
Han S, Zhang C, Li Q, et al. (2014) Tumour-infiltrating CD4(+) and CD8(+) lymphocytes as predictors of clinical outcome in glioma. Brit J Cancer 110: 2560–2568. doi: 10.1038/bjc.2014.162
![]() |
[16] |
Sayour EJ, McLendon P, McLendon R, et al. (2015) Increased proportion of FoxP3+ regulatory T cells in tumor infiltrating lymphocytes is associated with tumor recurrence and reduced survival in patients with glioblastoma. Cancer Immunol Immun 64: 419–427. doi: 10.1007/s00262-014-1651-7
![]() |
[17] |
Mu L, Yang C, Gao Q, et al. (2017) CD4+ and perivascular Foxp3+ T cells in glioma correlate with angiogenesis and tumor progression. Front Immunol 8: 1451. doi: 10.3389/fimmu.2017.01451
![]() |
[18] |
Braumuller H, Wieder T, Brenner E, et al. (2013) T-helper-1-cell cytokines drive cancer into senescence. Nature 494: 361–365. doi: 10.1038/nature11824
![]() |
[19] |
Hirschhorn-Cymerman D, Budhu S, Kitano S, et al. (2012) Induction of tumoricidal function in CD4+ T cells is associated with concomitant memory and terminally differentiated phenotype. J Exp Med 209: 2113–2126. doi: 10.1084/jem.20120532
![]() |
[20] |
Perez-Diez A, Joncker NT, Choi K, et al. (2007) CD4 cells can be more efficient at tumor rejection than CD8 cells. Blood 109: 5346–5354. doi: 10.1182/blood-2006-10-051318
![]() |
[21] |
Murphy KA, Erickson JR, Johnson CS, et al. (2014) CD8+ T cell-independent tumor regression induced by Fc-OX40L and therapeutic vaccination in a mouse model of glioma. J Immunol 192: 224–233. doi: 10.4049/jimmunol.1301633
![]() |
[22] |
Saha D, Martuza RL, Rabkin SD (2017) Macrophage polarization contributes to glioblastoma eradication by combination immunovirotherapy and immune checkpoint blockade. Cancer Cell 32: 253–267. doi: 10.1016/j.ccell.2017.07.006
![]() |
[23] | Liu Z, Meng Q, Bartek J, et al. (2017b) Tumor-infiltrating lymphocytes (TILs) from patients with glioma. Oncoimmunology 6: e1252894. |
[24] |
Beck BH, Kim H, O'Brien R, et al. (2015) Dynamics of circulating gammadelta T cell activity in an immunocompetent mouse model of high-grade glioma. PLoS One 10: e0122387. doi: 10.1371/journal.pone.0122387
![]() |
[25] |
Yang I, Tihan T, Han SJ, et al. (2010) CD8+ T-cell infiltrate in newly diagnosed glioblastoma is associated with long-term survival. J Clin Neurosci 17: 1381–1385. doi: 10.1016/j.jocn.2010.03.031
![]() |
[26] |
Nduom EK, Wei J, Yaghi NK, et al. (2016) PD-L1 expression and prognostic impact in glioblastoma. Neuro Oncol 18: 195–205. doi: 10.1093/neuonc/nov172
![]() |
[27] | Heiland DH, Haaker G, Delev D, et al. (2017) Comprehensive analysis of PD-L1 expression in glioblastoma multiforme. Oncotarget 8: 42214–42225. |
[28] |
Reiss SN, Yerram P, Modelevsky L, et al. (2017) Retrospective review of safety and efficacy of programmed cell death-1 inhibitors in refractory high grade gliomas. J Immunother Cancer 5: 99. doi: 10.1186/s40425-017-0302-x
![]() |
[29] | Miyauchi JT, Tsirka SE (2017) Advances in immunotherapeutic research for glioma therapy. J Neurol, 1–16. |
[30] |
Nakashima H, Alayo QA, Penaloza-MacMaster P, et al. (2018) Modeling tumor immunity of mouse glioblastoma by exhausted CD8+ T cells. Sci Rep 8: 208. doi: 10.1038/s41598-017-18540-2
![]() |
[31] |
Haanen J (2017) Converting cold into hot tumors by combining immunotherapies. Cell 170: 1055–1056. doi: 10.1016/j.cell.2017.08.031
![]() |
[32] |
Zeng J, See AP, Phallen J, et al. (2013) Anti-PD-1 blockade and stereotactic radiation produce long-term survival in mice with intracranial gliomas. Int J Radiat Oncol 86: 343–349. doi: 10.1016/j.ijrobp.2012.12.025
![]() |
[33] |
Waitz R, Solomon SB, Petre EN, et al. (2012) Potent induction of tumor immunity by combining tumor cryoablation with anti-CTLA-4 therapy. Cancer Res 72: 430–439. doi: 10.1158/0008-5472.CAN-11-1782
![]() |
[34] |
Masson F, Calzascia T, Di BBW, et al. (2007) Brain microenvironment promotes the final functional maturation of tumor-specific effector CD8+ T cells. J Immunol 179: 845–853. doi: 10.4049/jimmunol.179.2.845
![]() |
[35] |
Hong JJ, Rosenberg SA, Dudley ME, et al. (2010) Successful treatment of melanoma brain metastases with adoptive cell therapy. Clin Cancer Res 16: 4892–4898. doi: 10.1158/1078-0432.CCR-10-1507
![]() |
[36] |
Rosenberg SA, Yang JC, Sherry RM, et al. (2011) Durable complete responses in heavily pretreated patients with metastatic melanoma using T-cell transfer immunotherapy. Clin Cancer Res 17: 4550–1557. doi: 10.1158/1078-0432.CCR-11-0116
![]() |
[37] |
Brown CE, Badie B, Barish ME, et al. (2015) Bioactivity and safety of IL13Ralpha2-redirected chimeric antigen receptor CD8+ T cells in patients with recurrent glioblastoma. Clin Cancer Res 21: 4062–4072. doi: 10.1158/1078-0432.CCR-15-0428
![]() |
[38] |
Brown CE, Alizadeh D, Starr R, et al. (2016) Regression of glioblastoma after chimeric antigen receptor T-cell therapy. New Engl J Med 375: 2561–2569. doi: 10.1056/NEJMoa1610497
![]() |
[39] |
Liau LM, Prins RM, Kiertscher SM, et al. (2005) Dendritic cell vaccination in glioblastoma patients induces systemic and intracranial T-cell responses modulated by the local central nervous system tumor microenvironment. Clin Cancer Res 11: 5515–5525. doi: 10.1158/1078-0432.CCR-05-0464
![]() |
[40] |
Polyzoidis S, Ashkan K (2014) DCVax(R)-L--developed by Northwest Biotherapeutics. Hum Vacc Immunother 10: 3139–3145. doi: 10.4161/hv.29276
![]() |
[41] |
Flores C, Pham C, Snyder D, et al. (2015) Novel role of hematopoietic stem cells in immunologic rejection of malignant gliomas. Oncoimmunology 4: e994374. doi: 10.4161/2162402X.2014.994374
![]() |
[42] |
Muller I, Altherr D, Eyrich M, et al. (2016) Tumor antigen-specific T cells for immune monitoring of dendritic cell-treated glioblastoma patients. Cytotherapy 18: 1146–1161. doi: 10.1016/j.jcyt.2016.05.014
![]() |
[43] | Garg AD, Vandenberk L, Koks C, et al. (2016) Dendritic cell vaccines based on immunogenic cell death elicit danger signals and T cell-driven rejection of high-grade glioma. Sci Transl Med 8: 328ra27. |
[44] |
Mitchell DA, Batich KA, Gunn MD, et al. (2015) Tetanus toxoid and CCL3 improve dendritic cell vaccines in mice and glioblastoma patients. Nature 519: 366–369. doi: 10.1038/nature14320
![]() |
[45] |
Ransohoff RM (2016) A polarizing question: do M1 and M2 microglia exist? Nat Neurosci 19: 987–991. doi: 10.1038/nn.4338
![]() |
[46] |
Charles NA, Holland EC, Gilbertson R, et al. (2011) The brain tumor microenvironment. Glia 59: 1169–1180. doi: 10.1002/glia.21136
![]() |
[47] | Da FA, Badie B (2013) Microglia and macrophages in malignant gliomas: recent discoveries and implications for promising therapies. Clin Dev Immunol 2013: 264124. |
[48] | Hewedi IH, Radwan NA, Shash LS, et al. (2013) Perspectives on the immunologic microenvironment of astrocytomas. Cancer Manag Res 5: 293–299. |
[49] |
Held-Feindt J, Hattermann K, Muerkoster SS, et al. (2010) CX3CR1 promotes recruitment of human glioma-infiltrating microglia/macrophages (GIMs). Exp Cell Res 316: 1553–1566. doi: 10.1016/j.yexcr.2010.02.018
![]() |
[50] | Nishie A, Ono M, Shono T, et al. (1999) Macrophage infiltration and heme oxygenase-1 expression correlate with angiogenesis in human gliomas. Clin Cancer Res 5: 1107–1113. |
[51] | Sorensen MD, Dahlrot RH, Boldt HB, et al. (2017) Tumour-associated microglia/macrophages predict poor prognosis in high-grade gliomas and correlate with an aggressive tumour subtype. Neuropath Appl Neuro 44: 185–206. |
[52] | Okada M, Saio M, Kito Y, et al. (2009) Tumor-associated macrophage/microglia infiltration in human gliomas is correlated with MCP-3, but not MCP-1. Int J Oncol 34: 1621–1627. |
[53] |
Wang Q, Hu B, Hu X, et al. (2017) Tumor evolution of glioma-intrinsic gene expression subtypes associates with immunological changes in the microenvironment. Cancer Cell 32: 42–56. doi: 10.1016/j.ccell.2017.06.003
![]() |
[54] |
Bloch O, Crane CA, Kaur R, et al. (2013) Gliomas promote immunosuppression through induction of B7-H1 expression in tumor-associated macrophages. Clin Cancer Res 19: 3165–3175. doi: 10.1158/1078-0432.CCR-12-3314
![]() |
[55] |
Gieryng A, Pszczolkowska D, Bocian K, et al. (2017) Immune microenvironment of experimental rat C6 gliomas resembles human glioblastomas. Sci Rep 7: 17556. doi: 10.1038/s41598-017-17752-w
![]() |
[56] | Xu S, Wei J, Wang F, et al. (2014) Effect of miR-142-3p on the M2 macrophage and therapeutic efficacy against murine glioblastoma. J Natl Cancer Inst 106. |
[57] | McFarland BC, Marks MP, Rowse AL, et al. (2016) Loss of SOCS3 in myeloid cells prolongs survival in a syngeneic model of glioma. Oncotarget 7: 20621–20635. |
[58] |
Pyonteck SM, Akkari L, Schuhmacher AJ, et al. (2013) CSF-1R inhibition alters macrophage polarization and blocks glioma progression. Nat Med 19: 1264–1272. doi: 10.1038/nm.3337
![]() |
[59] |
Yan D, Kowal J, Akkari L, et al. (2017) Inhibition of colony stimulating factor-1 receptor abrogates microenvironment-mediated therapeutic resistance in gliomas. Oncogene 36: 6049–6058. doi: 10.1038/onc.2017.261
![]() |
[60] |
Colegio OR, Chu NQ, Szabo AL, et al. (2014) Functional polarization of tumour-associated macrophages by tumour-derived lactic acid. Nature 513: 559–563. doi: 10.1038/nature13490
![]() |
[61] |
Zhang I, Alizadeh D, Liang J, et al. (2016) Characterization of arginase expression in glioma-associated microglia and macrophages. PLoS One 11: e0165118. doi: 10.1371/journal.pone.0165118
![]() |
[62] | Lyons YA, Pradeep S, Wu SY, et al. (2017) Macrophage depletion through colony stimulating factor 1 receptor pathway blockade overcomes adaptive resistance to anti-VEGF therapy. Oncotarget 8: 96496–96505. |
[63] |
Nakayama T, Kurobe H, Sugasawa N, et al. (2013) Role of macrophage-derived hypoxia-inducible factor (HIF)-1alpha as a mediator of vascular remodelling. Cardiovasc Res 99: 705–715. doi: 10.1093/cvr/cvt146
![]() |
[64] |
Jetten N, Verbruggen S, Gijbels MJ, et al. (2014) Anti-inflammatory M2, but not pro-inflammatory M1 macrophages promote angiogenesis in vivo. Angiogenesis 17: 109–118. doi: 10.1007/s10456-013-9381-6
![]() |
[65] |
Chang AL, Miska J, Wainwright DA, et al. (2016) CCL2 produced by the glioma microenvironment is essential for the recruitment of regulatory t cells and myeloid-derived suppressor cells. Cancer Res 76: 5671–5682. doi: 10.1158/0008-5472.CAN-16-0144
![]() |
[66] |
Solga AC, Pong WW, Kim KY, et al. (2015) RNA sequencing of tumor-associated microglia reveals Ccl5 as a stromal chemokine critical for neurofibromatosis-1 glioma growth. Neoplasia 17: 776–788. doi: 10.1016/j.neo.2015.10.002
![]() |
[67] |
Nissen JC, Selwood DL, Tsirka SE (2013) Tuftsin signals through its receptor neuropilin-1 via the transforming growth factor beta pathway. J Neurochem 127: 394–402. doi: 10.1111/jnc.12404
![]() |
[68] | Miyauchi JT, Chen D, Choi M, et al. (2016) Ablation of neuropilin 1 from glioma-associated microglia and macrophages slows tumor progression. Oncotarget 7: 9801–9814. |
[69] |
Koncina E, Roth L, Gonthier B, et al. (2007) Role of semaphorins during axon growth and guidance. Adv Exp Med Biol 621: 50–64. doi: 10.1007/978-0-387-76715-4_4
![]() |
[70] |
Glinka Y, Prud'homme GJ (2008) Neuropilin-1 is a receptor for transforming growth factor beta-1, activates its latent form, and promotes regulatory T cell activity. J Leukoc Biol 84: 302–10. doi: 10.1189/jlb.0208090
![]() |
[71] |
Hu B, Guo P, Bar-Joseph I, et al. (2007) Neuropilin-1 promotes human glioma progression through potentiating the activity of the HGF/SF autocrine pathway. Oncogene 26: 5577–5586. doi: 10.1038/sj.onc.1210348
![]() |
[72] | Gelfand MV, Hagan N, Tata A, et al. (2014) Neuropilin-1 functions as a VEGFR2 co-receptor to guide developmental angiogenesis independent of ligand binding. Elife 3: e03720. |
[73] |
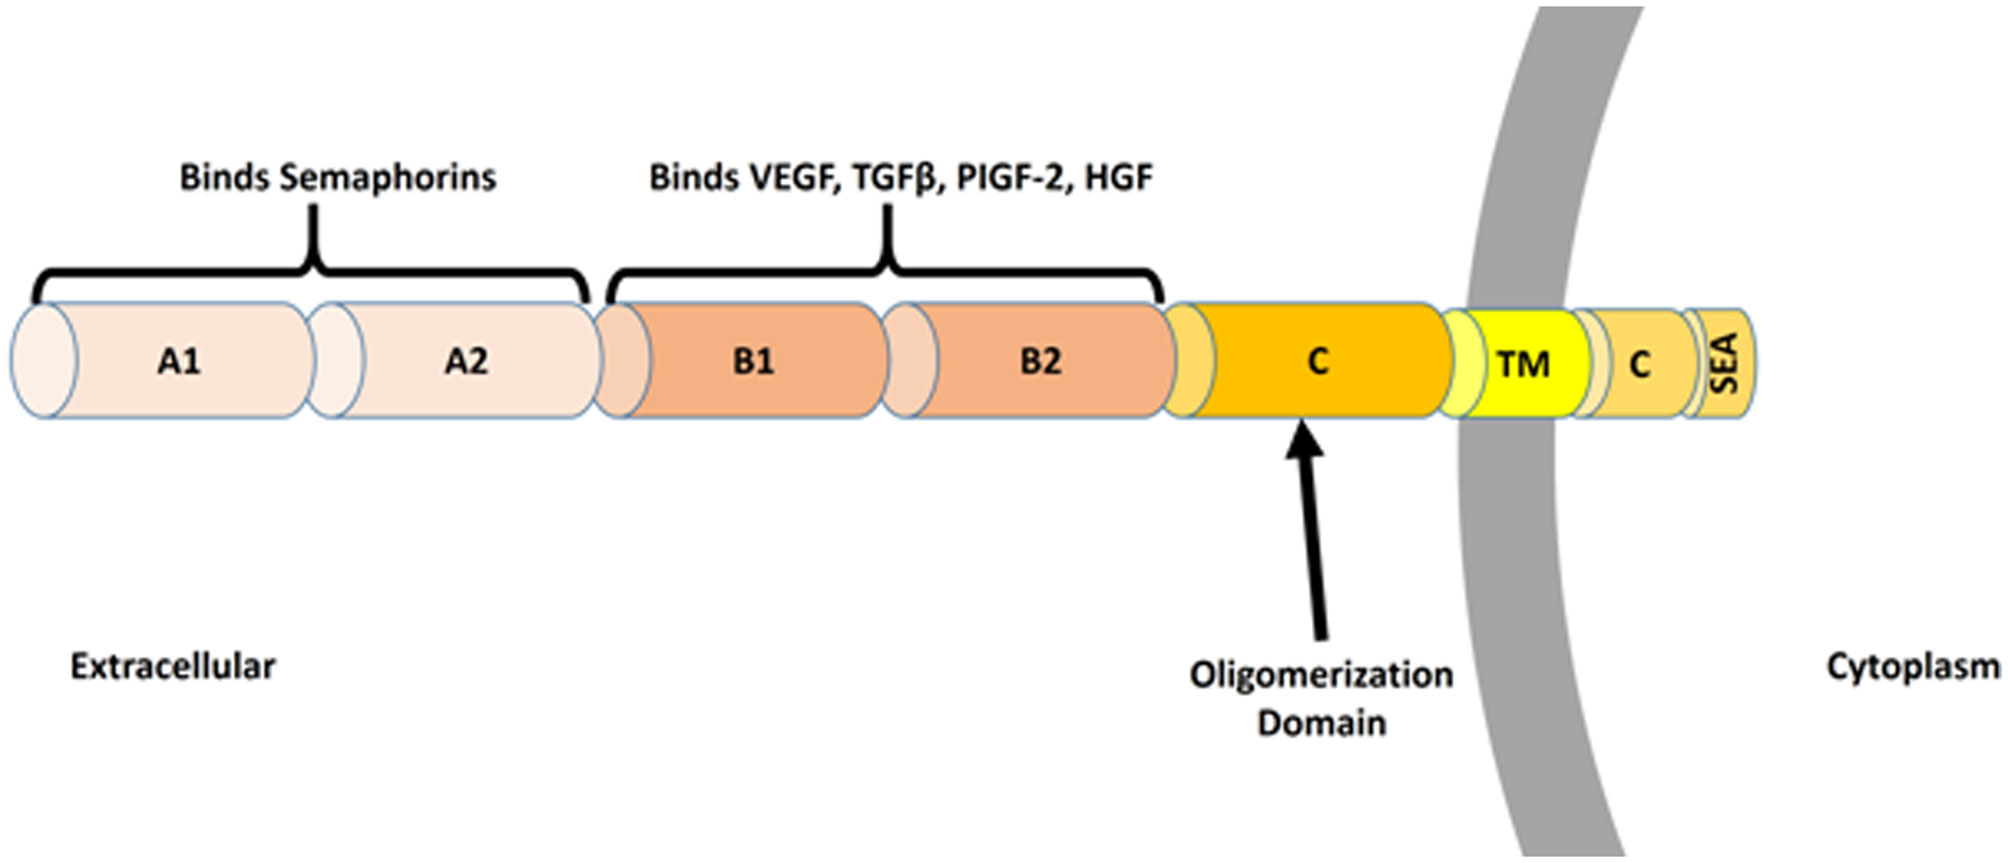
Nakamura F, Goshima Y (2002) Structural and functional relation of neuropilins. Adv Exp Med Biol 515: 55–69. doi: 10.1007/978-1-4615-0119-0_5
![]() |
[74] |
Chaudhary B, Khaled YS, Ammori BJ, et al. (2014) Neuropilin 1: function and therapeutic potential in cancer. Cancer Immunol Immun 63: 81–99. doi: 10.1007/s00262-013-1500-0
![]() |
[75] |
Raimondi C, Fantin A, Lampropoulou A, et al. (2014) Imatinib inhibits VEGF-independent angiogenesis by targeting neuropilin 1-dependent ABL1 activation in endothelial cells. J Exp Med 211: 1167–1183. doi: 10.1084/jem.20132330
![]() |
[76] | Campos-Mora M, Morales RA, Gajardo T, et al. (2013) Neuropilin-1 in transplantation tolerance. Front Immunol 4: 405. |
[77] |
Klagsbrun M, Takashima S, Mamluk R (2002) The role of neuropilin in vascular and tumor biology. Adv Exp Med Biol 515: 33–48. doi: 10.1007/978-1-4615-0119-0_3
![]() |
[78] |
Zachary I, Fantin A, Herzog B, et al. (2014) Neuropilin 1 (NRP1) hypomorphism combined with defective VEGF-A binding reveals novel roles for NRP1 in developmental and pathological angiogenesis. Development 141: 556–562. doi: 10.1242/dev.103028
![]() |
[79] |
Campos-Mora M, Morales RA, Perez F, et al. (2015) Neuropilin-1(+) regulatory T cells promote skin allograft survival and modulate effector CD4(+) T cells phenotypic signature. Immunol Cell Biol 93: 113–119. doi: 10.1038/icb.2014.77
![]() |
[80] |
Solomon BD, Mueller C, Chae WJ, et al. (2011) Neuropilin-1 attenuates autoreactivity in experimental autoimmune encephalomyelitis. Proc Natl Acad Sci USA 108: 2040–2045. doi: 10.1073/pnas.1008721108
![]() |
[81] |
Delgoffe GM, Woo SR, Turnis ME, et al. (2013) Stability and function of regulatory T cells is maintained by a neuropilin-1-semaphorin-4a axis. Nature 501: 252–256. doi: 10.1038/nature12428
![]() |
[82] |
Hansen W, Hutzler M, Abel S, et al. (2012) Neuropilin 1 deficiency on CD4+Foxp3+ regulatory T cells impairs mouse melanoma growth. J Exp Med 209: 2001–2016. doi: 10.1084/jem.20111497
![]() |
[83] |
Milpied P, Massot B, Renand A, et al. (2011) IL-17-producing invariant NKT cells in lymphoid organs are recent thymic emigrants identified by neuropilin-1 expression. Blood 118: 2993–3002. doi: 10.1182/blood-2011-01-329268
![]() |
[84] |
Sarris M, Andersen KG, Randow F, et al. (2008) Neuropilin-1 expression on regulatory T cells enhances their interactions with dendritic cells during antigen recognition. Immunity 28: 402–413. doi: 10.1016/j.immuni.2008.01.012
![]() |
[85] |
Bourbie-Vaudaine S, Blanchard N, Hivroz C, et al. (2006) Dendritic cells can turn CD4+ T lymphocytes into vascular endothelial growth factor-carrying cells by intercellular neuropilin-1 transfer. J Immunol 177: 1460–1469. doi: 10.4049/jimmunol.177.3.1460
![]() |
[86] |
Casazza A, Laoui D, Wenes M, et al. (2013) Impeding macrophage entry into hypoxic tumor areas by Sema3A/Nrp1 signaling blockade inhibits angiogenesis and restores antitumor immunity. Cancer Cell 24: 695–709. doi: 10.1016/j.ccr.2013.11.007
![]() |
[87] |
Dejda A, Mawambo G, Daudelin JF, et al. (2016) Neuropilin-1-expressing microglia are associated with nascent retinal vasculature yet dispensable for developmental angiogenesis. Invest Ophth Vis Sci 57: 1530–1536. doi: 10.1167/iovs.15-18598
![]() |
[88] | Zhang W, Lv Y, Xue Y, et al. (2016b) Co-expression modules of NF1, PTEN and sprouty enable distinction of adult diffuse gliomas according to pathway activities of receptor tyrosine kinases. Oncotarget 7: 59098–59114. |
[89] |
Glinka Y, Stoilova S, Mohammed N, et al. (2011) Neuropilin-1 exerts co-receptor function for TGF-beta-1 on the membrane of cancer cells and enhances responses to both latent and active TGF-beta. Carcinogenesis 32: 613–621. doi: 10.1093/carcin/bgq281
![]() |
[90] | Miyauchi JT, Caponegro MD, Chen D, et al. (2017) Deletion of neuropilin 1 from microglia or bone marrow-derived macrophages slows glioma progression. Cancer Res 78: 685–694. |
[91] | Osada H, Tokunaga T, Nishi M, et al. (2004) Overexpression of the neuropilin 1 (NRP1) gene correlated with poor prognosis in human glioma. Anticancer Res 24: 547–552. |
[92] |
Chen L, Miao W, Tang X, et al. (2013) Inhibitory effect of neuropilin-1 monoclonal antibody (NRP-1 MAb) on glioma tumor in mice. J Biomed Nanotechnol 9: 551–558. doi: 10.1166/jbn.2013.1623
![]() |
[93] |
Formolo CA, Williams R, Gordish-Dressman H, et al. (2011) Secretome signature of invasive glioblastoma multiforme. J Proteome Res 10: 3149–3159. doi: 10.1021/pr200210w
![]() |
[94] | Li X, Tang T, Lu X, et al. (2011) RNA interference targeting NRP-1 inhibits human glioma cell proliferation and enhances cell apoptosis. Mol Med Rep 4: 1261–1266. |
[95] |
Nasarre C, Roth M, Jacob L, et al. (2010) Peptide-based interference of the transmembrane domain of neuropilin-1 inhibits glioma growth in vivo. Oncogene 29: 2381–2392. doi: 10.1038/onc.2010.9
![]() |
[96] |
Bagci T, Wu JK, Pfannl R, et al. (2009) Autocrine semaphorin 3A signaling promotes glioblastoma dispersal. Oncogene 28: 3537–3550. doi: 10.1038/onc.2009.204
![]() |
[97] |
Treps L, Edmond S, Harford-Wright E, et al. (2016) Extracellular vesicle-transported Semaphorin3A promotes vascular permeability in glioblastoma. Oncogene 35: 2615–2623. doi: 10.1038/onc.2015.317
![]() |
[98] | Jacob L, Sawma P, Garnier N, et al. (2016) Inhibition of PlexA1-mediated brain tumor growth and tumor-associated angiogenesis using a transmembrane domain targeting peptide. Oncotarget 7: 57851–57865. |
[99] |
Sulpice E, Plouet J, Berge M, et al. (2008) Neuropilin-1 and neuropilin-2 act as coreceptors, potentiating proangiogenic activity. Blood 111: 2036–2045. doi: 10.1182/blood-2007-04-084269
![]() |
[100] |
Hamerlik P, Lathia JD, Rasmussen R, et al. (2012) Autocrine VEGF-VEGFR2-Neuropilin-1 signaling promotes glioma stem-like cell viability and tumor growth. J Exp Med 209: 507–520. doi: 10.1084/jem.20111424
![]() |
[101] |
Gilbert MR, Dignam JJ, Armstrong TS, et al. (2014) A randomized trial of bevacizumab for newly diagnosed glioblastoma. New Engl J Med 370: 699–708. doi: 10.1056/NEJMoa1308573
![]() |
[102] | Frei K, Gramatzki D, Tritschler I, et al. (2015) Transforming growth factor-beta pathway activity in glioblastoma. Oncotarget 6: 5963–5977. |
[103] |
Maxwell M, Galanopoulos T, Neville-Golden J, et al. (1992) Effect of the expression of transforming growth factor-beta 2 in primary human glioblastomas on immunosuppression and loss of immune surveillance. J Neurosurg 76: 799–804. doi: 10.3171/jns.1992.76.5.0799
![]() |
[104] |
Platten M, Wick W, Weller M (2001) Malignant glioma biology: role for TGF-beta in growth, motility, angiogenesis, and immune escape. Microsc Res Tech 52: 401–410. doi: 10.1002/1097-0029(20010215)52:4<401::AID-JEMT1025>3.0.CO;2-C
![]() |
[105] |
Chen ML, Pittet MJ, Gorelik L, et al. (2005) Regulatory T cells suppress tumor-specific CD8 T cell cytotoxicity through TGF-beta signals in vivo. Proc Natl Acad Sci USA 102: 419–424. doi: 10.1073/pnas.0408197102
![]() |
[106] |
Thomas DA, Massague J (2005) TGF-beta directly targets cytotoxic T cell functions during tumor evasion of immune surveillance. Cancer Cell 8: 369–380. doi: 10.1016/j.ccr.2005.10.012
![]() |
[107] |
Wesolowska A, Kwiatkowska A, Slomnicki L, et al. (2008) Microglia-derived TGF-beta as an important regulator of glioblastoma invasion--an inhibition of TGF-beta-dependent effects by shRNA against human TGF-beta type II receptor. Oncogene 27: 918–930. doi: 10.1038/sj.onc.1210683
![]() |
[108] |
Uhl M, Aulwurm S, Wischhusen J, et al. (2004) SD-208, a novel transforming growth factor beta receptor I kinase inhibitor, inhibits growth and invasiveness and enhances immunogenicity of murine and human glioma cells in vitro and in vivo. Cancer Res 64: 7954–7961. doi: 10.1158/0008-5472.CAN-04-1013
![]() |
[109] |
Ueda R, Fujita M, Zhu X, et al. (2009) Systemic inhibition of transforming growth factor-beta in glioma-bearing mice improves the therapeutic efficacy of glioma-associated antigen peptide vaccines. Clin Cancer Res 15: 6551–6559. doi: 10.1158/1078-0432.CCR-09-1067
![]() |
[110] |
Rodon J, Carducci MA, Sepulveda-Sanchez JM, et al. (2015) First-in-human dose study of the novel transforming growth factor-beta receptor I kinase inhibitor LY2157299 monohydrate in patients with advanced cancer and glioma. Clin Cancer Res 21: 553–560. doi: 10.1158/1078-0432.CCR-14-1380
![]() |
[111] |
Falco SD (2012) The discovery of placenta growth factor and its biological activity. Exp Mol Med 44: 1–9. doi: 10.3858/emm.2012.44.1.025
![]() |
[112] | Dewerchin M, Carmeliet P (2012) PlGF: a multitasking cytokine with disease-restricted activity. Csh Perspect Med 2: 143–152. |
[113] |
Lassen U, Chinot OL, McBain C, et al. (2015) Phase 1 dose-escalation study of the antiplacental growth factor monoclonal antibody RO5323441 combined with bevacizumab in patients with recurrent glioblastoma. Neuro Oncol 17: 1007–1015. doi: 10.1093/neuonc/nov019
![]() |
[114] |
Snuderl M, Batista A, Kirkpatrick ND, et al. (2013) Targeting placental growth factor/neuropilin 1 pathway inhibits growth and spread of medulloblastoma. Cell 152: 1065–1076. doi: 10.1016/j.cell.2013.01.036
![]() |
[115] |
Guo Y, Wang X, Tian X, et al. (2012) Tumor-derived hepatocyte growth factor is associated with poor prognosis of patients with glioma and influences the chemosensitivity of glioma cell line to cisplatin in vitro. World J Surg Oncol 10: 1–11. doi: 10.1186/1477-7819-10-1
![]() |
[116] |
Wen PY, Schiff D, Cloughesy TF, et al. (2011) A phase II study evaluating the efficacy and safety of AMG 102 (rilotumumab) in patients with recurrent glioblastoma. Neuro Oncol 13: 437–446. doi: 10.1093/neuonc/noq198
![]() |
[117] | De Groot JF, Prados M, Urquhart T, et al. (2009) A phase II study of XL184 in patients (pts) with progressive glioblastoma multiforme (GBM) in first or second relapse. J Clin Oncol 27: 2047. |
[118] |
Schiff D, Desjardins A, Cloughesy T, et al. (2016) Phase 1 dose escalation trial of the safety and pharmacokinetics of cabozantinib concurrent with temozolomide and radiotherapy or temozolomide after radiotherapy in newly diagnosed patients with high-grade gliomas. Cancer 122: 582–587. doi: 10.1002/cncr.29798
![]() |
[119] |
Wu HB, Wang Z, Wang QS, et al. (2015) Use of labelled tLyP-1 as a novel ligand targeting the NRP receptor to image glioma. PLoS One 10: e0137676. doi: 10.1371/journal.pone.0137676
![]() |
[120] |
Ying M, Shen Q, Zhan C, et al. (2016) A stabilized peptide ligand for multifunctional glioma targeted drug delivery. J Control Release 243: 86–98. doi: 10.1016/j.jconrel.2016.09.035
![]() |
[121] |
Ying M, Zhan C, Wang S, et al. (2016) Liposome-based systemic glioma-targeted drug delivery enabled by all-d peptides. ACS Appl Mater Inter 8: 29977–29985. doi: 10.1021/acsami.6b10146
![]() |
[122] |
Liu C, Yao S, Li X, et al. (2017) iRGD-mediated core-shell nanoparticles loading carmustine and O6-benzylguanine for glioma therapy. J Drug Target 25: 235–246. doi: 10.1080/1061186X.2016.1238091
![]() |
[123] |
Liu Y, Mei L, Xu C, et al. (2016) Dual receptor recognizing cell penetrating peptide for selective targeting, efficient intratumoral diffusion and synthesized anti-glioma therapy. Theranostics 6: 177–191. doi: 10.7150/thno.13532
![]() |
[124] |
Bechet D, Auger F, Couleaud P, et al. (2015) Multifunctional ultrasmall nanoplatforms for vascular-targeted interstitial photodynamic therapy of brain tumors guided by real-time MRI. Nanomed-Nanotechnol 11: 657–670. doi: 10.1016/j.nano.2014.12.007
![]() |
[125] |
Patnaik A, Lorusso PM, Messersmith WA, et al. (2014) A Phase Ib study evaluating MNRP1685A, a fully human anti-NRP1 monoclonal antibody, in combination with bevacizumab and paclitaxel in patients with advanced solid tumors. Cancer Chemoth Pharm 73: 951–960. doi: 10.1007/s00280-014-2426-8
![]() |
1. | D E Andreev, P V Baranov, A Milogorodskii, D Rachinskii, A deterministic model for non-monotone relationship between translation of upstream and downstream open reading frames, 2021, 38, 1477-8599, 490, 10.1093/imammb/dqab015 | |
2. | Aleksandra V. Suhorukova, Denis S. Sobolev, Irina G. Milovskaya, Vitaliy S. Fadeev, Irina V. Goldenkova-Pavlova, Alexander A. Tyurin, A Molecular Orchestration of Plant Translation under Abiotic Stress, 2023, 12, 2073-4409, 2445, 10.3390/cells12202445 | |
3. | Arash Tirandaz, Abolfazl Ramezanpour, Vivi Rottschäfer, Mehrad Babaei, Andrei Zinovyev, Alireza Mashaghi, Messenger size optimality in cellular communications, 2025, 111, 2470-0045, 10.1103/PhysRevE.111.044406 |
Parameter | Model(s) | Parameter meaning in a specific model and relation to other parameters |
${k}_{T}$ | $\mathfrak{M}$ 0, $\mathfrak{M}$ 0', $\mathfrak{M}$ 1, $\mathfrak{M}$ 1', $\mathfrak{M}$ 0'reg | Rate constant of transcription process |
${k}_{1}$ | $\mathfrak{M}$ 0, $\mathfrak{M}$ 0', $\mathfrak{M}$ 0'reg | Rate constant of translation initiation. It includes the 40S subunit binding and scanning for the start codon. In the simplest model $\mathfrak{M}$ 0 it denotes both the rate of the first round of initiation and all further initiation events on already translated mRNA. |
${k}_{2}$ | $\mathfrak{M}$ 0, $\mathfrak{M}$ 0', $\mathfrak{M}$ 1, $\mathfrak{M}$ 1', $\mathfrak{M}$ 0'reg | Rate constant of ribosome assembly, including possible transient arrest of ribosomes before starting translation. |
${k}_{3}$ | $\mathfrak{M}$ 0, $\mathfrak{M}$ 0', $\mathfrak{M}$ 1, $\mathfrak{M}$ 1', $\mathfrak{M}$ 0'reg | Rate constant of translation elongation step; it also includes the rate of translation termination |
${k}_{d}$ | $\mathfrak{M}$ 0, $\mathfrak{M}$ 0', $\mathfrak{M}$ 1, $\mathfrak{M}$ 0'reg | Rate constant of mRNA degradation |
${k}_{rd}$ | $\mathfrak{M}$ 0, $\mathfrak{M}$ 0', $\mathfrak{M}$ 1, $\mathfrak{M}$ 1', $\mathfrak{M}$ 0'reg | Rate constant of premature ribosomal drop-off from translated mRNA |
${k}_{p}$ | $\mathfrak{M}$ 0, $\mathfrak{M}$ 0', $\mathfrak{M}$ 1, $\mathfrak{M}$ 1', $\mathfrak{M}$ 0'reg | Rate constant of protein degradation |
${k}_{01}$ | $\mathfrak{M}$ 0', $\mathfrak{M}$ 0'reg | Rate constant of the first round mRNA initialization and binding of the 40S subunit including specific steps of initialization |
${k}_{02}$ | $\mathfrak{M}$ 0', $\mathfrak{M}$ 1' | Rate constant of the first round of ribosomal assembly on initiated mRNA |
$ k_{1}^{+} $, $ k_{1}^{-} $ | $\mathfrak{M}$ 1, $\mathfrak{M}$ 1' | Rate constants of reversible binding of 40S subunit to mRNA |
${k}_{a}$ | $\mathfrak{M}$ 1, $\mathfrak{M}$ 1' | Rate constant of 40S subunit scanning of 5'UTR for the start codon. In the model $\mathfrak{M}$ 1' it includes binding of factors facilitating the scanning, collectively denoted as IF2 |
$ k_{01}^{+} $, $ k_{01}^{-} $ | $\mathfrak{M}$ 1' | Rate constants of reversible binding of both translation initiation factors, collectively denoted as IF1 and 40S to the naked mRNA (first round of initialisation) |
k ${}_{b}$ | $\mathfrak{M}$ 0'reg | Rate constant of irreversible binding of a regulatory molecule (such as microRNA) to mRNA |
$ k_{s}^{+} $, $ k_{s}^{-} $ | $\mathfrak{M}$ 0'reg | Rate constant of reversible capturing of mRNA to a compartment (such as P-bodies) where the translation is inhibited |
${k}_{bd}$ | $\mathfrak{M}$ 0'reg | Rate constant of degradation of mRNA in a compartment where the translation is inhibited |