The crux of scientific and technological innovation is talent, thus, examining the impact of the supply-demand equilibrium of talent policies in science and technology on innovation willingness provides a theoretical foundation for refining government innovation policies and enhancing human capital efficiency in technological innovation. In this study, we proposed a theoretical framework integrating the Expectancy Theory of Motivation and the Policy Acceptance Model, with the objective of investigating this incentive mechanism. Empirical analysis, facilitated by two mediating variables, policy perceived benefits and administrative burden, revealed that only supply-side policy supply-demand equilibrium has a significant positive impact on innovation willingness, while the supply-demand equilibrium of demand-based policies and the supply-demand equilibrium of institutional-environmental policies have no significant impact. This is likely due to the fact that supply-side policy equilibrium directly and substantially enhances the valence, expectancy, and instrumentality of innovation behaviors among scientific and technological talents. It is important to note that administrative burden significantly moderates the impact of policy perceived benefits, and both factors serve as fully mediating internal mechanisms in this process. This research proffers novel evidence pertaining to the primacy of supply-side instruments in motivating innovation. Moreover, it provides a public economics foundation for the optimization of talent policies and the advancement of efficient innovation resource allocation.
Citation: Shijing Zhang, Mengzi Wang, Fang Liu. Incentive mechanism of supply-demand equilibrium in science and technology talent policies on innovation willingness: An empirical study from China based on the perceived benefit-risk framework[J]. Quantitative Finance and Economics, 2025, 9(2): 400-424. doi: 10.3934/QFE.2025013
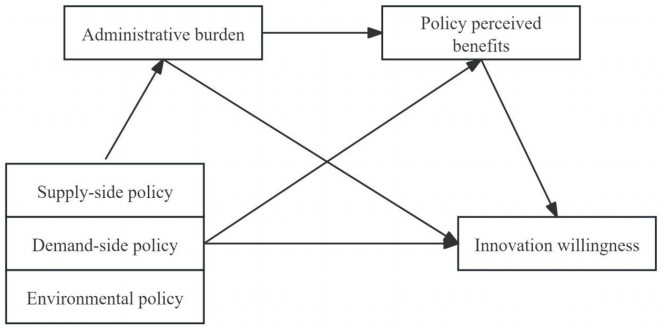
The crux of scientific and technological innovation is talent, thus, examining the impact of the supply-demand equilibrium of talent policies in science and technology on innovation willingness provides a theoretical foundation for refining government innovation policies and enhancing human capital efficiency in technological innovation. In this study, we proposed a theoretical framework integrating the Expectancy Theory of Motivation and the Policy Acceptance Model, with the objective of investigating this incentive mechanism. Empirical analysis, facilitated by two mediating variables, policy perceived benefits and administrative burden, revealed that only supply-side policy supply-demand equilibrium has a significant positive impact on innovation willingness, while the supply-demand equilibrium of demand-based policies and the supply-demand equilibrium of institutional-environmental policies have no significant impact. This is likely due to the fact that supply-side policy equilibrium directly and substantially enhances the valence, expectancy, and instrumentality of innovation behaviors among scientific and technological talents. It is important to note that administrative burden significantly moderates the impact of policy perceived benefits, and both factors serve as fully mediating internal mechanisms in this process. This research proffers novel evidence pertaining to the primacy of supply-side instruments in motivating innovation. Moreover, it provides a public economics foundation for the optimization of talent policies and the advancement of efficient innovation resource allocation.

| [1] |
Amrita D, Antonio N, Xu F (2017) Corruption, intrinsic motivation, and the love of praise. J Public Econ Theory 19: 1077–1098. https://doi.org/10.1111/jpet.12278 doi: 10.1111/jpet.12278

|
| [2] |
Anderson N, Potočnik K, Zhou J (2014) Innovation and creativity in organizations: A state-of-the-science review, prospective commentary, and guiding framework. J Manage 40: 1297–1333. https://doi.org/10.1177/0149206314527128 doi: 10.1177/0149206314527128
|
| [3] |
Baekgaard M, Moynihan D, Thomsen M (2021) So Why Do Policymakers Support Administrative Burdens? The Roles of Deservingness, Political Ideology, and Personal Experience. J Public Adm Res Theory 31: 184–200. https://doi.org/10.1093/jopart/muaa033 doi: 10.1093/jopart/muaa033
|
| [4] |
Bandiera O, Lemos R, Prat A, et al. (2018) Managing the Family Firm: Evidence from CEOs at Work. Rev Finan Stud 31: 1605–1653. https://doi.org/10.1093/rfs/hhx138 doi: 10.1093/rfs/hhx138
|
| [5] |
Bloom N, Reenen J, Williams H (2019) A Toolkit of Policies to Promote Innovation. J Econ Perspect 33: 163–184. https://doi.org/10.1257/jep.33.3.163 doi: 10.1257/jep.33.3.163
|
| [6] |
Borst R (2018) Comparing work engagement in people-changing and people-processing serviceproviders: A mediation model with red tape, autonomy, dimensions of PSM, and performance. Public Pers Manage 47: 287–313. https://doi.org/10.1177/0091026018770225 doi: 10.1177/0091026018770225
|
| [7] | Bozeman B, Feeney M (2011) Rules and Red Tape: A Prism for Public Administration Theory and Research. New York: Routledge. https://doi.org/10.4324/9781315701059 |
| [8] |
Bozeman B, Youtie J (2020) Robotic bureaucracy: Administrative burden and red tape in university research. Public Admin Rev 80: 157–162. https://doi.org/10.1111/puar.13105 doi: 10.1111/puar.13105
|
| [9] |
Carrigan C, Pandey S, Ryzin G (2020) Pursuing Consilience: Using Behavioral Public Administration to Connect Research on Bureaucratic Red Tape, Administrative Burden, and Regulation. Public Adm Rev 80: 46–52. https://doi.org/10.1111/puar.13143 doi: 10.1111/puar.13143
|
| [10] |
Che X, Zhou P, Wang M (2022) The policy effect on photovoltaic technology innovation with regional heterogeneity in China. Energy Econ 115: 106385. https://doi.org/10.1016/j.eneco.2022.106385 doi: 10.1016/j.eneco.2022.106385
|
| [11] |
Chen Q, Sun T, Wang T (2022) Synergy effect of talent policies on corporate innovation-Evidence from China. Front Psychol 13: 1069776. https://doi.org/10.3389/fpsyg.2022.1069776 doi: 10.3389/fpsyg.2022.1069776
|
| [12] |
Cho J, Cheon Y, Jun J W, et al. (2022) Digital advertising policy acceptance by out-of-home advertising firms: a combination of TAM and TOE framework. Int J Advert 41: 500–518. https://doi.org/10.1080/02650487.2021.1888562 doi: 10.1080/02650487.2021.1888562
|
| [13] | Davis D (1985) A Technology Acceptance Model for Empirically Testing New End-User Information Systems: Theory and Results. Massachusetts Institute of Technology. |
| [14] |
Dimand A, Abutabenjeh S, Evelyn R (2023) Human Capital Drivers of Employee Intent to Innovate: The Case of Public Procurement Professionals. Rev Public Pers Adm 43: 727–753. https://doi.org/10.1177/0734371X221123294 doi: 10.1177/0734371X221123294
|
| [15] |
Edler J, Fagerberg J (2017) Innovation Policy: What, Why, and How. Oxford Rev Econ Pol 33: 2–23. https://doi.org/10.1093/oxrep/grx001 doi: 10.1093/oxrep/grx001
|
| [16] |
Edquist C (2019) Towards a Holistic Innovation Policy: Can the Swedish National Innovation Council (NIC) Be a Role Model. Res Policy 48: 869–879. https://doi.org/10.1016/j.respol.2018.10.008 doi: 10.1016/j.respol.2018.10.008
|
| [17] |
Eriksson K, Ernkvist C, Laurell J, et al. (2019) A Revised Perspective on Innovation Policy for Renewal of Mature Economies – Historical Evidence from Finance and Telecommunications in Sweden 1980–1990. Technol Forecast Soc Change 147: 152–162. https://doi.org/10.1016/j.techfore.2019.07.001 doi: 10.1016/j.techfore.2019.07.001
|
| [18] | Fishbein M, Ajzen L (1975) Belief, attitude, intention and behaviour: An introduction to theory and research. MA: Addison-Wesley. |
| [19] |
Garrod L, Olczak M (2021) Supply- vs. Demand-Side Transparency: The Collusive Effects Under Imperfect Public Monitoring. J Ind Econ 69: 537–560. https://doi.org/10.1111/joie.12260 doi: 10.1111/joie.12260
|
| [20] |
Geels F (2004) From Sectoral Systems of Innovation to Socio-Technical Systems: Insights About Dynamics and Change From Sociology and Institutional Theory. Res Policy 33: 897–920. https://doi.org/10.1016/j.respol.2004.01.015 doi: 10.1016/j.respol.2004.01.015
|
| [21] |
Han Y, Liao J, Long L (2007) Model of development and empirical study on employee job performance construct. J Manage Sci in China 2007: 66–81. https://doi.org/10.3321/j.issn:1007-9807.2007.05.007 doi: 10.3321/j.issn:1007-9807.2007.05.007
|
| [22] |
Hattke F (2020) When the Red Tape Becomes Policy: A Critical Assessment of Administrative Burdens. J Public Adm Res Theory 30: 178–180. https://doi.org/10.1093/jopart/muz025 doi: 10.1093/jopart/muz025
|
| [23] | Hayes A (2013) Introduction to mediation, moderation, and conditional process analysis: A regression-based approach. New York: Guilford Press. |
| [24] | Herd P, Moynihan D (2019) Administrative burden: Policymaking by the means. New York: Russell Sage Foundation. https://doi.org/10.7758/9781610448789 |
| [25] |
Jiang Z, Shi J (2023) Quantity or quality? Policy effects on innovations in the wind power industry in China. Manage Decis Econ 44: 4507–4522. https://doi.org/10.1002/mde.3965 doi: 10.1002/mde.3965
|
| [26] |
Johnson D (2022) Burdens Are Everybody's Business: Examining the Intersection of Administrative Burdens, Motivation, and Entrepreneurial Culture. Admin Soc 54: 1965–1992. https://doi.org/10.1177/00953997221100373 doi: 10.1177/00953997221100373
|
| [27] |
Karlson N, Sandström C, Wennberg K (2021) Bureaucrats or Markets in Innovation Policy? A Critique of the Entrepreneurial State. Rev Austrian Econ 34: 81–95. https://doi.org/10.1007/s11138-020-00508-7 doi: 10.1007/s11138-020-00508-7
|
| [28] |
Kuhlmann S, Rip A (2018) Next-Generation Innovation Policy and Grand Challenges. Sci Public Policy 45: 448–454. https://doi.org/10.1093/scipol/scy011 doi: 10.1093/scipol/scy011
|
| [29] | Lerner J (2009) Boulevard of Broken Dreams: Why Public Efforts to Boost Entrepreneurship and Venture Capital Have Failed – And What to Do About It. Princeton: Princeton University Press. |
| [30] |
Lewis P (2020) The Innovation Systems Approach: An Austrian and Ostromian Perspective. Rev Austrian Econs 34: 1–18. https://doi.org/10.1007/s11138-020-00507-8 doi: 10.1007/s11138-020-00507-8
|
| [31] |
Lucas D, Fuller C, Piano E, et al. (2018) Visions of Entrepreneurship Policy. J Entrep Public Poli 7: 336–356. https://doi.org/10.1108/JEPP-D-18-00034 doi: 10.1108/JEPP-D-18-00034
|
| [32] |
Manso G (2011) Motivating Innovation. J Finance 66: 1823–1860. https://doi.org/10.1111/j.1540-6261.2011.01688.x doi: 10.1111/j.1540-6261.2011.01688.x
|
| [33] |
Moller A, Sheldon K (2020) Athletic Scholarships Are Negatively Associated With Intrinsic Motivation for Sports, Even Decades Later: Evidence for Long-Term Undermining. Motiv Sci 6: 43–48. https://doi.org/10.1037/mot0000133 doi: 10.1037/mot0000133
|
| [34] |
Moynihan D, Herd P, Harvey H (2015) Administrative burden: Learning, psychological, and compliance costs in citizen-state interactions. J Public Adm Res Theory 25: 43–69. https://doi.org/10.1093/jopart/muu009 doi: 10.1093/jopart/muu009
|
| [35] | Ni Y, Zhang J (2021) The Perception of Incentive Policies and Innovation Involvement on Scientific and Technological Workers: The Role of Work Value Orientation. Stud Sci Sci 39: 632–643. Abstract from: https://journal08.magtechjournal.com/kxxyj/CN/abstract/abstract23268.shtml. |
| [36] |
Ran J, Hu P, Tong H (2020) The influence Mechanism of Creator's Policy Perception on Innovation Behavior-The Mediation of Knowledge Acquisition and the Moderation of Self-efficacy of Innovation. Sci Technol Progress Policy 37: 1–9. https://doi.org/10.6049/kjjbydc.2019110799 doi: 10.6049/kjjbydc.2019110799
|
| [37] |
Rothwell R, Zegveld W (1981) Industrial innovation and public policy: preparing for the 1980s and the 1990s. Am Polit Sci Rev 76: 699. https://doi.org/10.2307/1963794 doi: 10.2307/1963794
|
| [38] |
Schot J, Steinmueller W (2018) Three Frames for Innovation Policy: R & D, Systems of Innovation and Transformative Change. Res Policy 47: 1554–1567. https://doi.org/10.1016/j.respol.2018.08.011 doi: 10.1016/j.respol.2018.08.011
|
| [39] |
Scott S, Bruce R (1994) Determinants of innovative behavior: A path model of individual innovation in the workplace. Acad Manage J 37: 580–607. https://doi.org/10.5465/256701 doi: 10.5465/256701
|
| [40] | Tang C, Li Z, Zhang J (2022) Motivation, Competence and Emotion: The Elements of Innovative Vitality of Scientific and Technological Talents and Their Empowerment. Chinese Public Admin 2022: 147–149. https://d.wanfangdata.com.cn/periodical/zgxzgl202212027 |
| [41] |
Venkatesh V, Smith R, Morris M, et al. (2003) User acceptance of information technology: Toward a unified view. Mis Quart 27: 425–478. https://doi.org/10.2307/30036540 doi: 10.2307/30036540
|
| [42] | Vroom H (1964) Work and motivation. New York: John Wiley and Sons. |
| [43] |
Wang O, Qi D, Liu Y (2023) Administrative Burdens in Chinese Public Services: A Case of Selective Affinity. China Quart 255: 734–752. https://doi.org/10.1017/S0305741023000036 doi: 10.1017/S0305741023000036
|
| [44] |
Zhu C, Tong P, Chen Y (2022) Research on Government's Behavior and Intention for Its Data Opening: An Empirical Study Based on TAM and BRA. J Shandong Univ (Philosophy and Social Science Edition) 2022: 68–78. https://doi.org/10.19836/j.cnki.37-1100/c.2022.02.007 doi: 10.19836/j.cnki.37-1100/c.2022.02.007
|
| [45] | Zhu J, Wang L (2019) Matching Relationship between Introduction Policy Supply and Individual Needs of Young Returnee Academics. J Higher Educ 40: 18–24. https://cstj.cqvip.com/Qikan/Article/Detail?id = 7002571524 |
Figures(1) / Tables(18)

Shijing Zhang, Mengzi Wang, Fang Liu. Incentive mechanism of supply-demand equilibrium in science and technology talent policies on innovation willingness: An empirical study from China based on the perceived benefit-risk framework[J]. Quantitative Finance and Economics, 2025, 9(2): 400-424. doi: 10.3934/QFE.2025013


 DownLoad: