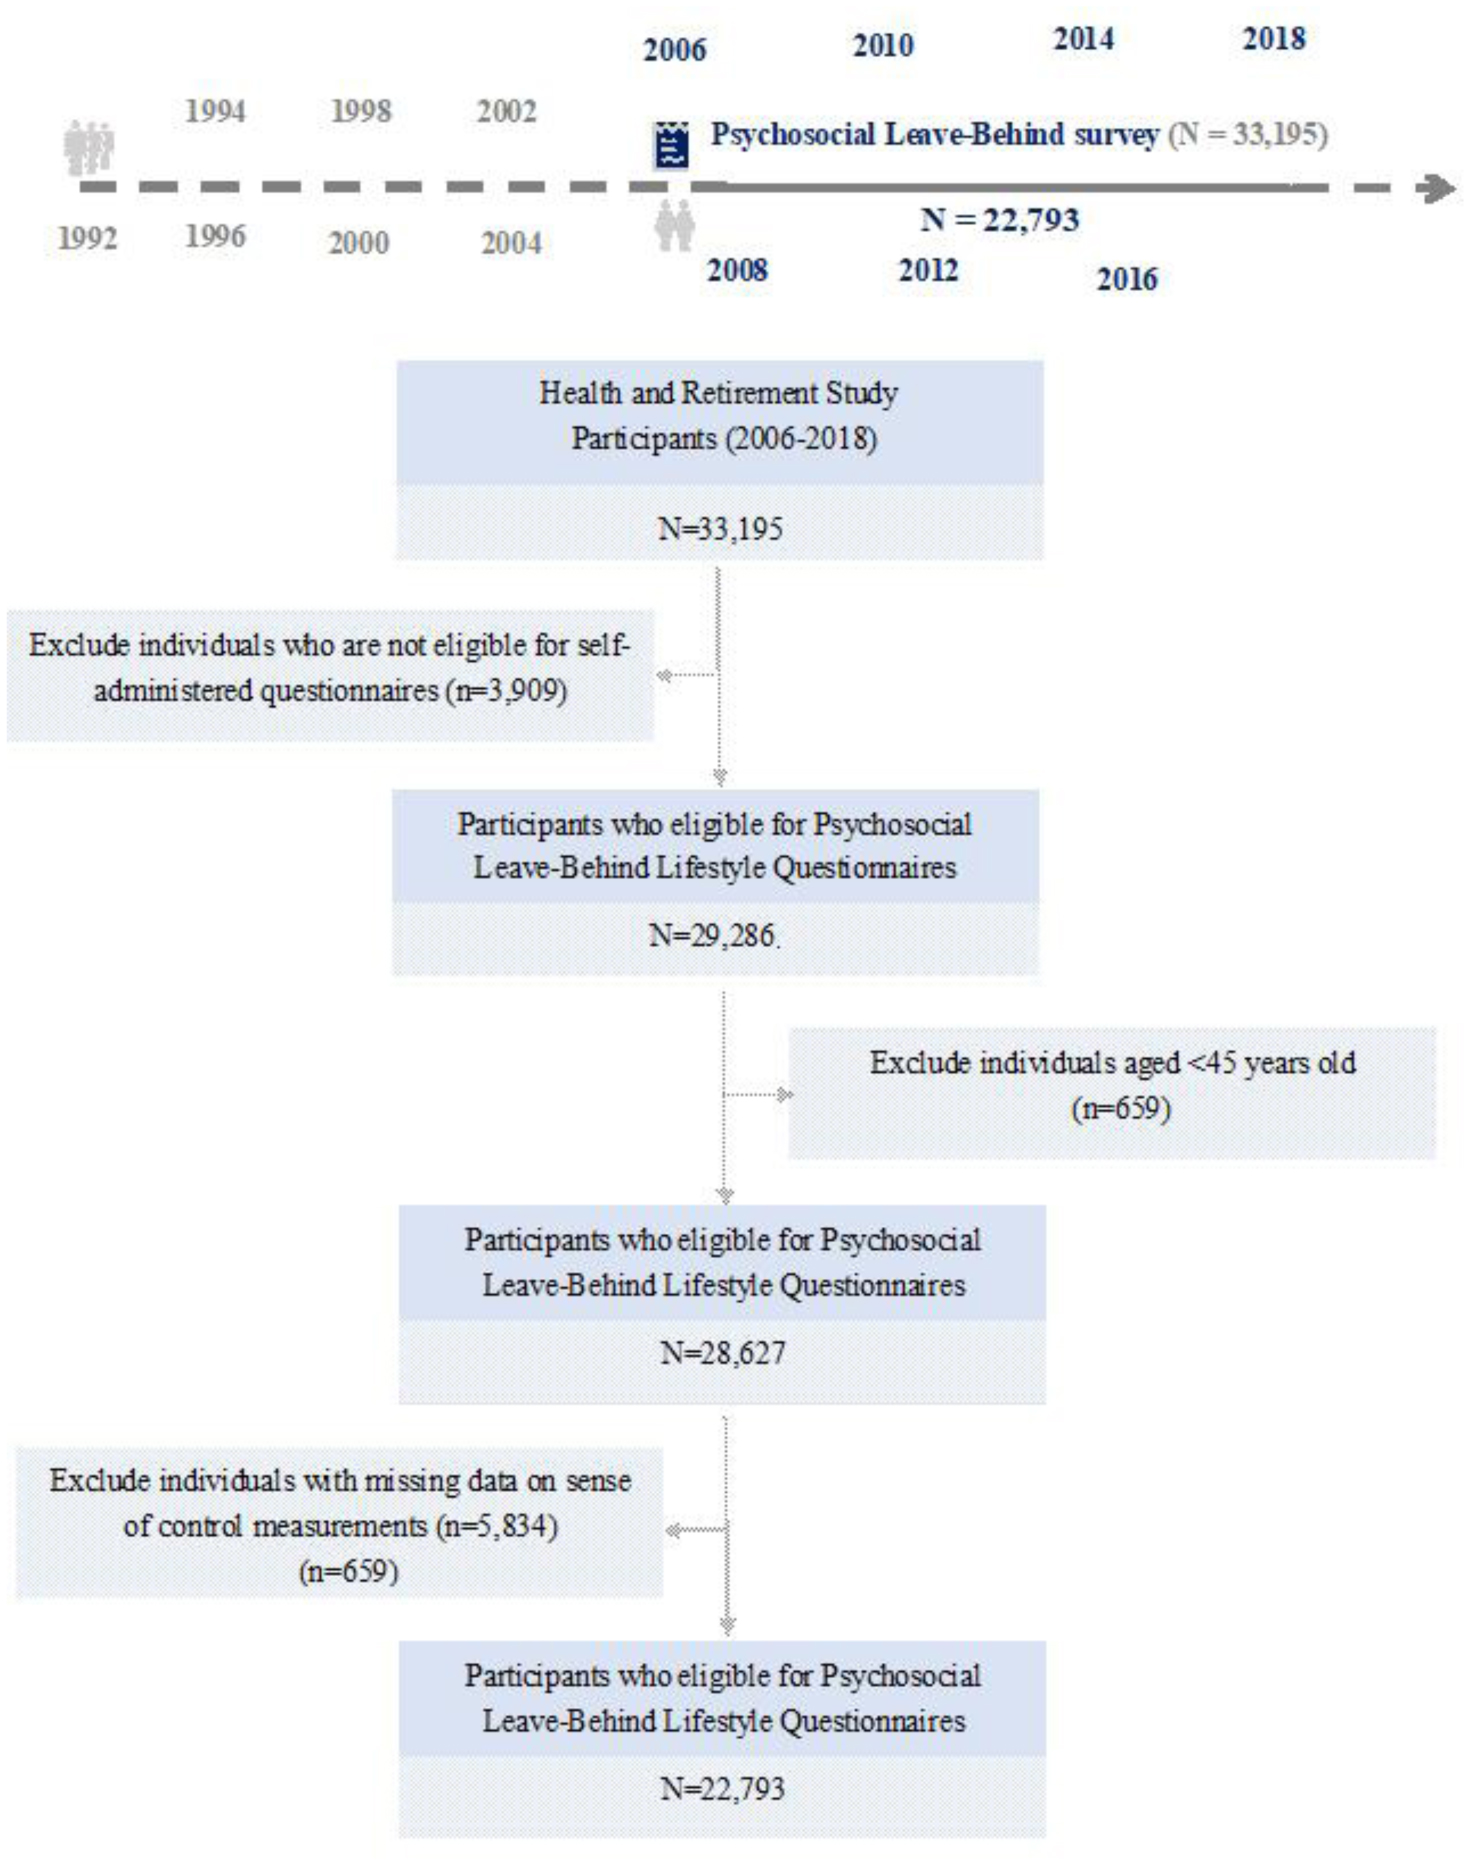
The salutary effects of a sense of control on health are well acknowledged; however, rigorous studies evaluating its effect on mortality remain scarce. This study aimed to study the association between a sense of control and mortality and to identify the effect of changes in this sense of control on mortality risk. This prospective cohort study included 22,793 participants over age 50 and their spouses, drawn from a nationally representative U.S. sample from 2006 to 2018. Cox proportional hazard regression analyses estimated the association between sense of control and all-cause mortality. Kaplan-Meier survival curves were compared using the log-rank test, and changes in sense of control levels associated with mortality risk were evaluated using the Cox proportional hazards model. Over the 12-year follow-up period, 5027 deaths were recorded. An increased sense of control was significantly associated with decreased mortality risk, as revealed by stratified analysis according to sex and age. Hazard ratios (HRs) for the second, third, and fourth quartiles of sense of control levels were 0.91 (95% CI, 0.84–0.98), 0.83 (95% CI, 0.77–0.92), and 0.79 (95% CI, 0.72–0.87), respectively, relative to the first quartile. Compared to individuals with stable sense of control scores from baseline to study conclusion, the HR was 0.58 (95% CI, 0.48–0.70) for those with increased scores and 1.81 (95% CI, 1.53–2.13) for those with decreased scores. High levels of sense of control were significantly associated with reduced mortality risk. These findings underscore the importance of a sense of control as a focus for public health interventions.
Citation: Ying Li, Yilin Chen, Xiwen Ding, Yin Chen, Wei Jiang. Association between sense of control and all-cause mortality: a prospective cohort study[J]. AIMS Public Health, 2025, 12(2): 360-377. doi: 10.3934/publichealth.2025021
The salutary effects of a sense of control on health are well acknowledged; however, rigorous studies evaluating its effect on mortality remain scarce. This study aimed to study the association between a sense of control and mortality and to identify the effect of changes in this sense of control on mortality risk. This prospective cohort study included 22,793 participants over age 50 and their spouses, drawn from a nationally representative U.S. sample from 2006 to 2018. Cox proportional hazard regression analyses estimated the association between sense of control and all-cause mortality. Kaplan-Meier survival curves were compared using the log-rank test, and changes in sense of control levels associated with mortality risk were evaluated using the Cox proportional hazards model. Over the 12-year follow-up period, 5027 deaths were recorded. An increased sense of control was significantly associated with decreased mortality risk, as revealed by stratified analysis according to sex and age. Hazard ratios (HRs) for the second, third, and fourth quartiles of sense of control levels were 0.91 (95% CI, 0.84–0.98), 0.83 (95% CI, 0.77–0.92), and 0.79 (95% CI, 0.72–0.87), respectively, relative to the first quartile. Compared to individuals with stable sense of control scores from baseline to study conclusion, the HR was 0.58 (95% CI, 0.48–0.70) for those with increased scores and 1.81 (95% CI, 1.53–2.13) for those with decreased scores. High levels of sense of control were significantly associated with reduced mortality risk. These findings underscore the importance of a sense of control as a focus for public health interventions.

| [1] | Chang AY, Skirbekk VF, Tyrovolas S, et al. (2019) Measuring population ageing: an analysis of the Global Burden of Disease Study 2017. Lancet Public Health 4: e159-e167. https://doi.org/10.1016/S2468-2667(19)30019-2 |
| [2] | GBD 2016 Disease and Injury Incidence and Prevalence Collaborators.Global, regional, and national incidence, prevalence, and years lived with disability for 328 diseases and injuries for 195 countries, 1990–2016: a systematic analysis for the Global Burden of Disease Study 2016. Lancet (2017) 390: 1211-1259. https://doi.org/10.1016/S0140-6736(17)32154-2 |
| [3] | Melo APS, Dippenaar IN, Johnson SC, et al. (2022) All-cause and cause-specific mortality among people with severe mental illness in Brazil's public health system, 2000–15: a retrospective study. Lancet Psychiatry 9: 771-781. https://doi.org/10.1016/S2215-0366(22)00237-1 |
| [4] | Avidor S, Palgi Y, Solomon Z (2021) The Moderating Role of Views of Aging in the Longitudinal Relationship Between Physical Health and Mental Distress. J Gerontol B Psychol Sci Soc Sci 76: 871-880. https://doi.org/10.1093/geronb/gbaa212 |
| [5] | Steptoe A, Deaton A, Stone AA (2015) Subjective wellbeing, health, and ageing. Lancet 385: 640-648. https://doi.org/10.1016/S0140-6736(13)61489-0 |
| [6] | GBD 2019 Mental Disorders Collaborators.Global, regional, and national burden of 12 mental disorders in 204 countries and territories, 1990–2019: a systematic analysis for the Global Burden of Disease Study 2019. Lancet Psychiatry (2022) 9: 137-150. https://doi.org/10.1016/S2215-0366(21)00395-3 |
| [7] | Das-Munshi J, Chang CK, Dutta R, et al. (2017) Ethnicity and excess mortality in severe mental illness: a cohort study. Lancet Psychiatry 4: 389-399. https://doi.org/10.1016/S2215-0366(17)30097-4 |
| [8] | Favril L, Yu R, Geddes JR, et al. (2023) Individual-level risk factors for suicide mortality in the general population: an umbrella review. Lancet Public Health 8: e868-e877. https://doi.org/10.1016/S2468-2667(23)00207-4 |
| [9] | India State-Level Disease Burden Initiative Mental Disorders C.The burden of mental disorders across the states of India: the Global Burden of Disease Study 1990–2017. Lancet Psychiatry (2020) 7: 148-161. https://doi.org/10.1016/S2215-0366(19)30475-4 |
| [10] | Penninx BW, Pine DS, Holmes EA, et al. (2021) Anxiety disorders. Lancet 397: 914-927. https://doi.org/10.1016/S0140-6736(21)00359-7 |
| [11] | Crimmins EM (2020) Social hallmarks of aging: Suggestions for geroscience research. Ageing Res Rev 63: 101136. https://doi.org/10.1016/j.arr.2020.101136 |
| [12] | Shankar A, McMunn A, Banks J, et al. (2011) Loneliness, social isolation, and behavioral and biological health indicators in older adults. Health Psychol 30: 377-385. https://doi.org/10.1037/a0022826 |
| [13] | Cosco TD, Howse K, Brayne C (2017) Healthy ageing, resilience and wellbeing. Epidemiol Psychiatr Sci 26: 579-583. https://doi.org/10.1017/S2045796017000324 |
| [14] | Wurm S, Tesch-Romer C, Tomasik MJ (2007) Longitudinal findings on aging-related cognitions, control beliefs, and health in later life. J Gerontol B Psychol Sci Soc Sci 62: 156-164. https://doi.org/10.1093/geronb/62.3.P156 |
| [15] | Bellingtier JA, Neupert SD, Kotter-Gruhn D (2017) The Combined Effects of Daily Stressors and Major Life Events on Daily Subjective Ages. J Gerontol B Psychol Sci Soc Sci 72: 613-621. https://doi.org/10.1093/geronb/gbv101 |
| [16] | Tse DCK, Finley KP, Crawford LF, et al. (2024) Capturing Successful Aging in Daily Life: Exploring the Intensive Longitudinal Findings from a US National Sample. Gerontologist 65: gnae121. https://doi.org/10.1093/geront/gnae121 |
| [17] | Robinson SA, Lachman ME (2017) Perceived Control and Aging: A Mini-Review and Directions for Future Research. Gerontology 63: 435-442. https://doi.org/10.1159/000468540 |
| [18] | Nyende A, Ellis-Hill C, Mantzoukas S (2023) A Sense of Control and Wellbeing in Older People Living with Frailty: A Scoping Review. J Gerontol Soc Work 66: 1043-1072. https://doi.org/10.1080/01634372.2023.2206438 |
| [19] | Kubzansky LD, Huffman JC, Boehm JK, et al. (2018) Reprint of: Positive Psychological Well-Being and Cardiovascular Disease: JACC Health Promotion Series. J Am Coll Cardiol 72: 3012-3026. https://doi.org/10.1016/j.jacc.2018.10.023 |
| [20] | Bergland A, Nicolaisen M, Thorsen K (2014) Predictors of subjective age in people aged 40-79 years: a five-year follow-up study. The impact of mastery, mental and physical health. Aging Ment Health 18: 653-661. https://doi.org/10.1080/13607863.2013.869545 |
| [21] | Lindström M, Pirouzifard M, Rosvall M, et al. (2022) Health locus of control and all-cause, cardiovascular, cancer and other cause mortality: A population-based study in southern Sweden. Prev Med 161: 107114. https://doi.org/10.1016/j.ypmed.2022.107114 |
| [22] | Ward MM (2013) Sense of control and self-reported health in a population-based sample of older Americans: assessment of potential confounding by affect, personality, and social support. Int J Behav Med 20: 140-147. https://doi.org/10.1007/s12529-011-9218-x |
| [23] | Krause N, Shaw BA (2000) Role-specific feelings of control and mortality. Psychol Aging 15: 617-626. https://doi.org/10.1037/0882-7974.15.4.617 |
| [24] | Assari S (2017) Race, sense of control over life, and short-term risk of mortality among older adults in the United States. Arch Med Sci 13: 1233-1240. https://doi.org/10.5114/aoms.2016.59740 |
| [25] | Clarke P, Fisher G, House J, et al. (2008) Guide to content of the HRS psychosocial leave-behind participant lifestyle questionnaires: 2004 & 2006. Ann Arbor, MI: University of Michigan. https://doi.org/10.7826/ISR-UM.06.585031.001.05.0016.2008 |
| [26] | Clench-Aas J, Nes RB, Aaro LE (2017) The perceived constraints subscale of the Sense of Mastery Scale: dimensionality and measurement invariance. Qual Life Res 26: 127-138. https://doi.org/10.1007/s11136-016-1359-6 |
| [27] | Lindström M, Rosvall M, Pirouzifard M (2023) Leisure-time physical activity, desire to increase physical activity, and mortality: A population-based prospective cohort study. Prev Med Rep 33: 102212. https://doi.org/10.1016/j.pmedr.2023.102212 |
| [28] | Prasad A, Shellito N, Alan Miller E, et al. (2023) Association of Chronic Diseases and Functional Limitations with Subjective Age: The Mediating Role of Sense of Control. J Gerontol B Psychol Sci Soc Sci 78: 10-19. https://doi.org/10.1093/geronb/gbac121 |
| [29] | Mitchell UA, Ailshire JA, Brown LL, et al. (2018) Education and Psychosocial Functioning Among Older Adults: 4-Year Change in Sense of Control and Hopelessness. J Gerontol B Psychol Sci Soc Sci 73: 849-859. https://doi.org/10.1093/geronb/gbw031 |
| [30] | De Las Cuevas C, Penate W, Sanz EJ (2014) The relationship of psychological reactance, health locus of control and sense of self-efficacy with adherence to treatment in psychiatric outpatients with depression. BMC Psychiatry 14: 324. https://doi.org/10.1186/s12888-014-0324-6 |
| [31] | Southwick FS, Southwick SM (2018) The Loss of a Sense of Control as a Major Contributor to Physician Burnout: A Neuropsychiatric Pathway to Prevention and Recovery. JAMA Psychiatry 75: 665-666. https://doi.org/10.1001/jamapsychiatry.2018.0566 |
| [32] | Bailis DS, Segall A, Mahon MJ, et al. (2001) Perceived control in relation to socioeconomic and behavioral resources for health. Soc Sci Med 52: 1661-1676. https://doi.org/10.1016/S0277-9536(00)00280-X |
| [33] | Turiano NA, Chapman BP, Agrigoroaei S, et al. (2014) Perceived control reduces mortality risk at low, not high, education levels. Health Psychol 33: 883-890. https://doi.org/10.1037/hea0000022 |
| [34] | Seeman M, Lewis S (1995) Powerlessness, health and mortality: a longitudinal study of older men and mature women. Soc Sci Med 41: 517-525. https://doi.org/10.1016/0277-9536(94)00362-W |
| [35] | Hong JH, Lachman ME, Charles ST, et al. (2021) The positive influence of sense of control on physical, behavioral, and psychosocial health in older adults: An outcome-wide approach. Prev Med 149: 106612. https://doi.org/10.1016/j.ypmed.2021.106612 |
| [36] | Cardarelli KM, Vernon SW, Baumler ER, et al. (2007) Sense of control and diabetes mellitus among U.S. adults: a cross-sectional analysis. Biopsychosoc Med 1: 19. https://doi.org/10.1186/1751-0759-1-19 |
| [37] | Krause N (2007) Age and decline in role-specific feelings of control. J Gerontol B Psychol Sci Soc Sci 62: S28-35. https://doi.org/10.1093/geronb/62.1.S28 |
| [38] | Wolinsky FD, Wyrwich KW, Babu AN, et al. (2003) Age, aging, and the sense of control among older adults: a longitudinal reconsideration. J Gerontol B Psychol Sci Soc Sci 58: S212-220. https://doi.org/10.1093/geronb/58.4.S212 |
| [39] | McAvay GJ, Seeman TE, Rodin J (1996) A longitudinal study of change in domain-specific self-efficacy among older adults. J Gerontol B Psychol Sci Soc Sci 51: 243-253. https://doi.org/10.1093/geronb/51B.5.P243 |
| [40] | Lachman ME, Weaver SL (1998) Sociodemographic variations in the sense of control by domain: findings from the MacArthur studies of midlife. Psychol Aging 13: 553-562. https://doi.org/10.1037/0882-7974.13.4.553 |
| [41] | Volker DL, Wu HL (2011) Cancer patients' preferences for control at the end of life. Qual Health Res 21: 1618-1631. https://doi.org/10.1177/1049732311415287 |
| [42] | Ward MM (2012) Sense of control and sociodemographic differences in self-reported health in older adults. Qual Life Res 21: 1509-1518. https://doi.org/10.1007/s11136-011-0068-4 |
| [43] | Uchino BN (2006) Social support and health: a review of physiological processes potentially underlying links to disease outcomes. J Behav Med 29: 377-387. https://doi.org/10.1007/s10865-006-9056-5 |
| [44] | Kato K, Zweig R, Schechter CB, et al. (2016) Positive attitude toward life, emotional expression, self-rated health, and depressive symptoms among centenarians and near-centenarians. Aging Ment Health 20: 930-939. https://doi.org/10.1080/13607863.2015.1056770 |


Figures(5) / Tables(4)

Ying Li, Yilin Chen, Xiwen Ding, Yin Chen, Wei Jiang. Association between sense of control and all-cause mortality: a prospective cohort study[J]. AIMS Public Health, 2025, 12(2): 360-377. doi: 10.3934/publichealth.2025021


 DownLoad: