In the present study, we aim to assess the trend in mortality in COVID-19 by time and sex in a large cohort using Datavant's Death Index database. The main objectives of this study are to analyze mortality cases over time, which are categorized by sex and age, and to identify potential reasons for the observed differences.
This is a retrospective cohort containing information on deceased individuals in the United States and Canada (n = 4,384,265). We included adult male and female patients with a clinical diagnosis of COVID-19 (January–December 2022) (ICD-10 code: U07.1). Mortality cases for males and females were presented over a three-year period of COVID-19 pandemic. Sex ratios presenting the change of mortality cases over time was also computed as the number of diagnosed males over female patients. Sex-differences in the mortality rates were illustrated by age groups.
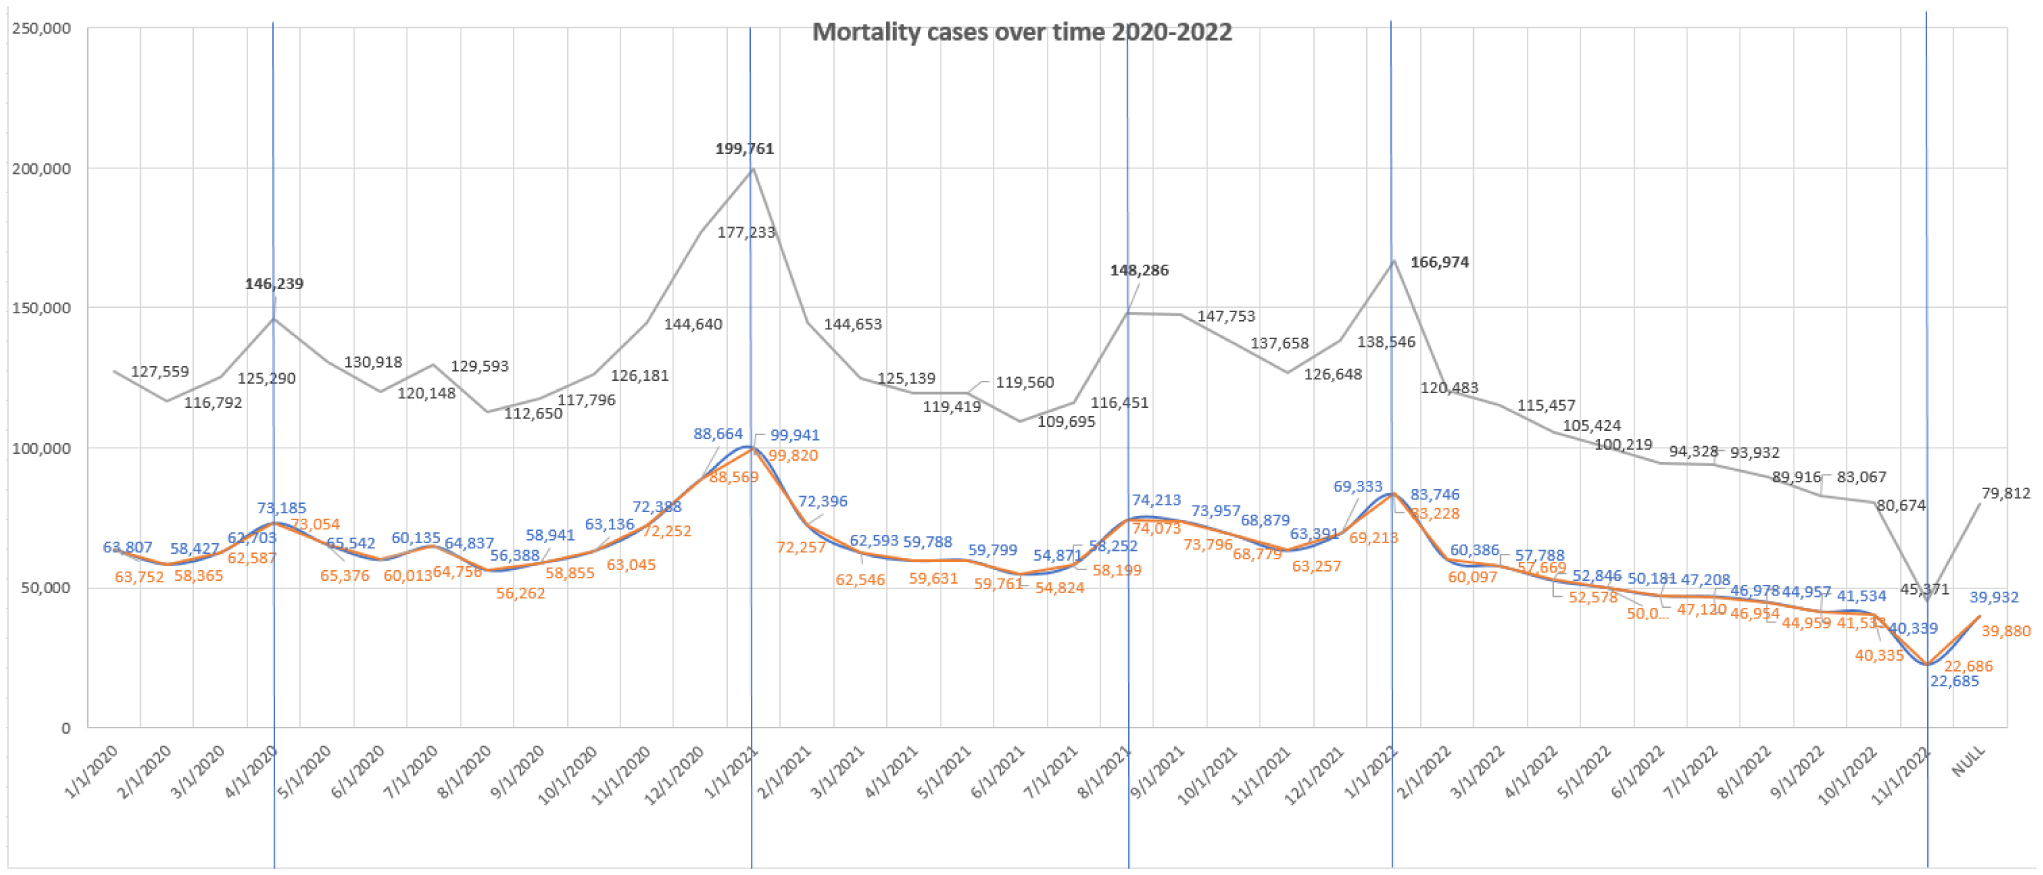
In 2020, mortality cases increased to reach up to 200,000 cases per day and fluctuated due to social and/or cultural events in the US. In 2021, mortality cases reached the highest peak over the time period despite the US vaccine rollout due to holiday gatherings during November and December 2021, as well as the spread of a more contagious strain of the virus. In 2022, mortality cases decreased due to widespread vaccinations and a rise in natural immunity following the first Omicron surge. Furthermore, the proportion of COVID-19 cases in males and females remained stable during the pandemic; however, the number of diagnosed male patients markedly increased during the first months of 2022. Gender discrepancies suggest the role of various factors such as occupation, underlying comorbidities, and behavioral and immunological factors.
Our study highlights higher mortality rates observed among males, suggesting that several factors may contribute to such differences, including social, behavioral, and biological factors. Our findings highlight the importance of implementing sex-specific treatment approaches in COVID-19 patients.
Citation: Samer A Kharroubi, Marwa Diab-El-Harake. Sex differences in COVID-19 mortality: A large US-based cohort study (2020–2022)[J]. AIMS Public Health, 2024, 11(3): 886-904. doi: 10.3934/publichealth.2024045
In the present study, we aim to assess the trend in mortality in COVID-19 by time and sex in a large cohort using Datavant's Death Index database. The main objectives of this study are to analyze mortality cases over time, which are categorized by sex and age, and to identify potential reasons for the observed differences.
This is a retrospective cohort containing information on deceased individuals in the United States and Canada (n = 4,384,265). We included adult male and female patients with a clinical diagnosis of COVID-19 (January–December 2022) (ICD-10 code: U07.1). Mortality cases for males and females were presented over a three-year period of COVID-19 pandemic. Sex ratios presenting the change of mortality cases over time was also computed as the number of diagnosed males over female patients. Sex-differences in the mortality rates were illustrated by age groups.
In 2020, mortality cases increased to reach up to 200,000 cases per day and fluctuated due to social and/or cultural events in the US. In 2021, mortality cases reached the highest peak over the time period despite the US vaccine rollout due to holiday gatherings during November and December 2021, as well as the spread of a more contagious strain of the virus. In 2022, mortality cases decreased due to widespread vaccinations and a rise in natural immunity following the first Omicron surge. Furthermore, the proportion of COVID-19 cases in males and females remained stable during the pandemic; however, the number of diagnosed male patients markedly increased during the first months of 2022. Gender discrepancies suggest the role of various factors such as occupation, underlying comorbidities, and behavioral and immunological factors.
Our study highlights higher mortality rates observed among males, suggesting that several factors may contribute to such differences, including social, behavioral, and biological factors. Our findings highlight the importance of implementing sex-specific treatment approaches in COVID-19 patients.

| [1] | The sex, gender and COVID-19 projectCOVID-19 Sex-Disaggregated Data Tracker (2023). Available from: http://globalhealth5050.org/covid19 |
| [2] |
Xie J, Tong Z, Guan X, et al. (2020) Clinical characteristics of patients who died of coronavirus disease 2019 in China. JAMA Netw Open 3: e205619. https://doi.org/10.1001/jamanetworkopen.2020.5619 
|
| [3] |
Guan W, Ni Z, Hu Y, et al. (2020) Clinical characteristics of coronavirus disease 2019 in China. N Engl J Med 382: 1708-1720. https://doi.org/10.1056/NEJMoa2002032
|
| [4] |
Niessen A, Teirlinck AC, McDonald SA, et al. (2022) Sex differences in COVID-19 mortality in the Netherlands. Infection 50: 709-717. https://doi.org/10.1007/s15010-021-01744-0
|
| [5] |
Wu C, Chen X, Cai Y, et al. (2020) Risk factors associated with acute respiratory distress syndrome and death in patients with coronavirus disease 2019 pneumonia in Wuhan, China. JAMA Intern Med 180: 934-943. https://doi.org/10.1001/jamainternmed.2020.0994
|
| [6] | Docherty AB, Harrison EM, Green CA, et al. (2020) Features of 20 133 UK patients in hospital with covid-19 using the ISARIC WHO Clinical Characterisation Protocol: prospective observational cohort study. BMJ : 369. https://doi.org/10.1136/bmj.m1985 |
| [7] | Islam N, Jdanov DA (2023) Age and sex adjustments are critical when comparing death rates. BMJ : 381. https://doi.org/10.1136/bmj.p845 |
| [8] |
Danielsen AC, Lee KM, Boulicault M, et al. (2022) Sex disparities in COVID-19 outcomes in the United States: Quantifying and contextualizing variation. Soc Sci Med 294: 114716. https://doi.org/10.1016/j.socscimed.2022.114716
|
| [9] |
Grande E, Fedeli U, Pappagallo M, et al. (2022) Variation in Cause-Specific Mortality Rates in Italy during the First Wave of the COVID-19 Pandemic: A Study Based on Nationwide Data. Int J Environ Res Public Health 19: 805. https://doi.org/10.3390/ijerph19020805
|
| [10] |
Kharroubi SA, Diab-El-Harake M (2022) Sex-differences in COVID-19 diagnosis, risk factors and disease comorbidities: A large US-based cohort study. Front Public Health 10: 1029190. https://doi.org/10.3389/fpubh.2022.1029190
|
| [11] |
Yoshida Y, Chu S, Fox S, et al. (2022) Sex differences in determinants of COVID-19 severe outcomes – findings from the National COVID Cohort Collaborative (N3C). BMC Infect Dis 22: 784. https://doi.org/10.1186/s12879-022-07776-7
|
| [12] | Péterfi A, Mészáros Á, Szarvas Z, et al. (2022) Comorbidities and increased mortality of COVID-19 among the elderly: A systematic review. Physiol Int . https://doi.org/10.1556/2060.2022.00206 |
| [13] |
Dorrucci M, Minelli G, Boros S, et al. (2021) Excess Mortality in Italy During the COVID-19 Pandemic: Assessing the Differences Between the First and the Second Wave, Year 2020. Front Public Health 9: 669209. https://doi.org/10.3389/fpubh.2021.669209
|
| [14] |
Mahmoud M, Carmisciano L, Tagliafico L, et al. (2021) Patterns of comorbidity and in-hospital mortality in older patients with COVID-19 infection. Front Med 8: 726837. https://doi.org/10.3389/fmed.2021.726837
|
| [15] |
Chang WH (2020) Understanding the COVID-19 pandemic from a gender perspective. Taiwan J Obstet Gynecol 59: 801-807. https://doi.org/10.1016/j.tjog.2020.09.004
|
| [16] |
Griffith DM, Sharma G, Holliday CS, et al. (2020) Men and COVID-19: a biopsychosocial approach to understanding sex differences in mortality and recommendations for practice and policy interventions. Prev Chronic Dis 17: E63. https://doi.org/10.5888/pcd17.200247
|
| [17] |
Scortichini M, Schneider dos Santos R, De'Donato F, et al. (2020) Excess mortality during the COVID-19 outbreak in Italy: a two-stage interrupted time-series analysis. Int J Epidemiol 49: 1909-1917. https://doi.org/10.1093/ije/dyaa169
|
| [18] |
Raparelli V, Palmieri L, Canevelli M (2020) Italian National Institute of Health COVID-19 mortality group. Sex differences in clinical phenotype and transitions of care among individuals dying of COVID-19 in Italy. Biol Sex Differ 11: 57. https://doi.org/10.1186/s13293-020-00334-3
|
| [19] |
Sanyaolu A, Okorie C, Marinkovic A, et al. (2020) Comorbidity and its impact on patients with COVID-19. SN Compr Clin Med 2: 1069-1076. https://doi.org/10.1007/s42399-020-00363-4
|
| [20] | WHOArchived: WHO Timeline - COVID-19 (2020). Available from: https://www.who.int/news/item/27-04-2020-who-timeline---covid-19 |
| [21] | Federal Reserve Archival System for Economic Research (FRASER)Timeline of Events Related to the COVID-19 Pandemic (2023). Available from: https://fraser.stlouisfed.org/timeline/covid-19-pandemic |
| [22] | CNNAt this rate, January will be the deadliest month of Covid-19 in the US (2021). Available from: https://edition.cnn.com/2021/01/10/health/us-coronavirus-sunday/index.html |
| [23] | CNBCU.S. reports record number of Covid deaths in January as new strains threaten progress (2021). Available from: https://www.cnbc.com/2021/01/27/us-reports-record-number-of-covid-deaths-in-january.html |
| [24] | CDCCOVID-19 Timeline (2023). Available from: https://www.defense.gov/Spotlights/Coronavirus-DOD-Response/Timeline/ |
| [25] | PETERSON-KFF Health System TrackerCOVID-19 continues to be a leading cause of death in the U.S. in August 2021 (2021). Available from: https://www.healthsystemtracker.org/brief/covid-19-continues-to-be-a-leading-cause-of-death-in-the-u-s-in-august-2021/#:~:text=In%20August%202021%2C%20an%20average,have%20been%20among%20unvaccinated%20people |
| [26] | ReutersCOVID cases decline for 6th week in Americas, deaths still rise -health agency (2022). Available from: https://www.reuters.com/business/healthcare-pharmaceuticals/covid-19-cases-decline-6th-week-americas-deaths-still-rise-says-agency-2022-02-16/ |
| [27] | CNN HealthCovid-19 killed fewer people in the US in 2022, but early data suggests it was still a leading cause of death (2023). Available from: https://edition.cnn.com/2023/01/17/health/covid-death-reporting-2022/index.html |
| [28] |
Haischer MH, Beilfuss R, Hart MR, et al. (2020) Who is wearing a mask? Gender-, age-, and location-related differences during the COVID-19 pandemic. PLoS One 15: e0240785. https://doi.org/10.1371/journal.pone.0240785
|
| [29] | Lab HG US Gender/Sex COVID-19 Data Tracker (2020). Available from: https://www.genderscilab.org/gender-and-sex-in-covid19 |
| [30] |
Karim SSA, Karim QA (2021) Omicron SARS-CoV-2 variant: a new chapter in the COVID-19 pandemic. Lancet 398: 2126-2128. https://doi.org/10.1016/S0140-6736(21)02758-6
|
| [31] |
Iaccarino G, Grassi G, Borghi C, et al. (2020) Age and multimorbidity predict death among COVID-19 patients: results of the SARS-RAS study of the Italian Society of Hypertension. Hypertension 76: 366-372. https://doi.org/10.1161/HYPERTENSIONAHA.120.15324
|
| [32] |
Zhao E, Crimmins EM (2022) Mortality and morbidity in ageing men: Biology, Lifestyle and Environment. Rev Endocr Metab Disord 23: 1285-1304. https://doi.org/10.1007/s11154-022-09737-6
|
| [33] |
Bello-Lujan LM, Serrano-Sanchez JA, Gonzalez-Henriquez JJ (2022) Stable Gender Gap and Similar Gender Trend in Chronic Morbidities between 1997–2015 in Adult Canary Population. Int J Environ Res Public Health 19: 9404. https://doi.org/10.3390/ijerph19159404
|
| [34] |
Harris CR, Jenkins M (2006) Gender differences in risk assessment: why do women take fewer risks than men?. Judgm Decis Mak 1: 48-63. https://doi.org/10.1017/S1930297500000346
|
| [35] |
Abarca Nava GJ, Pebley AR (2024) Racial, Ethnic, and Immigrant Generational Disparities in Physically Strenuous and Hazardous Work Conditions. J Immigr Minor Health 26: 268-277. https://doi.org/10.1007/s10903-023-01552-8
|
| [36] |
Bajaj V, Gadi N, Spihlman AP, et al. (2021) Aging, immunity, and COVID-19: how age influences the host immune response to coronavirus infections?. Front Physiol 11: 571416. https://doi.org/10.3389/fphys.2020.571416
|
| [37] |
Bartleson JM, Radenkovic D, Covarrubias AJ, et al. (2021) SARS-CoV-2, COVID-19 and the aging immune system. Nat Aging 1: 769-782. https://doi.org/10.1038/s43587-021-00114-7
|


Figures(3) / Tables(1)

Samer A Kharroubi, Marwa Diab-El-Harake. Sex differences in COVID-19 mortality: A large US-based cohort study (2020–2022)[J]. AIMS Public Health, 2024, 11(3): 886-904. doi: 10.3934/publichealth.2024045


 DownLoad: