Partial discharge (PD) is a significant electrical fault in gas-insulated switchgear (GIS), with various types posing different risks to insulation. Accurate identification of PD types is essential for enhancing GIS management and ensuring the reliability of electrical grids. This study proposes a novel approach for PD identification in GIS integrating completed local binary pattern (CLBP) feature extraction, feature engineering, and an optimized support vector machine (SVM). PD faults were simulated in GIS and phase-resolved pulse sequence (PRPS) data for four different forms of PD were gathered. CLBP was used to extract image features, and then the support vector machine recursive feature elimination (SVM-RFE) algorithm was used to evaluate feature importance. Then, linear discriminant analysis (LDA) was used to fuse the selected features and reduce redundancy. The fused features were classified using a bald eagle search algorithm combined with differential evolution (IBES)-optimized SVM, achieving a recognition accuracy of 99.38%. The results indicate that the proposed method effectively distinguishes between different PD PRPS patterns in GIS.
Citation: Ziqiang Xu, Honghua Xu, Chao Yuan, Shoulong Chen, Yini Chen. Recognition of partial discharge in GIS based on image feature fusion[J]. AIMS Energy, 2024, 12(6): 1096-1112. doi: 10.3934/energy.2024052
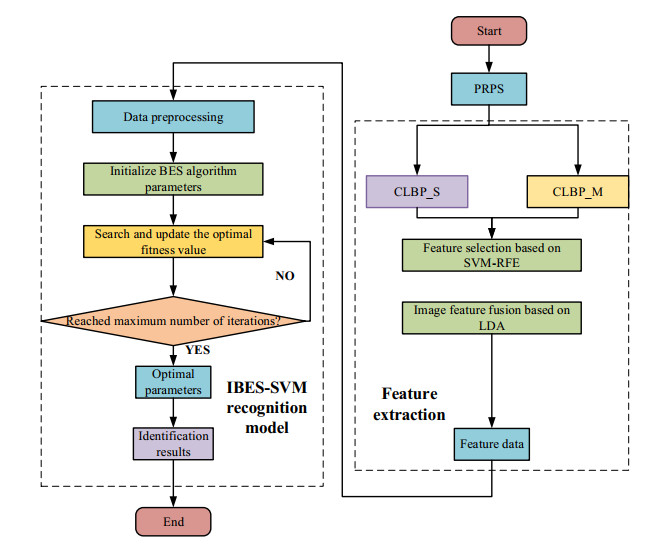
Partial discharge (PD) is a significant electrical fault in gas-insulated switchgear (GIS), with various types posing different risks to insulation. Accurate identification of PD types is essential for enhancing GIS management and ensuring the reliability of electrical grids. This study proposes a novel approach for PD identification in GIS integrating completed local binary pattern (CLBP) feature extraction, feature engineering, and an optimized support vector machine (SVM). PD faults were simulated in GIS and phase-resolved pulse sequence (PRPS) data for four different forms of PD were gathered. CLBP was used to extract image features, and then the support vector machine recursive feature elimination (SVM-RFE) algorithm was used to evaluate feature importance. Then, linear discriminant analysis (LDA) was used to fuse the selected features and reduce redundancy. The fused features were classified using a bald eagle search algorithm combined with differential evolution (IBES)-optimized SVM, achieving a recognition accuracy of 99.38%. The results indicate that the proposed method effectively distinguishes between different PD PRPS patterns in GIS.

| [1] |
Tuyet-Doan VN, Pho HA, Lee B, et al. (2021) Deep ensemble model for unknown partial discharge diagnosis in gas-insulated switchgears using convolutional neural networks. IEEE Access 9: 80524–80534. https://doi.org/10.1109/ACCESS.2021.3084950 doi: 10.1109/ACCESS.2021.3084950

|
| [2] | Tuyet-Doan VN, Nguyen TT, Nguyen MT, et al. (2020). Self-attention network for partial-discharge diagnosis in gas-insulated switchgear. Energies, 13. https://doi.org/10.3390/en13082102 |
| [3] |
Sabot SrA, Petit A, Taillebois JP (1996) GIS insulation coordination: On-site tests and dielectric diagnostic techniques, a utility point of view. IEEE Trans Power Delivery 11: 1309–1316. https://doi.org/10.1109/61.517485 doi: 10.1109/61.517485
|
| [4] | Li X, Tang H, Mu S, et al. (2012) Partial discharge monitoring system for PD characteristics of typical defects in GIS using UHF method. 2012 International Conference on High Voltage Engineering and Application, Shanghai, 625–628. https://doi.org/10.1109/ICHVE.2012.6357053 |
| [5] |
Han X, Zhang X, Guo R, et al. (2022) Partial discharge detection in gas-insulated switchgears using sensors integrated with uhf and optical sensing methods. IEEE Trans Dielectr Electr Insul 29: 2026–2033. https://doi.org/10.1109/TDEI.2022.3198715 doi: 10.1109/TDEI.2022.3198715
|
| [6] |
Yao R, Li J, Hui M, et al. (2022) Pattern recognition for partial discharge using adaptive boost classification model based on ensemble method. Power Syst Technol 46: 2410–2419. https://doi.org/10.13335/j.1000-3673.pst.2021.0780 doi: 10.13335/j.1000-3673.pst.2021.0780
|
| [7] |
Tang Z, Tang M, Li J, et al. (2018) Discussion on the resemblance of different partial discharges and accuracy of PD pattern recognition of GIS equipment. High Voltage Eng 44: 2479–2485. https://doi.org/10.13336/j.1003-6520.hve.20180228001 doi: 10.13336/j.1003-6520.hve.20180228001
|
| [8] | Gao J, Zhang Y, Li X, et al. (2022) Quantitative detection of multicomponent SF6 decomposition products based on Fourier transform infrared spectroscopy combined with CARS-ELM algorithm. IEEE Trans Instrum Meas, 71. https://doi.org/10.1109/TIM.2022.3194933 |
| [9] |
Zhang Q, Song H, Jiang Y, et al. (2018) Partial discharge pattern recognition of transformer based on OS-ELM. High Voltage Eng 44: 1122–1130. https://doi.org/10.13336/j.1003-6520.hve.20180329011 doi: 10.13336/j.1003-6520.hve.20180329011
|
| [10] |
Hu W, Li J, Liu X, et al. (2024) Partial discharge fault identification method for GIS equipment based on improved deep learning. J Eng, 2024. https://doi.org/10.1049/tje2.12386 doi: 10.1049/tje2.12386
|
| [11] | Zheng J, Chen Z, Wang Q, et al. (2022) GIS partial discharge pattern recognition based on time-frequency features and improved convolutional neural network. Energies, 15. https://doi.org/10.3390/en15197372 |
| [12] |
Wang H, Song S, Qian Y, et al. (2021) Recognition algorithm of GIS partial discharge phase resolved pulse sequence based on CLAHE enhancement. High Voltage Eng 47: 3836–3844. https://doi.org/10.13336/j.1003-6520.hve.20201240 doi: 10.13336/j.1003-6520.hve.20201240
|
| [13] |
Wang YX, Yan J, Yang Z, et al. (2023) A novel hybrid meta-learning for few-shot gas-insulated switchgear insulation defect diagnosis. Expert Syst Appl 233: 120956. https://doi.org/10.1016/j.eswa.2023.120956 doi: 10.1016/j.eswa.2023.120956
|
| [14] |
Li Z, Wang H, Qian Y, et al. (2022) Pattern recognition of partial discharge in the presence of noise based on speeded up robust features. Trans China Electrotech Soc 37: 775–785. https://doi.org/10.19595/j.cnki.1000-6753.tces.210018 doi: 10.19595/j.cnki.1000-6753.tces.210018
|
| [15] |
Li Z, Qian Y, Wang H, et al. (2022) Partial discharge fault diagnosis based on zernike moment and improved bacterial foraging optimization algorithm. Electric Power Syst Res, 207: 107854. https://doi.org/10.1016/j.epsr.2022.107854 doi: 10.1016/j.epsr.2022.107854
|
| [16] |
Park JY, Oh SK (2021) A Comparative study on CNN-based pattern classifier through partial discharge data processing methods. Trans Korean Institute Electr Eng 70: 515–525. https://doi.org/10.5370/KIEE.2021.70.3.515 doi: 10.5370/KIEE.2021.70.3.515
|
| [17] | Song S, Qian Y, Wang H, et al. (2020) Partial discharge pattern recognition based on 3D graphs of phase resolved pulse sequence. Energies, 13. https://doi.org/10.3390/en13164103 |
| [18] |
Song H, Dai J, Sheng G, et al. (2018) GIS partial discharge pattern recognition via deep convolutional neural network under complex data source. IEEE Trans Dielectr Electr Insul 25: 678–685. https://doi.org/10.1109/TDEI.2018.006930 doi: 10.1109/TDEI.2018.006930
|
| [19] |
Qiang Z, Jianhua A, Xiaoya S, et al. (2022) Extended complete local binary pattern for texture classification. Multimedia Tools Appl 81: 5389–5405. https://doi.org/10.1007/s11042-021-11776-1 doi: 10.1007/s11042-021-11776-1
|
| [20] |
Wang Y, Yan J, Yang Z, et al. (2023) Novel metric-based meta-learning model for few-shot diagnosis of partial discharge in a gas-insulated switchgear. ISA Trans 134: 268–277. https://doi.org/10.1016/j.isatra.2022.08.009 doi: 10.1016/j.isatra.2022.08.009
|
| [21] |
Wang Y, Yan J, Yang Z, et al. (2023) Simultaneous partial discharge diagnosis and localization in gas-insulated switchgear via a dual-task learning network. IEEE Trans Power Delivery 38: 4358–4370. https://doi.org/10.1109/TPWRD.2023.3312704 doi: 10.1109/TPWRD.2023.3312704
|
| [22] |
Alpaslan N (2022) Neutrosophic set based local binary pattern for texture classification. Expert Syst Appl 209: 118350. https://doi.org/10.1016/j.eswa.2022.118350 doi: 10.1016/j.eswa.2022.118350
|
| [23] |
Liu Q, Chen C, Zhang Y, et al. (2011) Feature selection for support vector machines with RBF kernel. Artificial Intell Rev 36: 99–115. https://doi.org/10.1007/s10462-011-9205-2 doi: 10.1007/s10462-011-9205-2
|
| [24] | Zhou M, Bian K, Hu F, et al. (2020) A new method based on CEEMD combined with iterative feature reduction for aided diagnosis of epileptic EEG. Front Bioeng Biotechnol, 8. https://doi.org/10.3389/fbioe.2020.00669 |
| [25] | Sholik M, Fatichah C, Amaliah B (2023) Classification of cervical cell images into healthy or cancer using convolution neural network and linear discriminant analysis. 2023 IEEE International Conference on Industry 4.0, Artificial Intelligence, and Communications Technology (IAICT), BALI, Indonesia, 383–389. https://doi.org/10.1109/IAICT59002.2023.10205826 |
| [26] |
Alsattar HA, Zaidan AA, Zaidan BB (2020) Novel meta-heuristic bald eagle search optimisation algorithm. Artificial Intell Rev 53: 2237–2264. https://doi.org/10.1007/s10462-019-09732-5 doi: 10.1007/s10462-019-09732-5
|


Figures(8) / Tables(3)

Ziqiang Xu, Honghua Xu, Chao Yuan, Shoulong Chen, Yini Chen. Recognition of partial discharge in GIS based on image feature fusion[J]. AIMS Energy, 2024, 12(6): 1096-1112. doi: 10.3934/energy.2024052


 DownLoad: