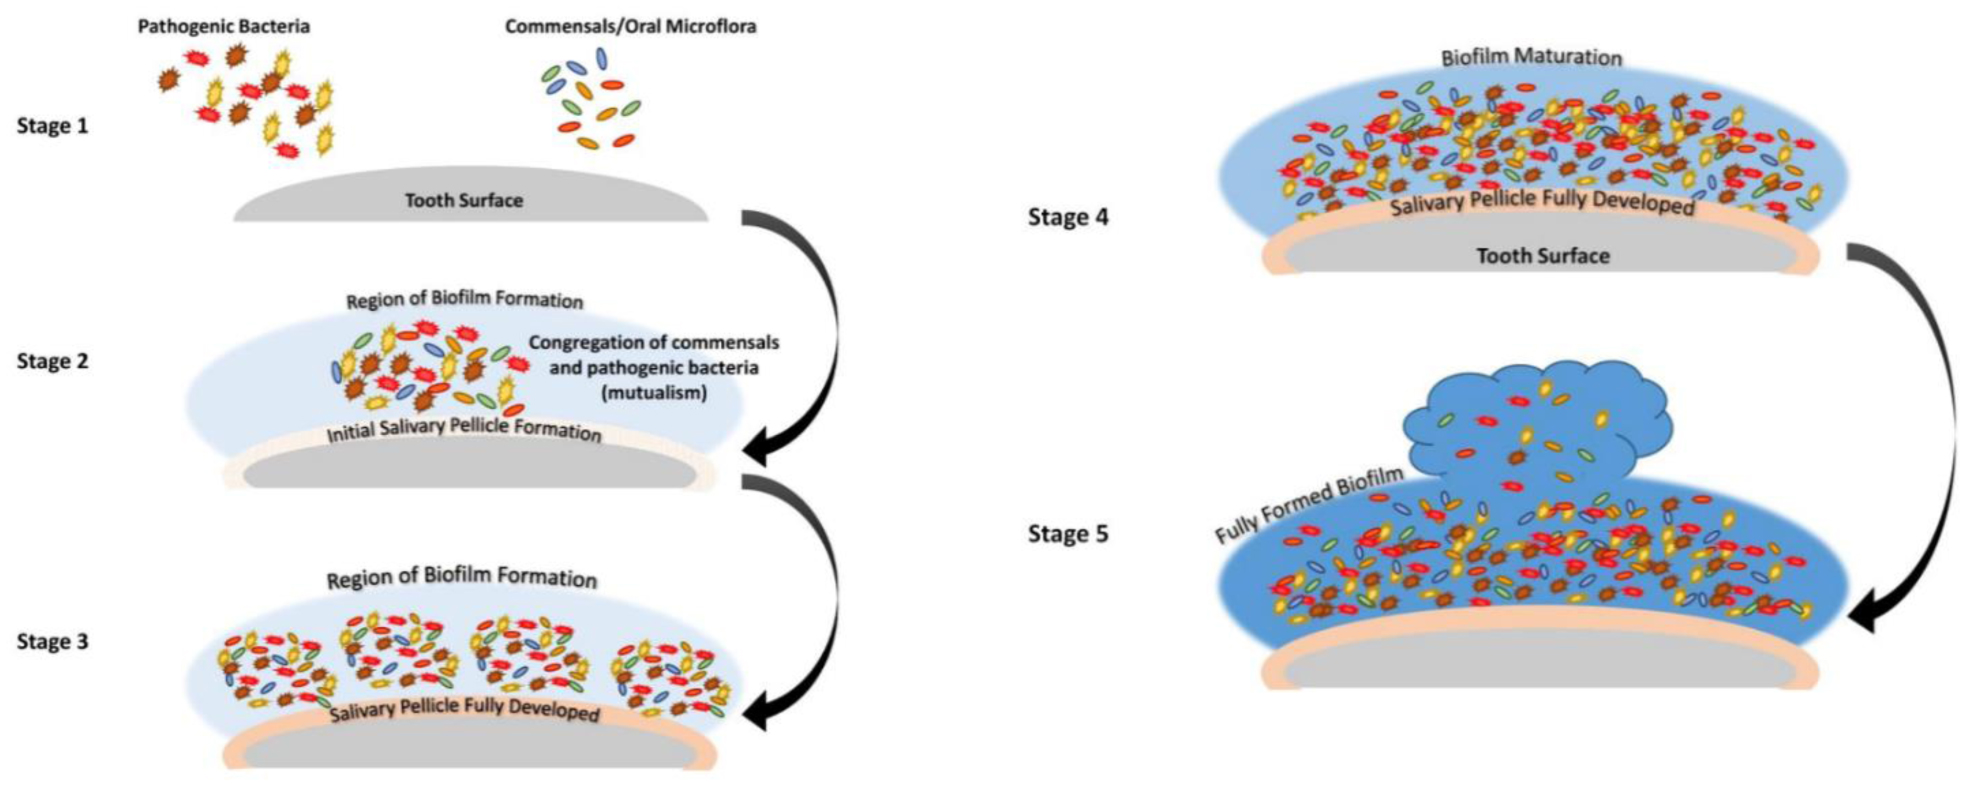
The oral microbiome represents an essential component of the oral ecosystem whose symbiotic relationship contributes to health maintenance. The biofilm represents a state of living of microorganisms surrounding themselves with a complex and tridimensional organized polymeric support and defense matrix. The substrates where the oral biofilm adhere can suffer from damages due to the microbial community metabolisms. Therefore, microbial biofilm represents the main etiological factor of the two pathologies of dental interest with the highest incidence, such as carious pathology and periodontal pathology. The study, analysis, and understanding of the characteristics of the biofilm, starting from the macroscopic structure up to the microscopic architecture, appear essential. This review examined the morphological methods used through the years to identify species, adhesion mechanisms that contribute to biofilm formation and stability, and how the action of microbicidal molecules is effective against pathological biofilm. Microscopy is the primary technique for the morphological characterization of biofilm. Light microscopy, which includes the stereomicroscope and confocal laser microscopy (CLSM), allows the visualization of microbial communities in their natural state, providing valuable information on the spatial arrangement of different microorganisms within the biofilm and revealing microbial diversity in the biofilm matrix. The stereomicroscope provides a three-dimensional view of the sample, allowing detailed observation of the structure, thickness, morphology, and distribution of the various species in the biofilm while CLSM provides information on its three-dimensional architecture, microbial composition, and dynamic development. Electron microscopy, scanning (SEM) or transmission (TEM), allows the high-resolution investigation of the architecture of the biofilm, analyzing the bacterial population, the extracellular polymeric matrix (EPS), and the mechanisms of the physical and chemical forces that contribute to the adhesion of the biofilm to the substrates, on a nanometric scale. More advanced microscopic methodologies, such as scanning transmission electron microscopy (STEM), high-resolution transmission electron microscopy (HR-TEM), and correlative microscopy, have enabled the evaluation of antibacterial treatments, due to the potential to reveal the efficacy of different molecules in breaking down the biofilm. In conclusion, evidence based on scientific literature shows that established microscopic methods represent the most common tools used to characterize biofilm and its morphology in oral microbiology. Further protocols and studies on the application of advanced microscopic techniques are needed to obtain precise details on the microbiological and pathological aspects of oral biofilm.
Citation: Davide Gerardi, Sara Bernardi, Angelo Bruni, Giovanni Falisi, Gianluca Botticelli. Characterization and morphological methods for oral biofilm visualization: where are we nowadays?[J]. AIMS Microbiology, 2024, 10(2): 391-414. doi: 10.3934/microbiol.2024020
The oral microbiome represents an essential component of the oral ecosystem whose symbiotic relationship contributes to health maintenance. The biofilm represents a state of living of microorganisms surrounding themselves with a complex and tridimensional organized polymeric support and defense matrix. The substrates where the oral biofilm adhere can suffer from damages due to the microbial community metabolisms. Therefore, microbial biofilm represents the main etiological factor of the two pathologies of dental interest with the highest incidence, such as carious pathology and periodontal pathology. The study, analysis, and understanding of the characteristics of the biofilm, starting from the macroscopic structure up to the microscopic architecture, appear essential. This review examined the morphological methods used through the years to identify species, adhesion mechanisms that contribute to biofilm formation and stability, and how the action of microbicidal molecules is effective against pathological biofilm. Microscopy is the primary technique for the morphological characterization of biofilm. Light microscopy, which includes the stereomicroscope and confocal laser microscopy (CLSM), allows the visualization of microbial communities in their natural state, providing valuable information on the spatial arrangement of different microorganisms within the biofilm and revealing microbial diversity in the biofilm matrix. The stereomicroscope provides a three-dimensional view of the sample, allowing detailed observation of the structure, thickness, morphology, and distribution of the various species in the biofilm while CLSM provides information on its three-dimensional architecture, microbial composition, and dynamic development. Electron microscopy, scanning (SEM) or transmission (TEM), allows the high-resolution investigation of the architecture of the biofilm, analyzing the bacterial population, the extracellular polymeric matrix (EPS), and the mechanisms of the physical and chemical forces that contribute to the adhesion of the biofilm to the substrates, on a nanometric scale. More advanced microscopic methodologies, such as scanning transmission electron microscopy (STEM), high-resolution transmission electron microscopy (HR-TEM), and correlative microscopy, have enabled the evaluation of antibacterial treatments, due to the potential to reveal the efficacy of different molecules in breaking down the biofilm. In conclusion, evidence based on scientific literature shows that established microscopic methods represent the most common tools used to characterize biofilm and its morphology in oral microbiology. Further protocols and studies on the application of advanced microscopic techniques are needed to obtain precise details on the microbiological and pathological aspects of oral biofilm.

| [1] |
Verma D, Garg PK, Dubey AK (2018) Insights into the human oral microbiome. Arch Microbiol 200: 525-540. https://doi.org/10.1007/s00203-018-1505-3 
|
| [2] |
Dewhirst FE, Chen T, Izard J, et al. (2010) The human oral microbiome. J Bacteriol 192: 5002-17. https://doi.org/10.1128/JB.00542-10
|
| [3] |
Reese S, Guggenheim B (2007) A novel TEM contrasting technique for extracellular polysaccharides in In Vitro biofilms. Microsc Res Tech 70: 816-822. https://doi.org/10.1002/jemt.20471
|
| [4] |
Rath S, Bal SCB, Dubey D (2021) Oral biofilm: development mechanism, multidrug resistance, and their effective management with novel techniques. Rambam Maimonides Med J 12: e0004. https://doi.org/10.5041/RMMJ.10428
|
| [5] |
Wade WG (2013) The oral microbiome in health and disease. Pharmacol Res 69: 137-43. https://doi.org/10.1016/j.phrs.2012.11.006
|
| [6] |
Karygianni L, Ren Z, Koo H (2020) Biofilm matrixome: extracellular components in structured microbial communities. Trends Microbiol 28: 668-681. https://doi.org/10.1016/j.tim.2020.03.016
|
| [7] |
Marsh PD, Do T, Beighton D, et al. (2016) Influence of saliva on the oral microbiota. Periodontol 2000 70: 80-92. https://doi.org/10.1111/prd.12098
|
| [8] |
Wessel SW, Chen Y, Maitra A, et al. (2014) Adhesion forces and composition of planktonic and adhering oral microbiomes. J Dent Res 93: 84-8. https://doi.org/10.1177/0022034513511822
|
| [9] |
Badihi Hauslich L, Sela MN, Steinberg D, et al. (2013) The adhesion of oral bacteria to modified titanium surfaces: role of plasma proteins and electrostatic forces. Clin Oral Implants Res 24: 49-56. https://doi.org/10.1111/j.1600-0501.2011.02364.x
|
| [10] |
Shao H, Demuth DR (2010) Quorum sensing regulation of biofilm growth and gene expression by oral bacteria and periodontal pathogens. Periodontol 2000 52: 53-67. https://doi.org/10.1111/j.1600-0757.2009.00318.x
|
| [11] |
Song L, Hou J, van der Mei HC, et al. (2016) Antimicrobials influence bond stiffness and detachment of oral bacteria. J Dent Res 95: 793-799. https://doi.org/10.1177/0022034516634631
|
| [12] |
Quirynen M, Bollen CM (1995) The influence of surface roughness and surface-free energy on supra- and subgingival plaque formation in man. A review of the literature. J Clin Periodontol 22: 1-14. https://doi.org/10.1111/j.1600-051x.1995.tb01765.x
|
| [13] |
Carniello V, Peterson BW, van der Mei HC, et al. (2018) Physico-chemistry from initial bacterial adhesion to surface-programmed biofilm growth. Adv Colloid Interface Sci 261: 1-14. https://doi.org/10.1016/j.cis.2018.10.005
|
| [14] |
Tuominen H, Collado MC, Rautava J, et al. (2019) Composition and maternal origin of the neonatal oral cavity microbiota. J Oral Microbiol 11: 1663084. https://doi.org/10.1080/20002297.2019.1663084
|
| [15] |
Zijnge V, van Leeuwen MB, Degener JE, et al. (2010) Oral biofilm architecture on natural teeth. PLoS One 5: e9321. https://doi.org/10.1371/journal.pone.0009321
|
| [16] |
Seidel CL, Gerlach RG, Wiedemann P, et al. (2020) Defining metaniches in the oral cavity according to their microbial composition and cytokine profile. Int J Mol Sci 21: 8218. https://doi.org/10.3390/ijms21218218
|
| [17] |
Gao L, Xu T, Huang G, et al. (2018) Oral microbiomes: more and more importance in oral cavity and whole body. Protein Cell 9: 488-500. https://doi.org/10.1007/s13238-018-0548-1
|
| [18] |
Hao Y, Huang X, Zhou X, et al. (2018) Influence of dental prosthesis and restorative materials interface on oral biofilms. Int J Mol Sci 19: 3157. https://doi.org/10.3390/ijms19103157
|
| [19] |
Shitomi K, Miyaji H, Miyata S, et al. (2020) Photodynamic inactivation of oral bacteria with silver nanoclusters/rose bengal nanocomposite. Photodiagnosis Photodyn Ther 30: 101647. https://doi.org/10.1016/j.pdpdt.2019.101647
|
| [20] |
Kriem LS, Wright K, Ccahuana-Vasquez RA, et al. (2020) Confocal Raman microscopy to identify bacteria in oral subgingival biofilm models. PLoS One 15: e0232912. https://doi.org/10.1371/journal.pone.0232912
|
| [21] |
Coico R (2005) Gram staining. Curr Protoc Microbiol . https://doi.org/10.1002/9780471729259.mca03cs00
|
| [22] | Moyes RB, Reynolds J, Breakwell DP (2009) Differential staining of bacteria: gram stain. Curr Protoc Microbiol . https://doi.org/10.1002/9780471729259.mca03cs15 |
| [23] |
Wang J, Chen W, Jiang Y, et al. (2013) Imaging of extraradicular biofilm using combined scanning electron microscopy and stereomicroscopy. Microsc Res Tech 76: 979-983. https://doi.org/10.1002/jemt.22257
|
| [24] |
Hirohata N, Komine-Aizawa S, Tamura M, et al. (2017) Porphyromonas gingivalis Suppresses Trophoblast Invasion by Soluble Factors. J Periodontol 88: 1366-1373. https://doi.org/10.1902/jop.2017.170193
|
| [25] |
Gu J, Wang H, Zhang M, et al. (2022) Application of fluorescence in situ hybridization (FISH) in oral microbial detection. Pathogens 11: 1450. https://doi.org/10.3390/pathogens11121450
|
| [26] | Bernardi S, Continenza MA, Al-Ahmad A, et al. (2019) Streptococcus spp. and Fusobacterium nucleatum in tongue dorsum biofilm from halitosis patients: a fluorescence in situ hybridization (FISH) and confocal laser scanning microscopy (CLSM) study. New Microbiol 42: 108-113. |
| [27] |
Karygianni L, Hellwig E, Al-Ahmad A (2014) Multiplex fluorescence in situ hybridization (M-FISH) and confocal laser scanning microscopy (CLSM) to analyze multispecies oral biofilms. Methods Mol Biol 1147: 65-72. https://doi.org/10.1007/978-1-4939-0467-9_5
|
| [28] |
Shen Y, Yu F, Qiu L, et al. (2023) Ecological influence by colonization of fluoride-resistant Streptococcus mutans in oral biofilm. Front Cell Infect Microbiol 12: 1106392. https://doi.org/10.3389/fcimb.2022.1106392
|
| [29] |
Aherne O, Ortiz R, Fazli MM, et al. (2022) Effects of stabilized hypochlorous acid on oral biofilm bacteria. BMC Oral Health 22: 415. https://doi.org/10.1186/s12903-022-02453-2
|
| [30] |
Tawakoli PN, Al-Ahmad A, Hoth-Hannig W, et al. (2013) Comparison of different live/dead stainings for detection and quantification of adherent microorganisms in the initial oral biofilm. Clin Oral Investig 17: 841-50. https://doi.org/10.1007/s00784-012-0792-3
|
| [31] |
Wang Z, de la Fuente-Núñez C, Shen Y, et al. (2015) Treatment of oral multispecies biofilms by an anti-biofilm peptide. PLoS One 10: e0132512. https://doi.org/10.1371/journal.pone.0132512
|
| [32] |
Alovisi M, Pasqualini D, Mandras N, et al. (2022) Confocal laser scanner evaluation of bactericidal effect of chitosan nanodroplets loaded with benzalkonium chloride. J Clin Med 11: 1650. https://doi.org/10.3390/jcm11061650
|
| [33] |
Wood SR, Kirkham J, Marsh PD, et al. (2000) Architecture of intact natural human plaque biofilms studied by confocal laser scanning microscopy. J Dent Res 79: 21-27.
|
| [34] |
Di Pippo F, Venezia C, Sighicelli M, et al. (2020) Microplastic-associated biofilms in lentic Italian ecosystems. Water Res 187: 116429. https://doi.org/10.1016/j.watres.2020.116429
|
| [35] | Zhang YS, Li NY (2007) Current application of confocal laser scanning microscope (CLSM) in stomatology. Shanghai Kou Qiang Yi Xue 16: 219-24. |
| [36] |
Carvalho FG, Puppin-Rontani RM, Fúcio SB, et al. (2012) Analysis by confocal laser scanning microscopy of the MDPB bactericidal effect on S. mutans biofilm CLSM analysis of MDPB bactericidal effect on biofilm. J Appl Oral Sci 20: 568-75. https://doi.org/10.1590/s1678-77572012000500013
|
| [37] |
Zago LHP, de Annunzio SR, de Oliveira KT, et al. (2020) Antimicrobial photodynamic therapy against metronidazole-resistant dental plaque bactéria. J Photochem Photobiol B 209: 111903. https://doi.org/10.1016/j.jphotobiol.2020.111903
|
| [38] |
Li H, Liu H, Zhang L, et al. (2023) Evaluation of extracellular polymeric substances matrix volume, surface roughness and bacterial adhesion property of oral biofilm. J Dent Sci 18: 1723-1730. https://doi.org/10.1016/j.jds.2022.12.022
|
| [39] |
Salavadhi SS, Chintalapani S, Ramachandran R, et al. (2017) Atomic Force Microscopy: A three-dimensional reconstructive tool of oral microbiota in gingivitis and periodontitis. J Indian Soc Periodontol 21: 264-269. https://doi.org/10.4103/jisp.jisp_209_17
|
| [40] |
Wang R, Wang Y, Lei Z, et al. (2022) Glucosyltransferase-modulated Streptococcus mutans adhesion to different surfaces involved in biofilm formation by atomic force microscopy. Microbiol Immunol 66: 493-500. https://doi.org/10.1111/1348-0421.13025
|
| [41] |
Tang G, Yip HK, Samaranayake LP, et al. (2004) Direct detection of cell surface interactive forces of sessile, fimbriated and non-fimbriated Actinomyces spp. using atomic force microscopy. Arch Oral Biol 49: 727-38. https://doi.org/10.1016/j.archoralbio.2004.04.003
|
| [42] |
Shan T, Huang L, Tay FR, et al. (2022) Retention of intrafibrillar minerals improves resin-dentin bond durability. J Dent Res 101: 1490-1498. https://doi.org/10.1177/00220345221103137
|
| [43] |
Ioannidis K, Niazi S, Mylonas P, et al. (2019) The synthesis of nano silver-graphene oxide system and its efficacy against endodontic biofilms using a novel tooth model. Dent Mater 35: 1614-1629. https://doi.org/10.1016/j.dental.2019.08.105
|
| [44] | Fathi F, Sadrnia M, Arjomandzadegan M, et al. (2021) In vitro and in vivo evaluation of antibacterialantibacterial and anti-biofilm properties of five ethnomedicinal plants against oral bacteria by TEM. Avicenna J Phytomed 11: 180-189. |
| [45] |
Vitkov L, Hermann A, Krautgartner WD, et al. (2005) Chlorhexidine-induced ultrastructural alterations in oral biofilm. Microsc Res Tech 68: 85-89. https://doi.org/10.1002/jemt.20238
|
| [46] |
Keleş A, Keskin C, Kalkan M, et al. (2021) Visualization and characterization of Enterococcus faecalis biofilm structure in bovine dentin using 2D and 3D microscopic techniques. Arch Microbiol 203: 269-277. https://doi.org/10.1007/s00203-020-02031-6
|
| [47] | Zhao X, Wan P, Wang H, et al. (2020) An antibacterialantibacterial strategy of mg-cu bone grafting in infection-mediated periodontics. Biomed Res Int 2020: 7289208. https://doi.org/10.1155/2020/7289208 |
| [48] |
Postek MT, Vladár AE (2013) Does your SEM really tell the truth?--How would you know? Part 1. Scanning 35: 355-361. https://doi.org/10.1002/sca.21075
|
| [49] |
Jaeggi M, Gyr S, Astasov-Frauenhoffer M, et al. (2022) Influence of different zirconia surface treatments on biofilm formation in vitro and in situ. Clin Oral Implants Res 33: 424-432. https://doi.org/10.1111/clr.13902
|
| [50] |
Georgiev KG, Filipov IA, Dobrev IN (2018) In Vivo Collection and SEM identification of oral biofilm using indirect composite prototype restorations. Folia Med (Plovdiv) 60: 300-307. https://doi.org/10.1515/folmed-2017-0092
|
| [51] |
Li YY, Li BS, Liu WW, et al. (2020) Effects of D-arginine on Porphyromonas gingivalis biofilm. J Oral Sci 62: 57-61. https://doi.org/10.2334/josnusd.19-0075
|
| [52] |
Kanagasingam S, von Ruhland C, Welbury R, et al. (2022) Ex vivo detection of amyloid-β in naturally formed oral biofilm. J Alzheimers Dis Rep 6: 757-773. https://doi.org/10.3233/ADR-220076
|
| [53] | Relucenti M, Familiari G, Donfrancesco O, et al. (2021) Microscopy methods for biofilm imaging: focus on SEM and VP-SEM pros and cons. Biology (Basel) 10: 51. https://doi.org/10.3390/biology10010051 |
| [54] |
Bossù M, Selan L, Artini M, et al. (2020) Characterization of Scardovia wiggsiae biofilm by original scanning electron microscopy protocol. Microorganisms 8: 807. https://doi.org/10.3390/microorganisms8060807
|
| [55] |
Saglie FR, Carranza FA, Newman MG (1985) The presence of bacteria within the oral epithelium in periodontal disease. I. A scanning and transmission electron microscopic study. J Periodontol 56: 618-624. https://doi.org/10.1902/jop.1985.56.10.618
|
| [56] |
AA, Leapman RD (2012) Development and application of STEM for the biological sciences. Ultramicroscopy 123: 38-49. https://doi.org/10.1016/j.ultramic.2012.04.005
|
| [57] |
Hickey WJ, Shetty AR, Massey RJ, et al. (2017) Three-dimensional bright-field scanning transmission electron microscopy elucidate novel nanostructure in microbial biofilms. J Microsc 265: 3-10. https://doi.org/10.1111/jmi.12455
|
| [58] |
Takahashi C, Muto S, Yamamoto H (2017) A microscopy method for scanning transmission electron microscopy imaging of the antibacterialantibacterial activity of polymeric nanoparticles on a biofilm with an ionic liquid. J Biomed Mater Res Part B 105: 1432-1437. https://doi.org/10.1002/jbm.b.33680
|
| [59] |
Pathak A, Pv S, Stanley J, et al. (2019) Multicolor emitting N/S-doped carbon dots as a fluorescent probe for imaging pathogenic bacteria and human buccal epithelial cells. Mikrochim Acta 186: 157. https://doi.org/10.1007/s00604-019-3270-7
|
| [60] |
Azad A, Rostamifar S, Modaresi F, et al. (2020) Assessment of the antibacterialantibacterial effects of bismuth nanoparticles against Enterococcus faecalis. Biomed Res Int 2020: 5465439. https://doi.org/10.1155/2020/5465439
|
| [61] |
Ahmed O, Sibuyi NRS, Fadaka AO, et al. (2022) Antimicrobial effects of gum arabic-silver nanoparticles against oral pathogens. Bioinorg Chem Appl 2022: 9602325. https://doi.org/10.1155/2022/9602325
|
| [62] |
Jardón-Romero EA, Lara-Carrillo E, González-Pedroza MG, et al. (2022) Antimicrobial activity of biogenic silver nanoparticles from Syzygium aromaticumagainst the five most common microorganisms in the oral cavity. Antibiotics (Basel) 11: 834. https://doi.org/10.3390/antibiotics11070834
|
| [63] |
Liu W, Jing C, Liu X, et al. (2022) 3D imaging of single bacterial cells using surface-enhanced Raman spectroscopy with a multivariate curve resolution model. Analyst 147: 223-229. https://doi.org/10.1039/d1an01879e
|
| [64] |
Darch SE, Koley D (2018) Quantifying microbial chatter: scanning electrochemical microscopy as a tool to study interactions in biofilms. Proc R Soc A 474: 20180405. http://dx.doi.org/10.1098/rspa.2018.0405
|
| [65] |
Koley D (2022) Electrochemical sensors for oral biofilm-biomaterials interface characterization: A review. Mol Oral Microbiol 37: 292-298. https://doi.org/10.1111/omi.12396
|
| [66] |
Joshi VS, Kreth J, Koley D (2017) Pt-decorated MWCNTs-Ionic liquid composite-based hydrogen peroxide sensor to study microbial metabolism using scanning electrochemical microscopy. Anal Chem 89: 7709-7718. https://doi.org/10.1021/acs.analchem.7b01677
|
| [67] |
Jayathilake NM, Koley D (2020) Glucose microsensor with covalently immobilized glucose oxidase for probing bacterial glucose uptake by scanning electrochemical microscopy. Anal Chem 92: 3589-3597. https://doi.org/10.1021/acs.analchem.9b04284
|
| [68] |
Joshi VS, Sheet PS, Cullin N, et al. (2017) Real-time metabolic interactions between two bacterial species using a carbon-based ph microsensor as a scanning electrochemical microscopy probe. Anal Chem 89: 11044-11052. https://doi.org/10.1021/acs.analchem.7b03050
|
| [69] |
Park S, Kumar S, Maier CS, et al. (2023) Simultaneous chemical mapping of live biofilm microenvironmental ph and hydrogen peroxide in real time with a triple scanning electrochemical microscopy tip. Anal Chem 95: 6332-6340. https://doi.org/10.1021/acs.analchem.2c05258
|
| [70] |
Dige I, Schlafer S, Nyvad B (2012) Difference in initial dental biofilm accumulation between night and day. Acta Odontol Scand 70: 441-447. https://doi.org/10.3109/00016357.2011.634833
|
| [71] |
Dige I, Nyengaard JR, Kilian M, et al. (2009) Application of stereological principles for quantification of bacteria in intact dental biofilms. Oral Microbiol Immunol 24: 69-75. https://doi.org/10.1111/j.1399-302X.2008.00482.x
|
| [72] | Ding H, Yang Y, Li X, et al. (2022) A simple AI-enabled method for quantifying bacterial adhesion on dental materials. Biomater Investig Dent 9: 75-83. https://doi.org/10.1080/26415275.2022.2114479 |
| [73] |
Mironov AA, Beznoussenko GV (2013) Correlative microscopy. Methods Cell Biol 113: 209-255. https://doi.org/10.1016/B978-0-12-407239-8.00011-2
|
| [74] |
Howes SC, Koning RI, Koster AJ (2018) Correlative microscopy for structural microbiology. Curr Opin Microbiol 43: 132-138. https://doi.org/10.1016/j.mib.2018.01.009
|
| [75] |
Lange F, Agüi-Gonzalez P, Riedel D, et al. (2021) Correlative fluorescence microscopy, transmission electron microscopy and secondary ion mass spectrometry (CLEM-SIMS) for cellular imaging. PLoS One 16: e0240768. https://doi.org/10.1371/journal.pone.0240768
|
| [76] |
Daddi Oubekka S, Briandet R, Fontaine-Aupart MP, et al. (2012) Correlative time-resolved fluorescence microscopy to assess antibiotic diffusion-reaction in biofilms. Antimicrob Agents Chemother 56: 3349-58. https://doi.org/10.1128/AAC.00216-12
|


Figures(5) / Tables(3)

Davide Gerardi, Sara Bernardi, Angelo Bruni, Giovanni Falisi, Gianluca Botticelli. Characterization and morphological methods for oral biofilm visualization: where are we nowadays?[J]. AIMS Microbiology, 2024, 10(2): 391-414. doi: 10.3934/microbiol.2024020


 DownLoad: