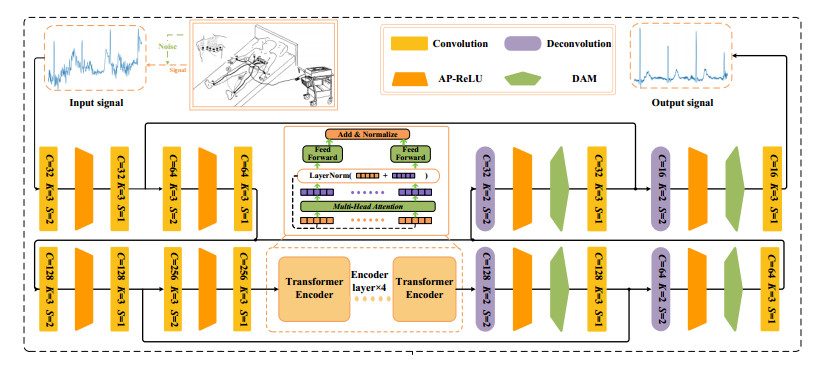
The electrocardiogram (ECG) is a widely used diagnostic tool for cardiovascular diseases. However, ECG recording is often subject to various noises, which can limit its clinical evaluation. To address this issue, we propose a novel Transformer-based convolutional neural network framework with adaptively parametric ReLU (APtrans-CNN) for ECG signal denoising. The proposed APtrans-CNN architecture combines the strengths of transformers in global feature learning and CNNs in local feature learning to address the inadequacy of learning with long sequence time-series features. By fully exploiting the global features of ECG signals, our framework can effectively extract critical information that is necessary for signal denoising. We also introduce an adaptively parametric ReLU that can assign a value to the negative information contained in the ECG signal, thereby overcoming the limitation of ReLU to retain negative information. Additionally, we introduce a dynamic feature aggregation module that enables automatic learning and retention of valuable features while discarding useless noise information. Results obtained from two datasets demonstrate that our proposed APtrans-CNN can accurately extract pure ECG signals from noisy datasets and is adaptable to various applications. Specifically, when the input consists of ECG signals with a signal-to-noise ratio (SNR) of -4 dB, APtrans-CNN successfully increases the SNR to more than 6 dB, resulting in the diagnostic model's accuracy exceeding 96%.
Citation: Jing Wang, Shicheng Pei, Yihang Yang, Huan Wang. Convolutional transformer-driven robust electrocardiogram signal denoising framework with adaptive parametric ReLU[J]. Mathematical Biosciences and Engineering, 2024, 21(3): 4286-4308. doi: 10.3934/mbe.2024189
The electrocardiogram (ECG) is a widely used diagnostic tool for cardiovascular diseases. However, ECG recording is often subject to various noises, which can limit its clinical evaluation. To address this issue, we propose a novel Transformer-based convolutional neural network framework with adaptively parametric ReLU (APtrans-CNN) for ECG signal denoising. The proposed APtrans-CNN architecture combines the strengths of transformers in global feature learning and CNNs in local feature learning to address the inadequacy of learning with long sequence time-series features. By fully exploiting the global features of ECG signals, our framework can effectively extract critical information that is necessary for signal denoising. We also introduce an adaptively parametric ReLU that can assign a value to the negative information contained in the ECG signal, thereby overcoming the limitation of ReLU to retain negative information. Additionally, we introduce a dynamic feature aggregation module that enables automatic learning and retention of valuable features while discarding useless noise information. Results obtained from two datasets demonstrate that our proposed APtrans-CNN can accurately extract pure ECG signals from noisy datasets and is adaptable to various applications. Specifically, when the input consists of ECG signals with a signal-to-noise ratio (SNR) of -4 dB, APtrans-CNN successfully increases the SNR to more than 6 dB, resulting in the diagnostic model's accuracy exceeding 96%.

| [1] |
X. Liu, H. Wang, Z. Li, L. Qin, Deep learning in ECG diagnosis: a review, Knowl.-Based Syst., 227 (2021), 107187. https://doi.org/10.1016/j.knosys.2021.107187 doi: 10.1016/j.knosys.2021.107187

|
| [2] |
S. Agrawal, A. Gupta, Fractal and EMD based removal of baseline wander and powerline interference from ECG signals, Comput. Biol. Med., 43 (2013), 1889–1899. https://doi.org/10.1016/j.compbiomed.2013.07.030 doi: 10.1016/j.compbiomed.2013.07.030
|
| [3] |
E. Erçelebi, Electrocardiogram signals de-noising using lifting-based discrete wavelet transform, Comput. Biol. Med., 34 (2004), 479–493. https://doi.org/10.1016/S0010-4825(03)00090-8 doi: 10.1016/S0010-4825(03)00090-8
|
| [4] |
Z. F. M. Apandi, R. Ikeura, S. Hayakawa, S. Tsutsumi, An analysis of the effects of noisy electrocardiogram signal on heartbeat detection performance, Bioengineering, 7 (2020), 53. https://doi.org/10.3390/bioengineering7020053 doi: 10.3390/bioengineering7020053
|
| [5] |
A. O. Boudraa, J. C. Cexus, EMD-based signal filtering, IEEE Trans. Instrum. Meas., 56 (2007), 2196–2202. https://doi.org/10.1109/TIM.2007.907967 doi: 10.1109/TIM.2007.907967
|
| [6] |
X. Chen, X. Xu, A. Liu, M. J. McKeown, Z. J. Wang, The use of multivariate EMD and CCA for denoising muscle artifacts from few-channel EEG recordings, IEEE Trans. Instrum. Meas., 67 (2018), 359–370. https://doi.org/10.1109/TIM.2017.2759398 doi: 10.1109/TIM.2017.2759398
|
| [7] |
M. Z. U. Rahman, R. A. Shaik, D. V. R. K. Reddy, Efficient and simplified adaptive noise cancelers for ECG sensor based remote health monitoring, IEEE Sens. J., 12 (2012), 566–573. https://doi.org/10.1109/JSEN.2011.2111453 doi: 10.1109/JSEN.2011.2111453
|
| [8] |
S. Banerjee, M. Mitra, Application of cross wavelet transform for ECG pattern analysis and classification, IEEE Trans. Instrum. Meas., 63 (2014), 326–333. https://doi.org/10.1109/TIM.2013.2278430 doi: 10.1109/TIM.2013.2278430
|
| [9] |
R. Ranjan, B. C. Sahana, A. K. Bhandari, Cardiac artifact noise removal from sleep EEG signals using hybrid denoising model, IEEE Trans. Instrum. Meas., 71 (2022), 1–10. https://doi.org/10.1109/TIM.2022.3198441 doi: 10.1109/TIM.2022.3198441
|
| [10] | B. Weng, M. Blanco-Velasco, K. E. Barner, ECG denoising based on the empirical mode decomposition, in 2006 International Conference of the IEEE Engineering in Medicine and Biology Society, (2006), 1–4. https://doi.org/10.1109/IEMBS.2006.260749 |
| [11] | C. Chandrakar, M. Kowar, Denoising ECG signals using adaptive filter algorithm, Int. J. Soft Comput. Eng., 2 (2012), 120–123. |
| [12] | G. Reddy, M. Muralidhar, S. Varadarajan, ECG de-noising using improved thresholding based on wavelet transforms, Int. J. Comput. Sci. Netw. Secur., 9 (2009), 221–225. |
| [13] | C. T. C. Arsene, R. Hankins, H. Yin, Deep learning models for denoising ECG signals, in 2019 27th European Signal Processing Conference (EUSIPCO), (2019), 1–5. https://doi.org/10.23919/EUSIPCO.2019.8902833 |
| [14] |
P. Singh, G. Pradhan, A new ECG denoising framework using generative adversarial network, IEEE/ACM Trans. Comput. Biol. Bioinf., 18 (2021), 759–764. https://doi.org/10.1109/TCBB.2020.2976981 doi: 10.1109/TCBB.2020.2976981
|
| [15] |
Z. Liu, H. Wang, Y. Gao, S. Shi, Automatic attention learning using neural architecture search for detection of cardiac abnormality in 12-Lead ECG, IEEE Trans. Instrum. Meas., 70 (2021), 1–12. https://doi.org/10.1109/TIM.2021.3109396 doi: 10.1109/TIM.2021.3109396
|
| [16] |
L. Qin, Y. Xie, X. Liu, X. Yuan, H. Wang, An end-to-end 12-Leading electrocardiogram diagnosis system based on deformable convolutional neural network with good antinoise ability, IEEE Trans. Instrum. Meas., 70 (2021), 1–13. https://doi.org/10.1109/TIM.2021.3073707 doi: 10.1109/TIM.2021.3073707
|
| [17] |
S. Hong, Y. Zhou, J. Shang, C. Xiao, J. Sun, Opportunities and challenges of deep learning methods for electrocardiogram data: a systematic review, Comput. Biol. Med., 122 (2020), 103801. https://doi.org/10.1016/j.compbiomed.2020.103801 doi: 10.1016/j.compbiomed.2020.103801
|
| [18] | K. Antczak, Deep recurrent neural networks for ECG signal denoising, preprint, arXiv: 1807.11551. https://doi.org/10.48550/arXiv.1807.11551 |
| [19] |
S. Chatterjee, R. S Thakur, R. N. Yadav, L. Gupta, D. K. Raghuvanshi, Review of noise removal techniques in ECG signals, IET Signal Process., 14 (2020), 569–590. https://doi.org/10.1049/iet-spr.2020.0104 doi: 10.1049/iet-spr.2020.0104
|
| [20] |
H. Chiang, Y. Hsieh, S. Fu, K. Hung, Y. Tsao, S. Chien, Noise reduction in ECG signals using fully convolutional denoising autoencoders, IEEE Access, 7 (2019), 60806–60813. https://doi.org/10.1109/ACCESS.2019.2912036 doi: 10.1109/ACCESS.2019.2912036
|
| [21] |
P. Singh, A. Sharma, Attention-based convolutional denoising autoencoder for two-lead ECG denoising and arrhythmia classification, IEEE Trans. Instrum. Meas., 71 (2022), 3137710. https://doi.org/10.1109/TIM.2021.3137710 doi: 10.1109/TIM.2021.3137710
|
| [22] |
F. Samann, T. Schanze, RunDAE model: running denoising autoencoder models for denoising ECG signals, Comput. Biol. Med., 166 (2023), 107553. https://doi.org/10.1016/j.compbiomed.2023.107553 doi: 10.1016/j.compbiomed.2023.107553
|
| [23] |
P. Xiong, H. Wang, M. Liu, S. Zhou, Z. Hou, X. Liu, ECG signal enhancement based on improved denoising auto-encoder, Eng. Appl. Artif. Intell., 52 (2016), 194–202. https://doi.org/10.1016/j.engappai.2016.02.015 doi: 10.1016/j.engappai.2016.02.015
|
| [24] | E. Fotiadou, T. Konopczyński, J. Hesser, R. Vullings, Deep convolutional encoder-decoder framework for fetal ECG signal denoising, in 2019 Computing in Cardiology (CinC), (2019), 1–4. https://doi.org/10.22489/CinC.2019.015 |
| [25] |
R. Hu, J. Chen, L. Zhou, A transformer-based deep neural network for arrhythmia detection using continuous ECG signals, Comput. Biol. Med., 144 (2022), 105325. https://doi.org/10.1016/j.compbiomed.2022.105325 doi: 10.1016/j.compbiomed.2022.105325
|
| [26] |
L. Meng, W. Tan, J. Ma, R. Wang, X. Yin, Y. Zhang, Enhancing dynamic ECG heartbeat classification with lightweight transformer model, Artif. Intell. Med., 124 (2022), 102236. https://doi.org/10.1016/j.artmed.2021.102236 doi: 10.1016/j.artmed.2021.102236
|
| [27] |
Y. Xia, Y. Xu, P. Chen, J. Zhang, Y. Zhang, Generative adversarial network with transformer generator for boosting ECG classification, Biomed. Signal Process. Control, 80 (2023), 104276. https://doi.org/10.1016/j.bspc.2022.104276 doi: 10.1016/j.bspc.2022.104276
|
| [28] |
Y. Xia, Y. Xiong, K. Wang, A transformer model blended with CNN and denoising autoencoder for inter-patient ECG arrhythmia classification, Biomed. Signal Process. Control, 86 (2023), 105271. https://doi.org/10.1016/j.bspc.2022.105271 doi: 10.1016/j.bspc.2022.105271
|
| [29] |
J. Yin, A. Liu, C. Li, R. Qian, X. Chen, A GAN guided parallel CNN and transformer network for EEG denoising, IEEE J. Biomed. Health Inf., 2023. https://doi.org/10.1109/JBHI.2023.3146990 doi: 10.1109/JBHI.2023.3146990
|
| [30] |
X. Pu, P. Yi, K. Chen, Z. Ma, D. Zhao, Y. Ren, EEGDnet: Fusing non-local and local self-similarity for EEG signal denoising with transformer, Comput. Biol. Med., 151 (2022), 106248. https://doi.org/10.1016/j.compbiomed.2022.106248 doi: 10.1016/j.compbiomed.2022.106248
|
| [31] |
J. Hu, L. Shen, G. Sun, Squeeze-and-excitation networks, IEEE Trans. Pattern Anal. Mach. Intell., 42 (2020), 2011–2023. https://doi.org/10.1109/CVPR.2018.00745 doi: 10.1109/CVPR.2018.00745
|
| [32] | S. Woo, J. Park, J. Lee, I. S. Kweon, CBAM: Convolutional block attention module, in Proceedings of the European conference on computer vision (ECCV), (2018), 3–19. https://doi.org/10.1007/978-3-030-01234-2_1 |
| [33] |
M. Zhao, S. Zhong, X. Fu, B. Tang, S. Dong, M. Pecht, Deep residual networks with adaptively parametric rectifier linear units for fault diagnosis, IEEE Trans. Ind. Electron., 68 (2021), 2587–2597. https://doi.org/10.1109/TIE.2020.2972458 doi: 10.1109/TIE.2020.2972458
|
| [34] |
A. Vaswani, N. Shazeer, N. Parmar, J. Uszkoreit, L. Jones, A. N. Gomez, et al., Attention is all you need, Adv. Neural Inf. Process. Syst., (2017), 30. https://doi.org/10.5555/3295222.3295349 doi: 10.5555/3295222.3295349
|
| [35] |
G. B. Moody, R. G. Mark, The impact of the MIT-BIH arrhythmia database, IEEE Eng. Med. Biol. Mag., 20 (2001), 45–50. https://doi.org/10.1109/51.932724 doi: 10.1109/51.932724
|
| [36] | M. B. George, R. G. Mark, A new method for detecting atrial fibrillation using RR intervals, Comput. Cardiol., (1983), 227–230. |
| [37] |
A. L. Goldberger, L. A. Amaral, L. Glass, J. M. Hausdorff, P. C. Ivanov, R. G. Mark, et al., PhysioBank, PhysioToolkit, and PhysioNet: components of a new research resource for complex physiologic signals, Circulation, 101 (2000), e215–e220. https://doi.org/10.1161/01.CIR.101.23.e215 doi: 10.1161/01.CIR.101.23.e215
|
| [38] | G. B. Moody, W. Muldrow, A noise stress test for arrhythmia detectors, Comput. Cardiol., 11 (1984), 381–384. |
| [39] |
H. T. Chiang, Y. Hsieh, S. Fu, K. Hung, Y. Tsao, S. Chien, Noise reduction in ECG signals using fully convolutional denoising autoencoders, IEEE Access, 7 (2019), 60806–60813. https://doi.org/10.1109/ACCESS.2019.2912036 doi: 10.1109/ACCESS.2019.2912036
|
| [40] |
G. Sannino, G. D. Pietro, A deep learning approach for ECG-based heartbeat classification for arrhythmia detection, Future Gener. Comput. Syst., 86 (2018), 446–455. https://doi.org/10.1016/j.future.2018.03.057 doi: 10.1016/j.future.2018.03.057
|
| [41] |
L. Qiu, W. Cai, Two-stage ECG signal denoising based on deep convolutional network, Physiol. Meas., 42 (2021), 115002. https://doi.org/10.1088/1361-6579/ac34ea doi: 10.1088/1361-6579/ac34ea
|
| [42] |
H. Wang, H. Shi, An improved convolutional neural network based approach for automated heartbeat classification, J. Med. Syst., 44 (2020), 1–9. https://doi.org/10.1007/s10916-019-1511-2 doi: 10.1007/s10916-019-1511-2
|
| [43] |
X. Xu, H. Liu, ECG heartbeat classification using convolutional neural networks, IEEE Access, 8 (2020), 8614–8619. https://doi.org/10.1109/ACCESS.2020.2964749 doi: 10.1109/ACCESS.2020.2964749
|


Figures(9) / Tables(5)

Jing Wang, Shicheng Pei, Yihang Yang, Huan Wang. Convolutional transformer-driven robust electrocardiogram signal denoising framework with adaptive parametric ReLU[J]. Mathematical Biosciences and Engineering, 2024, 21(3): 4286-4308. doi: 10.3934/mbe.2024189


 DownLoad: